Footnotes and Flashbacks: Week Ending April 23, 2023
The earnings season chatter still reflects a pitched battle between bulls and bears, but that is still much better than a depositor panic.
“Why did you withdraw all your deposits?”
This Week’s Macro: Asset class and ETF sector returns; yield curve migration trends; HY vs. IG spread differentials; BB vs. BBB quality spreads.
This Weeks’s Micro: The week brought relief for Regional Banks, but the relative absence of panic is not cyclical confidence in bank expectations or comfort with the trends in margins or risk appetites.
MACRO
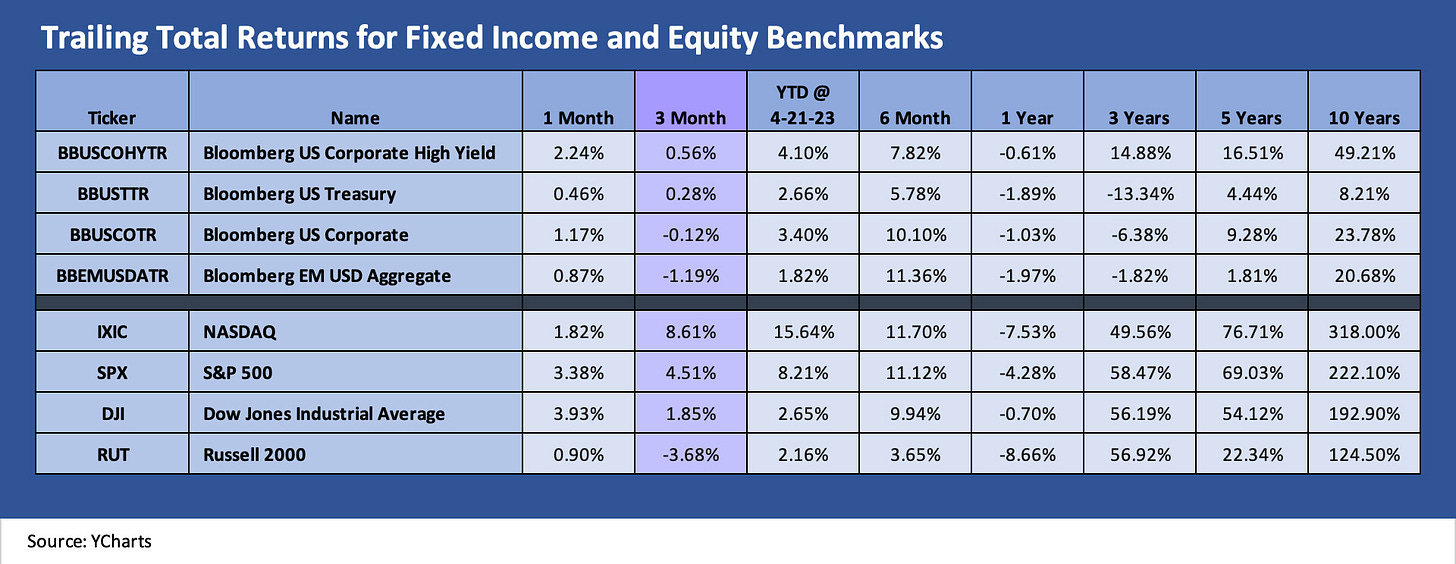
The above chart updates the main fixed income and equity benchmarks we track. We line them up for each asset class in descending order of total return for the trailing 3-month period. The US HY index is back in the lead for the 3M period after a solid rally month with the ugliness of early March and the depositor panic dropping out of the 1-month measurement period. Meanwhile, the trailing 3-month period shows the US IG benchmark in the red along with EM slightly worse than that.
The compression of returns across the debt assets are not showing much compensation for the incremental credit risks taken in US HY and EM. The broader equity benchmarks still are penalizing small cap equities with the NASDAQ well out in front over the trailing 3M period but S&P is mounting a small comeback attempt over the past month.
The 1500 and 3000 series are showing some rallies in Energy and Russell 3000 value the past month but are still in the red trailing 3-month with #1 Russell 3000 growth more than 4x the total return of #2 S&P 1500 Industrials. The remaining 4 indexes are still in the red for the trailing 3 months. A lot of financial media airtime and column space has been dedicated to the lack of breadth and relative concentration of the large cap winners bouncing off a horrid 2022. The above chart agrees.
ETF returns…
The next two charts cover 23 ETFs and benchmarks in the ranked bar chart plus one ETF on the side with the Regional Banks (KRE). The collection covers a wide range of industry groups and fixed income proxies.
1-month ETF returns…
The 1-month ETF returns show all 23 in the black from Utilities and Energy on the left in the top of the rankings over to the UST ETF (GOVT) on the right. We isolate the Regional Bank ETF (KRE) which we recently added as that ETF posted a -6.8% return for the month.
An interesting outperformer for the month in the Top 5 over on the left is the Homebuilding ETF (XHB) at #5 after a few bellwethers have reported. The leaders showed decent diversity across industry groups while the weakest performers showed 3 of the bottom 4 from the ETF debt proxies. HY bonds was a little higher in the ranks vs. debt peers. Small cap equities remain in the tank.
The 3-month ETF rankings continue to show the fallout from the depositor panic after SVB. Those in the red zone only slightly outnumbered the positive in the 23 bars, but the 24th ETF was regional banks, and that got its own box at -27.6%. In the MICRO section below, we offer some shorter equity time horizons on the regionals. They are still deeply underwater even after the rallies.
UST migration since the end of ZIRP…
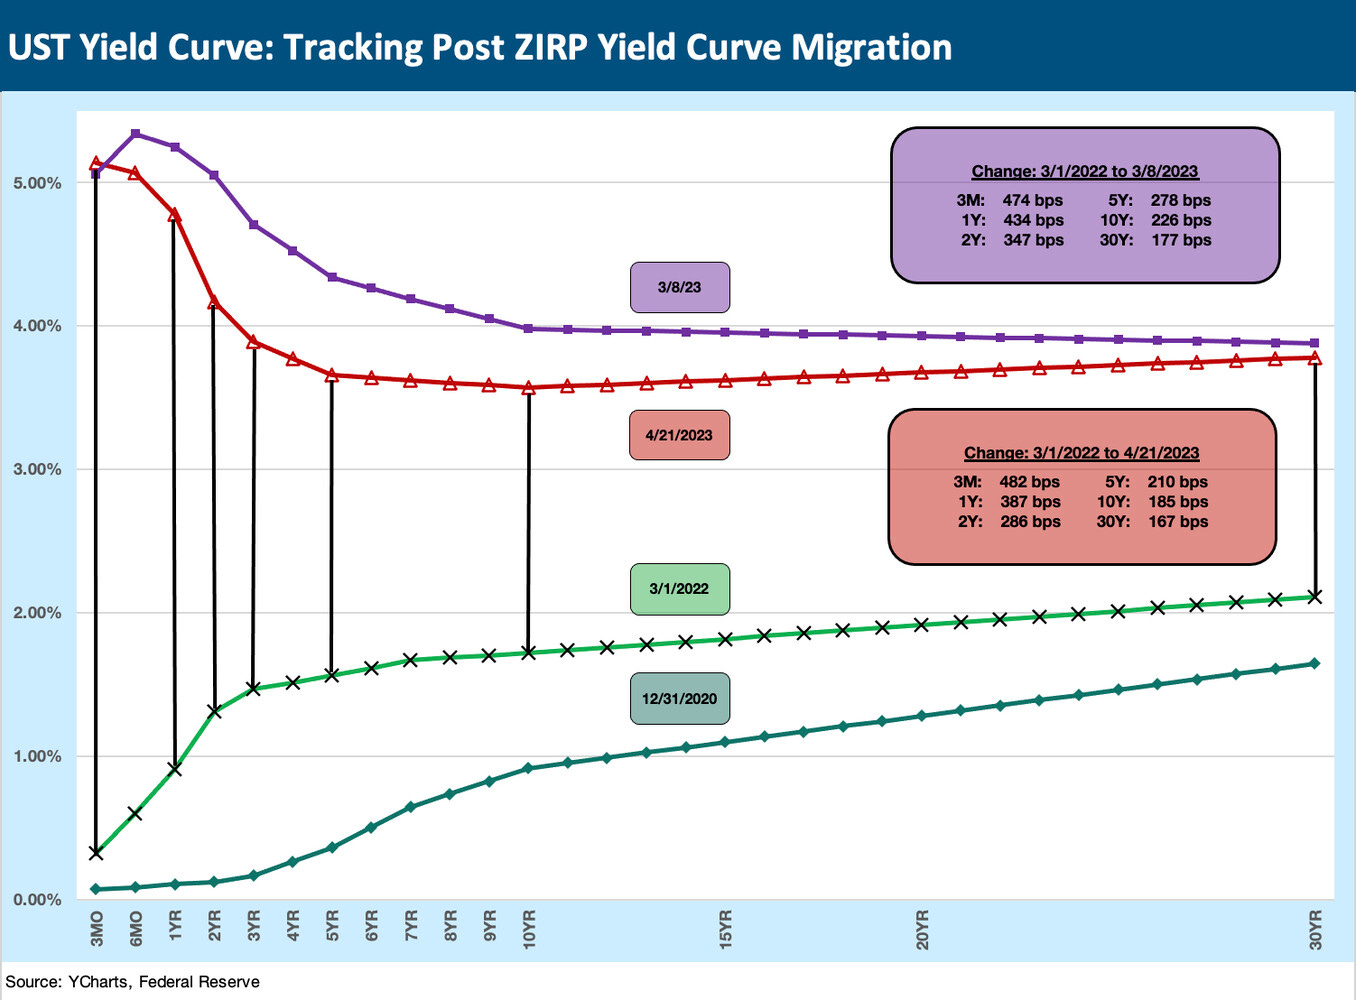
Our weekly UST curve migration is updated above. As a reminder, we look at the moves in the UST curve from March 1, 2022 to the current period. Mid-March-2022 saw the end of ZIRP, and this chart updates how far the curve has moved. We also include a box chart with the differentials across the curve. We have one box for the March 8, 2023 UST peak of the migration ahead of the SVB panic. The 3M peak was eclipsed along the way, but we are staying with that March 8 pre-SVB curve as a frame of reference for where the curve has moved since then.
For this week, the UST curve saw a very slight upward migration with only the 2Y UST making a double digit move at +11 bps since last week’s time stamp on this chart. The 30Y mortgage was higher this week and was back up over 6.6%. The 3M and 6M UST are both over 5%.
The above chart zeroes in on the quality spread differential between the US HY index and the IG index (ICE) for the timeline from the start of 2022 through this past Friday close. That period from Jan 2022 cuts across the period from the last month of ZIRP (March 2022) on through the Fed tightening cycle and the mix of inflation anxiety and recent depositor panics. The timeline runs from ZIRP to 5% and with the most rapid upward UST curve migration since the Volcker years. The asset allocation realignments have been unfolding fast and furious in the markets for many asset allocators.
We look at the spread histories in depth in earlier commentaries (see Spreads Across Tiers: Decompression + Volatility 3-18-23, US HY Spread Histories: Weird Science, New Parts 3-19-23, IG Corporate Spreads: Tough Pathway, A Few Doors Ahead 3-19-23), so this gets the charts updated for the latest rally in US HY after the post-SVB spike.
The current HY-IG quality spread differential of +308 bps is comfortably inside the long term post-1996 median of around +340 bps, so the incremental yield pickup for the HY index basket is modest. The BB heavy HY market is a much higher quality overall mix than the later 1990s when the B tier was around half the index while today the BB tier is around that same share of the index.
The numbers for 2022 and into 2023 show the HY-IG quality spread range hit a low of +208 bps in March 2022 and a high of +432 bps in early July 2022. The gapping of quality spreads into July and rally into August was much more pronounced than the recent whipsaw. The chart shows some peaks and valleys, but that spring to early summer move is the type of move that could easily unfold in 2H23 if the consumer fades or the crazies in Washington decide to “over-brand” themselves as purists ahead of an election year and we head down the sovereign default path.
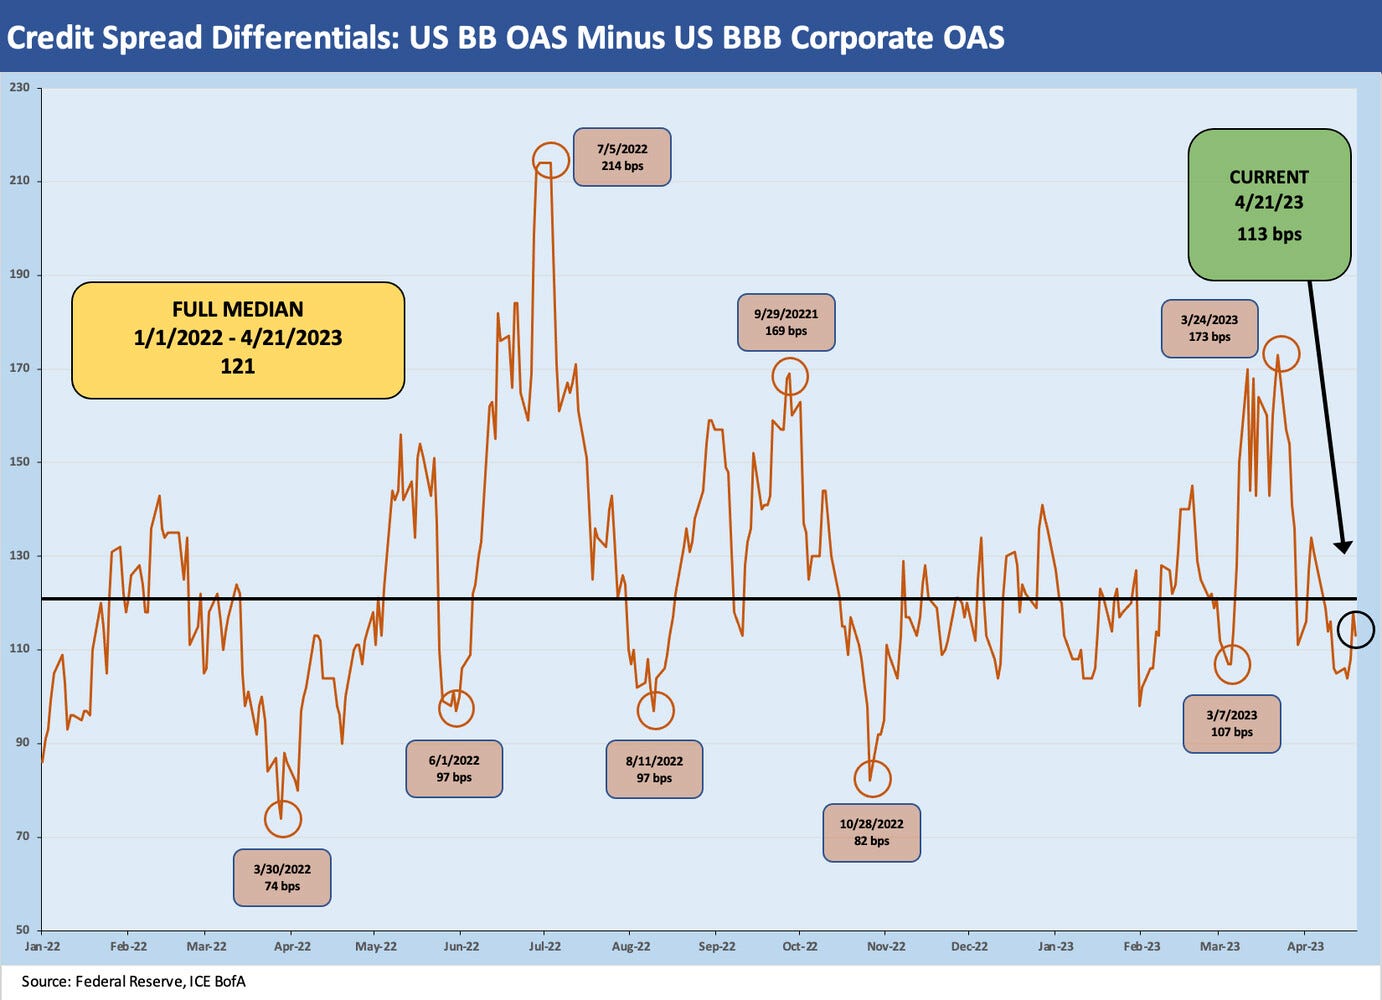
The above chart uses the same time horizon to frame a less threatening quality spread differential but one which every BBB owner needs to think about. The sensitivity of the BBB owners to recession risk is always important but especially now when stagflation cannot yet be ruled out and the moving parts of domestic politics and geopolitics are about as bad as they can get short of something none of us has seen before.
As with the US HY-US IG differential, the BB-BBB differential of +113 bps is modestly below the long-term median of around +138 bps. Since the Jan 2022 start date in the time series, we saw lows of +74 bps ahead of a gap out to +214 during the spread wave of the early summer of 2022. The market whipped around and hit a few sub-100 bps lows including +82 bps in late October 2022.
The post-SVB March wide of +173 in quality spreads comes with the asterisk that the widening from above in BBB tier bank paper was also very much at work beyond the US HY BB tier weakening. The widening for the BBB tier from March 8 was around 40 bps while the BB tier widened around 94 bps in those mid-March days. For a long duration benchmark such as BBBs, that is a painful 40 bps move.
It should be noted that the BBB tier did not crack +200 bps in the ICE index (it came close) in this recent SVB wave, but it had done so in July, Sept, Oct, and Nov of 2022. In other words, the medium grade tiers have remained quite resilient across the steady Fed tightening, the recession debates, the swings in oil prices, and a material depositor shock.
MICRO
For the MICRO section this week, we thought it was worth looking at how the equity markets reacted to the waves of earnings reports from the major banks, the regional banks, and consumer finance operators who have reported so far for the March quarter. Below we look at the trailing time horizons from the past week with so many reporting. We highlight the post-March 8 period (note: SVB self-immolated on March 9 and did not open for trading March 10 ahead of being seized). We also include the usual trailing time horizons.
The Regional Bank drama still shows what a beating the markets took in the above table. We line up in descending order of returns for the stocks since last Friday to give weight to the rebound week as numerous companies reported another week of flows that could be watched and as the sense of panic eased with time. The week ran the gamut in returns with WAL rallying the most by far with PacWest next followed by First Republic.
The post-3/8/23 column shows the residual damage for the names on the list, and the damage is still massive. While the color from some earnings calls and disclosure was that the deposit run had been mitigated by activist regulators and liquidity lines, the reality of materially higher cost of funds and interest margin squeezes were important unavoidable takeaways the bank analysts will be sorting out. They will be trying to gauge what type of retrenchment in risks and buildups in liquidity will be needed in this new post-SVB push-button withdrawal world.
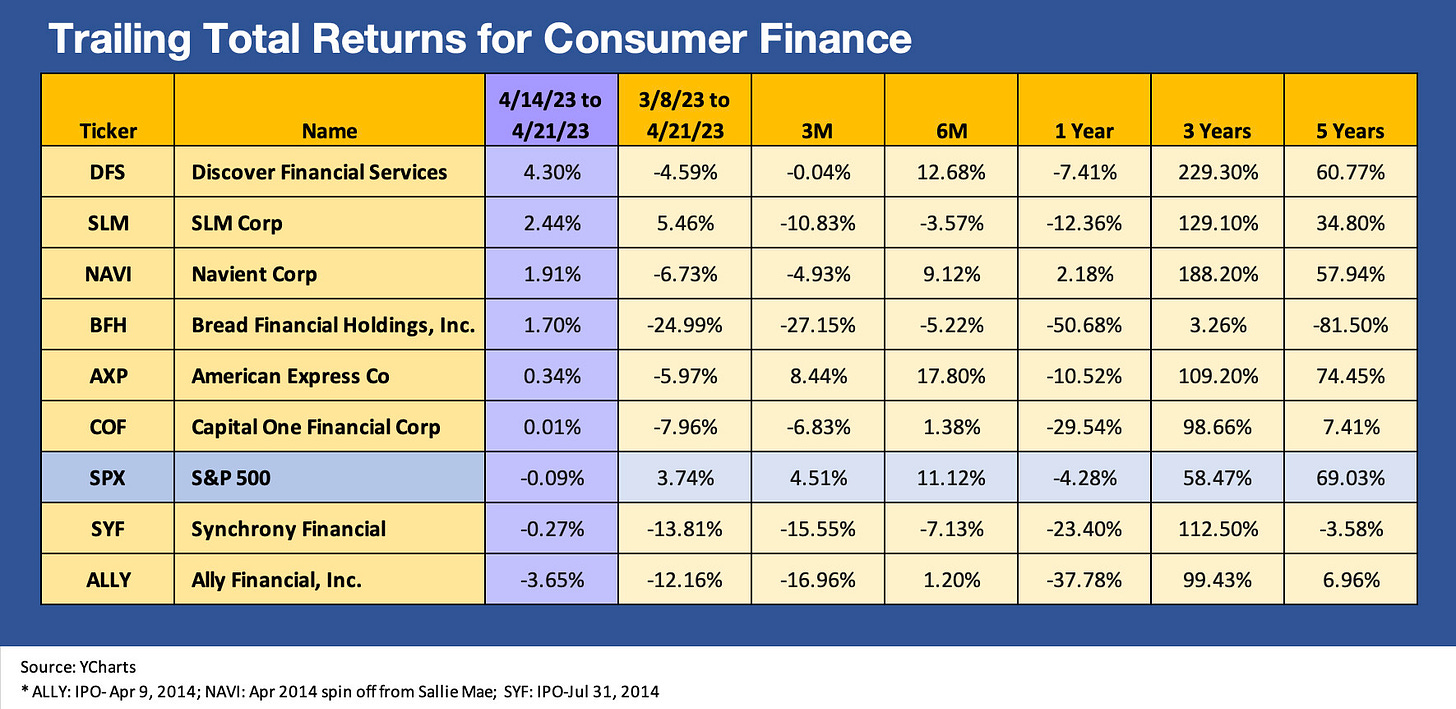
Some of the Consumer Finance operators have common features with the regional banks in their funding pressures and high level of cyclical exposure and consumer credit quality, so we also generated a similar comp table for the consumer peers. We see a lot of negative numbers since the SVB crisis catalyst. This past week we see the market was not all that excited by the macro overviews offered in the earnings reports.
Weaker asset quality expectations and tighter interest margins were common topics for the main lenders. We were curious about what Ally had to say, and their delinquency and charge-off numbers were reasonable with respect to asset quality metrics.
The mix of names on this consumer finance list is generally more swept up in the issue of consumer credit quality and the cyclical direction of asset quality for auto loans, credit cards, and student loans. We thought the equity performance presented an interesting frame of reference for how horrid the regional bank stock return numbers were since SVB.


