Footnotes and Flashbacks: Week Ending April 30, 2023
A big week is ahead with FOMC and employment, but earnings season so far does not offer much ammo for recession scenarios.
“Rock, Paper, Recession?”
This Week’s Macro: Asset class and ETF sector returns; yield curve migration trends; UST curve shifts; 3Y-10Y new peak inversion; 2Y-30Y inversion well below the peak; BB vs. CCC spread differentials; BB vs. B tier spread differentials.
This Weeks’s Micro: We look at Caterpillar’s global context after getting a look at United Rentals more US-centric, bullish guidance.
MACRO
The week ahead will be packed with macro indicators with the FOMC meeting, JOLTS and JOBs, ISMs and PMIs, and releases on construction, factory orders, and consumer credit. There could be more to digest later tonight or in the morning on the fate of First Republic (FRC). The regulators reportedly rang “last call” on the way into the weekend and are trying to strike deals with buyers (JPM and PNC among others cited in news reports). If FRC goes the way of SVB, the failure would rank #2 in history. That will get politicized in a nanosecond, and then the noise level around “let banks fail so they’ll learn” or “mitigate systemic contagion” will start in again. That could set off more jitters.
Ahead of the FOMC meeting, the inflation indicators of the past week did not signal a green light for pausing. We saw the Employment Cost Index showing continued pressures and notably in Services (see Employment Cost Index: Slow Motion 4-28-23). The Core PCE numbers weighed in at 4.6% after running down below a friendlier headline PCE index of 4.2% (down sequentially from 5.1%). The underlying in PCE showed Goods at +1.6% but the Services challenge continues at +5.5%.
The GDP line items also did not show weakness below the headline number of 1.1% with the consumer bringing a pop and fixed assets mixed (see GDP 1Q23: Devils and Details 4-27-23). The PCE line was especially strong at +3.7% change from the preceding period and a +2.48% contribution to GDP. The JOLTS numbers come first this week on Tuesday, and job openings will be a major sentiment shaper after such consistent and solid demand in the consumer sector.
At the micro level, some big earnings reports are teed up across a range of consumer-heavy, cyclical, energy (especially in Midstream), and services names. We are anxious to hear what Ford and Stellantis have to say in autos while cap goods bellwether Cummins and CNH report. We will also now see the other half of the large commercial aircraft duopoly (Airbus). These are the types of names that offer good indicators on supplier chain prospects as well as capex trends. They also tie into many industries along the multiplier effects services chain.
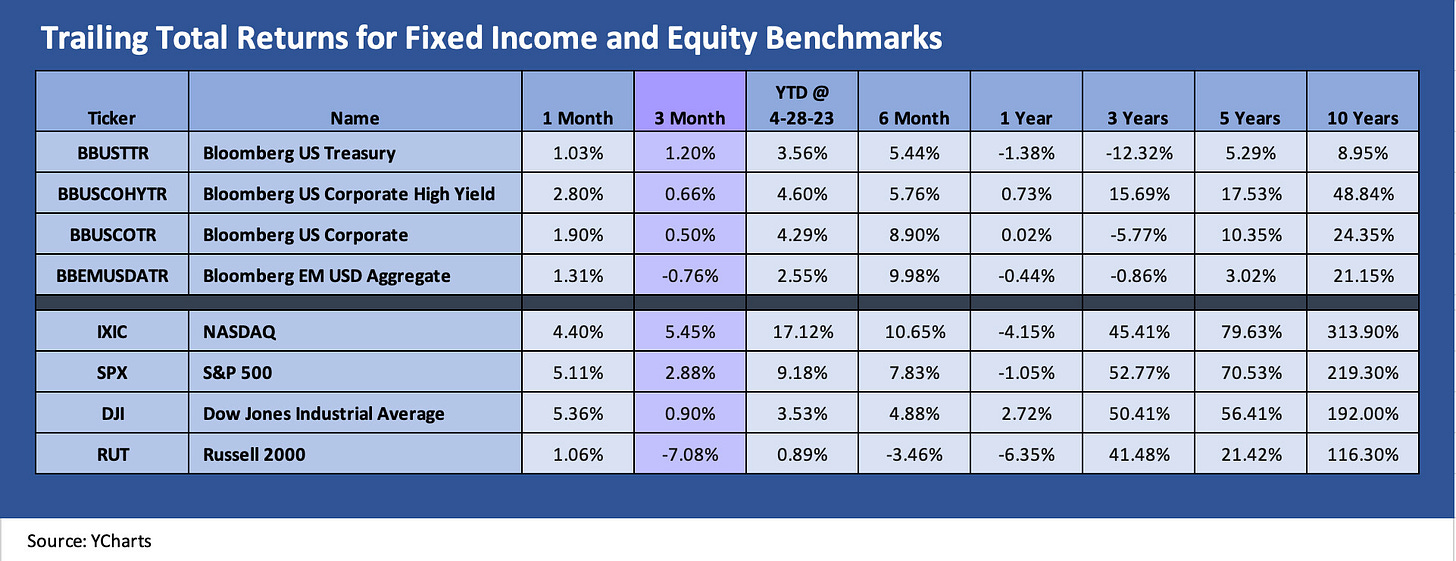
With the UST curve rallying and stocks having a good week and a positive month, we update the main debt and equity broad asset classes we track in the chart above. We line up the debt and equity classes separately in descending order of returns for the trailing 3-month period. High grade and high yield are clustered over 3 months with the ebb and flow of credit risk premiums trading off against positive duration impact. EM is negative. The US HY asset class carried the trailing 1-month period on tightening and UST curve downshifting. That tightening comes after a rough patch in the March depositor panic.
Over in equities, it is the same theme music as recent weeks with the growth stocks and now Big Tech performing well on the high end and small caps overall getting crushed on the low end. A 3-month return of -7.1% on the Russell 2000 is pretty grim.
The above chart updates the “1500 and 3000” benchmarks, and a broadly positive month still cannot reverse the earlier pain over 3 months with 5 of 6 indexes listed negative outside the growth stock rally. Financials are unsurprisingly on the bottom over 3 months despite some solid rallies after the depositor panics settled down and earnings calls brought some dialogue from management teams. We will see what First Republic news plays out for signs of any spillover risks. Real estate is a widely divergent story across real estate subsectors while Energy has felt the weakness in commodity prices and notably in natural gas prices even if oil tends to get the headlines.
ETF returns for 1-month and 3-month horizons…
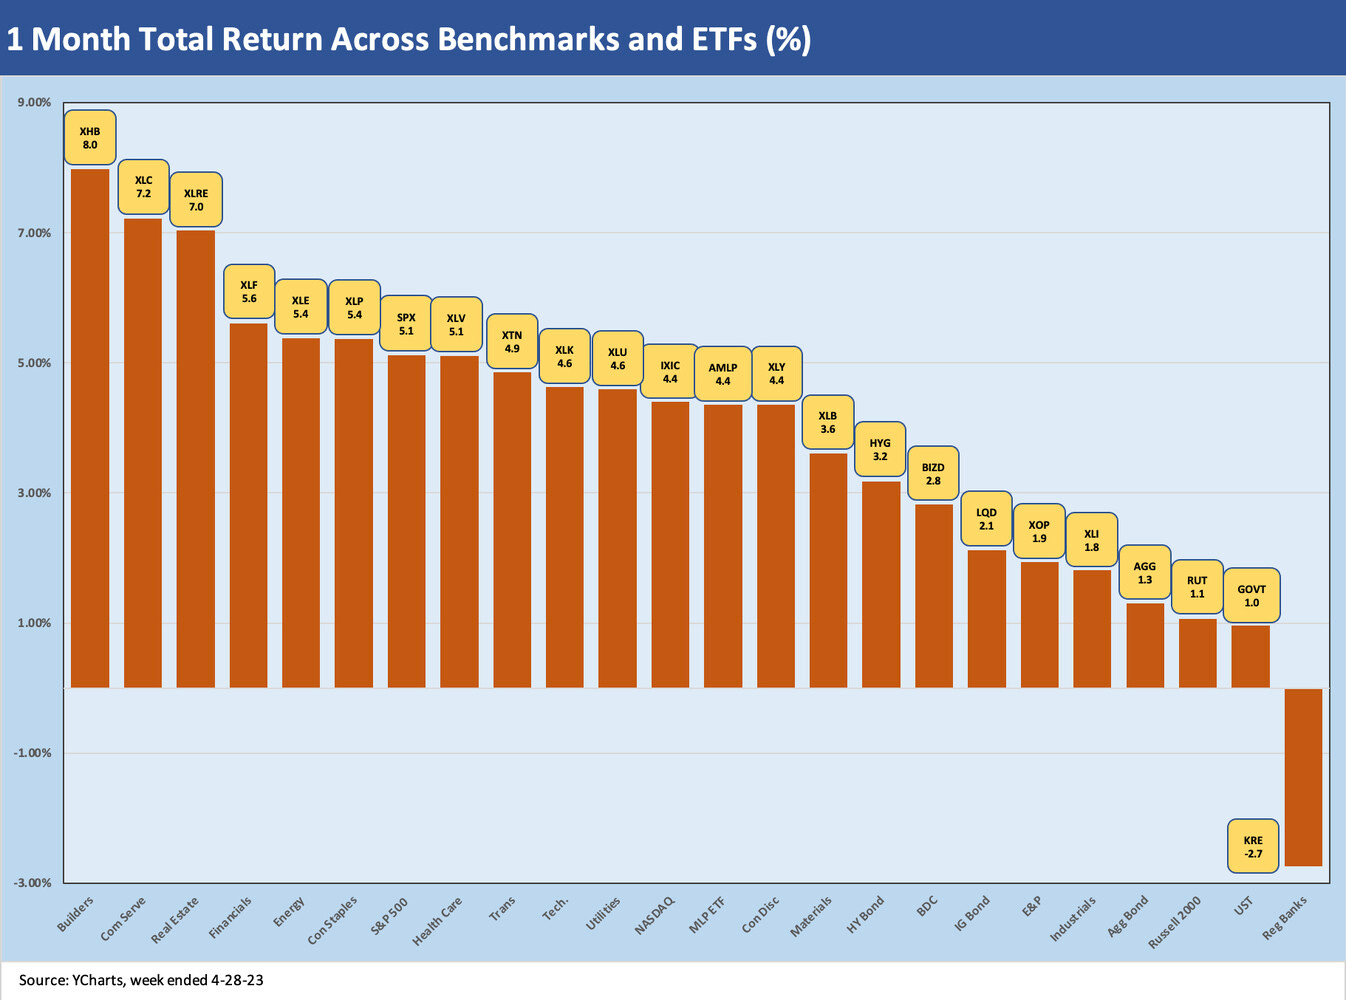
In the following two charts, we look at 24 ETFs and broad market benchmarks. We plot total returns for 1-month and 3-month trailing periods. We then break them out in the bar charts from highest to lowest returns. For the 3-month period, we break out the regional bank ETF (ticker KRE) into a separate box to improve the visual presentation of scale (the 3-month returns on KRE are that bad).
The 1-month ETF and index returns above are all positive with the single exception of KRE (regional banks) at -2.7%. This improving trend for more of the ETF groups has been evident in recent periods after a very rough stretch. We see 23 of 24 positive over 1 month vs. only 13 of 24 over the trailing 3-month period.
Despite the backdrop of weak YoY volumes in homebuilders and the still-onerous erosion of affordability, XHB and the builders (includes suppliers) lead the ETF list at #1. We have been seeing some solid story lines out of the major builders of late and some sequential improvements as we flagged this past week (see New Home Sales: Feels Like a Light Tailwind 4-25-23, Signals and Soundbites: PulteGroup 1Q23 4-25-23). The consumer driven sectors and NASDAQ are in the upper tier of the ETF returns. Fixed income took a back seat generally this past month.
The rebound of Financials and Real Estate this month comes with the asterisk that both are still in the Bottom 5 over the trailing 3-month period. The links between the Regional Banks and the Commercial Real Estate fears have been in evidence for a while. The idea is that defensive lending by the regionals and smaller/midcap banks will take some real estate credits into crunch time and more defaults. That in turn will feed the cycle of losses and asset valuation declines.
The 3-month ETF and benchmark rankings cover the much noisier period of March as regional bank hell took over. The 3-month period shows the setbacks in upstream Energy and the full impact of the small cap quality worries over how a regional and small bank credit contraction could filter through the system. The winners over 3 months are major consumer sectors, tech, and builders.
Fixed income ETFs show quality and duration winning with GOVT, but LQD and US HY are a toss-up and nosed out by AGG. The BDC sector with its floating rate leveraged loan play have been fading after a good start. The small cap link to the typical BDC borrower is one theory on price setbacks in that sector, but the high cash dividend payouts and potential for an extended credit cycle keep many investors in the game on BDC equity exposure.
Yield curve migration…
The above chart updates the UST curve migration since March 2022 when ZIRP ended and inflation fears and Fed tightening kicked into gear. We plot the steady upward migration along the UST curve and use the 3-8-23 UST curve (the day before the SVB meltdown accelerated into the bank being closed on 3-10-23) as a guidepost for where the short end peaked before the UST curve rapidly downshifted into new inversion highs when framed vs. 3M UST.
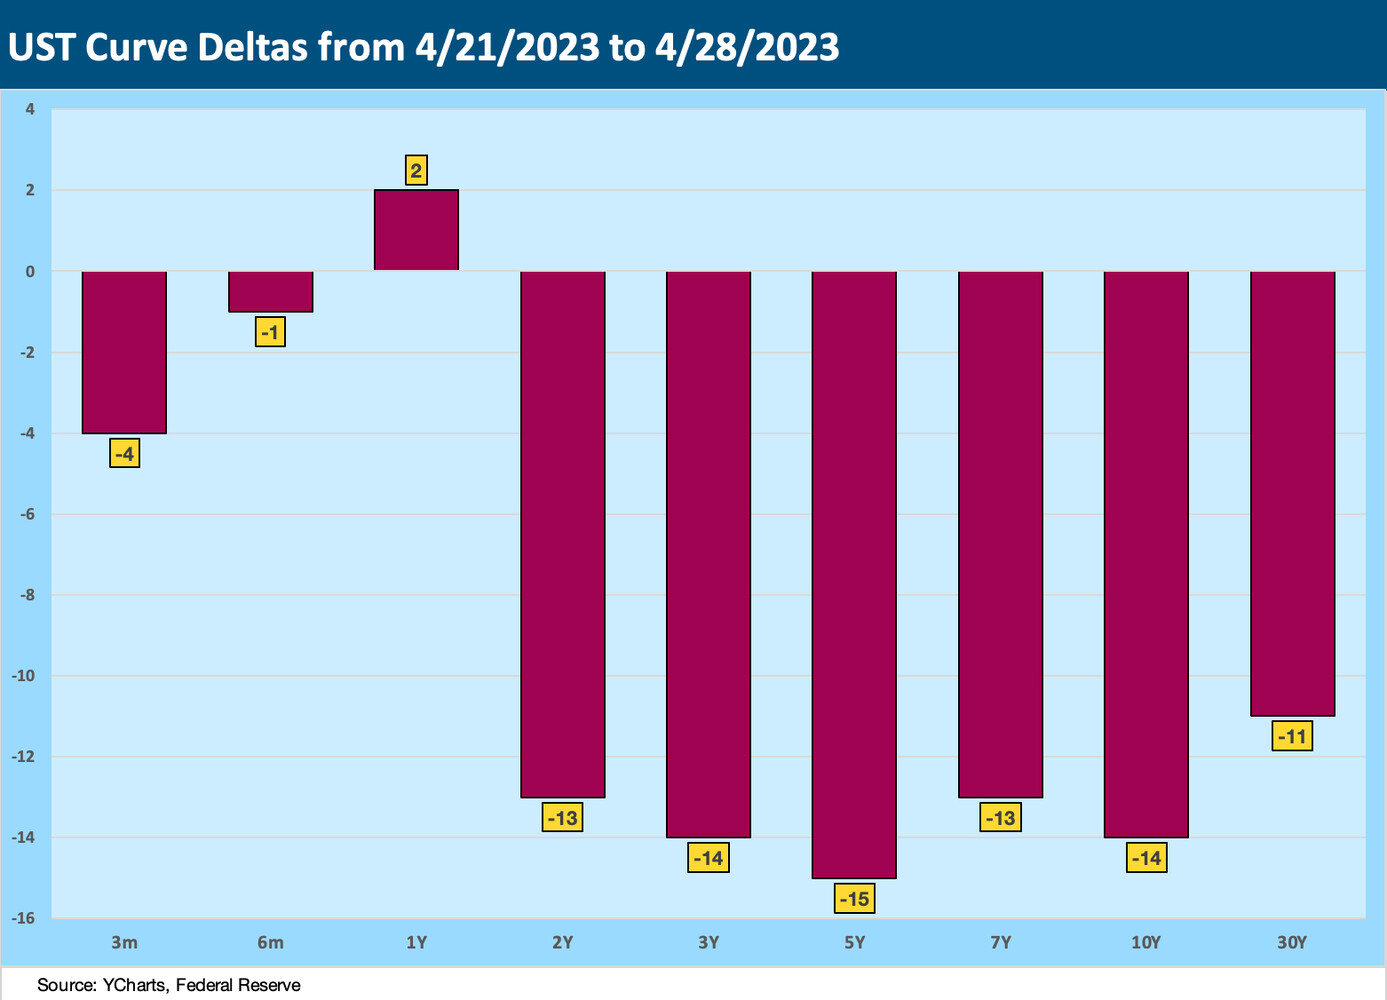
If we compare the 4-28-23 UST curve above to our prior weeklies (4-21-23), we see the inversions still at work with the 5Y to 30Y heading south, the 3M UST staying high on Fed policy, and the 1Y and 2Y somewhat erratic as the financial media has been covering.
Regardless of how the 2Y serves as a proxy for rate views, the inversion theme remains the discussion point for recession forecasts. More than a year of UST migration north makes for a materially higher refinancing cost structure for the leveraged borrowers and a higher cost of capital for investment generally. Such UST curve moves also shift the M&A pricing dynamics and of course are a headwind for housing and residential sectors.
The above chart updates the UST curve deltas for the past week, and the inversion patterns vs. short UST are still in motion. The 1Y and 2Y UST range still serves as the Fed policy debating point. We should get some answers this week. The earnings season certainly is not screaming recession yet. The bears now have the Congressional (House) debt ceiling game plan on their side, but the fundamentals and guidance this earnings season have not been signaling economic downturn.
Such economic transition periods are mixed, and they usually turn into stock valuation debates on weaker growth rates. That growth debate and slowing of revenues and earnings has been more the color for some major reporting companies as opposed to economic contraction themes.
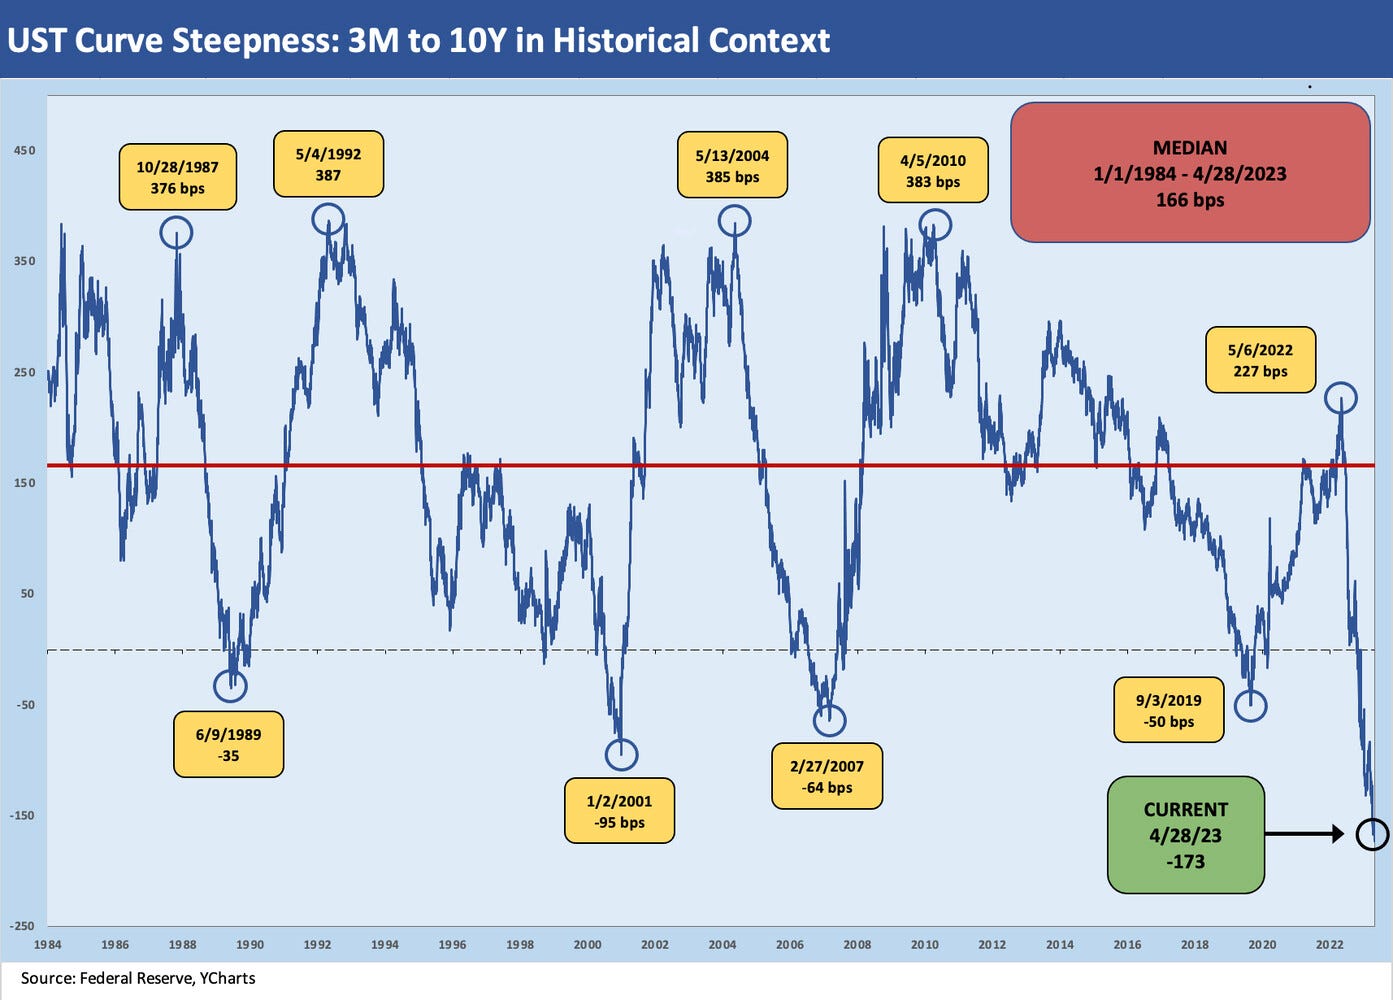
The above chart revisits the 3M-10Y UST curve inversion. This curve segment just hit a new inversion high. It is why more than a few investors see cash as a near-term time horizon asset allocation decision that is very workable. We have not seen anything like this since the early Volcker years.
The above chart updates the 2Y-30Y slope. The inversion has been dramatically reduced from -117 bps (3-8-23) to -37 bps since the pre-SVB market with the broad downshift of the intermediate and long UST curve (see Silicon Valley Bank: How did the UST Curve React? 3-11-23).
Credit quality spread differentials…
The above chart updates our “Hi-Lo spread differentials” for US HY where we frame CCC OAS vs. BB tier OAS. The long term differential median is +637 bps, and we have been above that level for some time now as detailed in earlier commentaries (see US HY Spread Histories: Weird Science, New Parts 3-19-23, BB vs. CCC Spreads: Choose Wisely 1-8-23). The BB to CCC incremental spread went above the median around May 2022 and has been bouncing around since then out to the current level of +793 bps.
The expectation of a sharp increase in defaults during 2023 (predicted by numerous sources in the headlines) will still leave default rates below the long-term average. Our expectation is that this BB vs. CCC quality spread relationship will continue to erode over the course of the year.
The history of the relationship is filled with stories of what has generally been a lower quality overall HY index in past cycles and higher quality today. The chart details the “wides and tights” on this quality spread relationship, and the symmetry tends to be unattractive and especially so in later stages of the cycle. The word “cycle” tends to take on multiple meanings in US HY given the realities of the “credit cycle” turning before the economic cycle. The “underwriting cycle” as a concept took on a life of its own (not a good life) in the late 1990s TMT years.
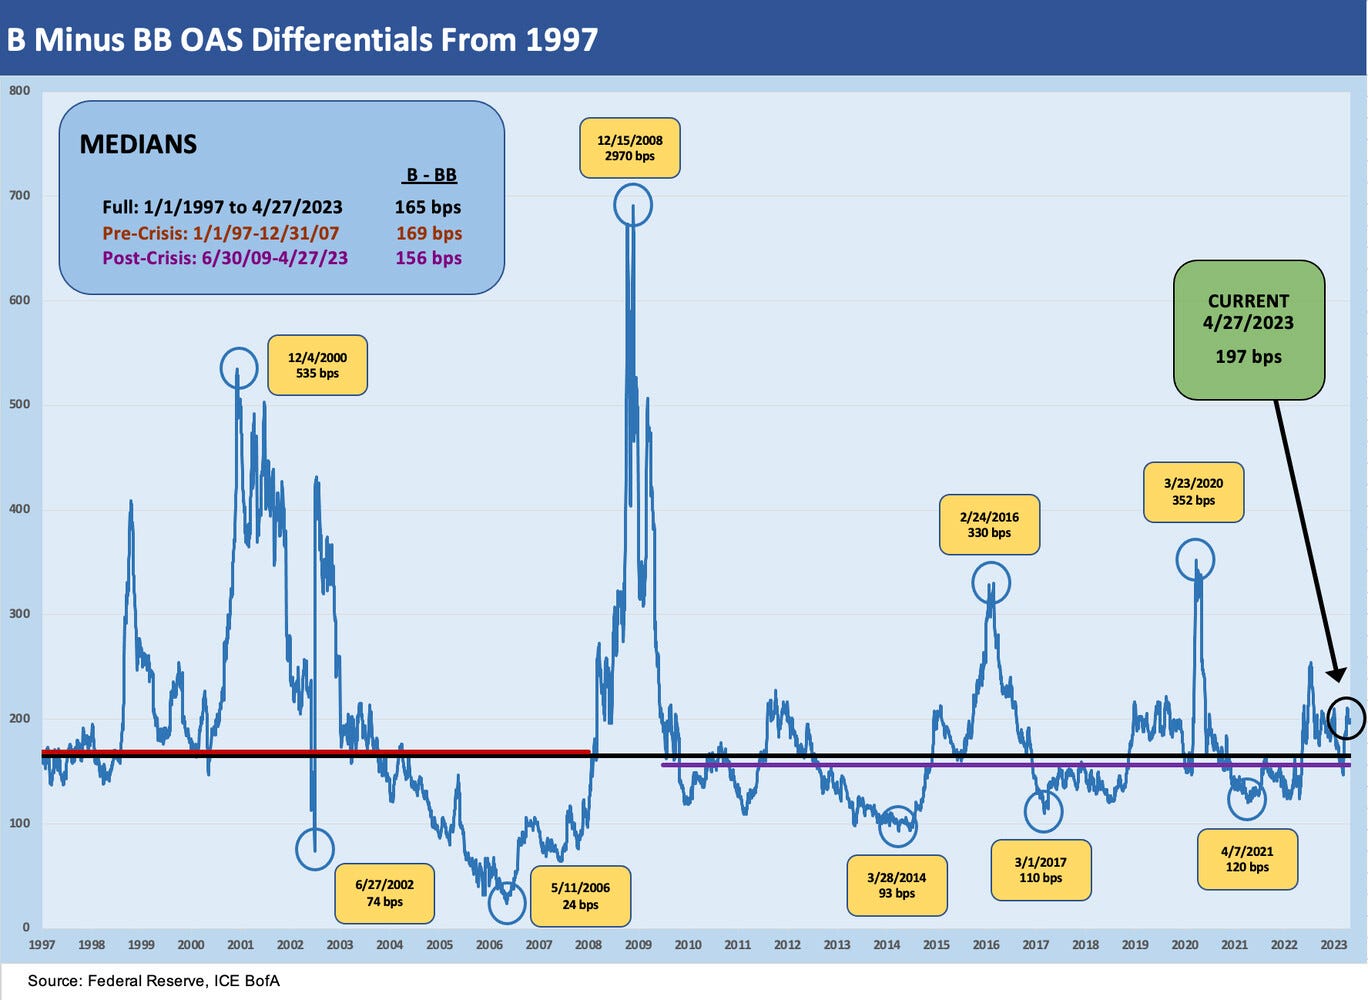
The above chart frames the incremental spread for moving from the BB tier to the single B tier. The current “B-BB” OAS differential of +197 bps (4-27-23 pricing) is above the long-term median of +165 bps. We saw spread waves in June-July 2022 and a brief period in Sept-Oct that pushed the OAS gap to above 200 bps handles, but the relationship has generally held in well across the timeline since the end of ZIRP. That level is easier to justify looking backward on trailing fundamentals than looking ahead at a wider checklist of scenarios that could unfold. We are still voting with that relationship being wider in 2H23.
MICRO
United Rentals and Caterpillar for some color on capex intensive markets...
We are seeing earnings reports from some of the companies whose revenue lines and guidance offer some critical directional indicators on capex plans on the domestic as well as the global front. We have always been a fan of United Rentals for its very wide-angle view on the US-centric construction and industrial equipment demands, and the color from URI on its earnings call this past week was quite optimistic with very granular guidance offered for the full year.
As we covered in our note on United Rentals (see Signals & Soundbites: United Rentals 1Q23 4-29-23), an array of industry verticals are displaying solid fundamentals that are driving double-digit increases in Revenue and EBITDA for the #1 Equipment Rental operator in North America. That sort of top line and EBITDA growth is very supportive of credit quality, but the stock angles are somewhat distinct.
The doubts in the market on the ability of capital goods and machinery and equipment players to drive sustained growth is under a cyclical cloud at this point, and that can affect any combination of forecasts into 2024 and what multiple to assign such stocks. The range of customers (small, medium, and large) in the US-centric revenues for URI is different from what we see in Caterpillar (or at CNHI) with their global footprints and their exposure to the Full Monty of geopolitical uncertainty in Asia and Europe.
Despite good numbers, the forward-looking doubt is evident in the recent stock action in the Machinery and Equipment sector as well as some of the equipment rentals as noted below. The stock chart frames three major machinery and equipment companies and four major equipment rental operators. CAT has the most overlap of end markets of the manufacturers with the two major rental players (URI and Ashtead) and serves a long checklist of verticals and narrow industry groups from construction to industrial and energy and mining.
The stock return action is not giving the benefit of the doubt at this point by any means as the recent returns show. We line them up in descending order of rolling 3-month returns. We like to watch URI as a useful indicator of equipment needs in the US. The story with CAT is more about “What is going on in the World”?” whether in infrastructure spending or investment in such capex heavy sectors as Energy, Mining, and Manufacturing.
Caterpillar and peak cycle syndrome…
The results for CAT retail sales across Machinery, Resources, Construction, and Energy & Transportation were all positive in 1Q23 with only Construction posting a single digit increase and the rest in double digits. Individual sectors can break down into a wide range of industries from oil and gas to power generation and engines. Leafing through any major CAT investor presentation highlights the dizzying array of equipment types.
CAT’s 1Q23 numbers were well ahead of expectations with margins up materially YoY and pricing power very much in evidence. Revenues were up double digits YoY in 1Q23 across Construction Industries (+10% to $6.7 bn), Energy & Transportation (+24% to $6.25 bn) and Resource Industries (+21% to $3.4 bn). We cite the numbers and magnitude of the growth despite supplier chain headaches to underscore that CAT’s shabby stock returns in 2023 are tied into the expectation that this is the peak of the cycle.
Whether it is the peak in the North American region vs. EMEA, APAC, and LATAM is a different question, but the tone on US prospects was upbeat. That mirrors what we heard with URI. A disproportionate increase in earnings for Machinery, Equipment, and Transportation business lines was evident in the +52% increase in segment profits ex-Financial Products. We thus read some of the stock beatdown as tied to the worries about “peak risk” (a justifiable concern with those great 1Q23 numbers) and not economic contraction risk.
The equity market reactions detailed in the above stock return chart underscore some jitters around sustained demand growth and pricing power in some business lines. In CAT’s case, much of the improvement in 2023 was from price rather than volume, but the price action was part of slowly catching up with cost increases experienced in 2021 and early 2022. The low probability of sustained pricing power of the magnitude seen looking back is one for the equity players to get anxious over. From the standpoint of a sustained high rate of economic activity, that seems clear enough in the management comments.
The view on CAT consolidated in a global context is different from trying to frame the narrower read on the US economy. For the US/North American side of the ledger, there are some helpful tailwinds. We see longer term projects in a combination of infrastructure spending and new initiatives in connection with IRA projects bringing multiyear spending plans. The Energy Transition demand gets a lot of play in some CAT presentations.
In the results of the CAT Financial unit, we did not see anything signaling customer stress yet. Past dues were down slightly YoY to 2.0%, write-offs were low at $10 mn vs. $8 mn set against an allowance for losses of $348 mn or 1.27% of receivables vs. 1.29% at the 4Q22 quarter end. That does not signal signs of financial problems among financed buyers at this point.


