Footnotes and Flashbacks: Week Ending June 4, 2023
The debt ceiling post-mortem leaves some squawking while still congratulating themselves. All is well.
"The new Speaker wants Congress to be neighborly."
This Week’s Macro: Debt ceiling and “peace with honor”; asset returns; yield curve migration and UST deltas; 3M-10Y yield curve slope; IG vs. BBB OAS and BB vs. B tier OAS.
This Weeks’s Micro: Equitrans and MVP’s not-so-excellent adventure seems to be over (in a good way) with the debt ceiling resolution.
MACRO
Disaster was averted as the Fiscal Responsibility Act avoided radical changes and ducked the risk of a cascading set of market reactions that could (would!) have set off way too many dominos in the real economy via private sector retrenchment, job losses, lender credit contraction, scrapped capex and expansion plans, and market risk aversion effects infecting the consumer sector. The geopolitical ramifications (including national security) were mostly ignored by the hard liners as they retreated to a mix of ignorance or indifference in the areas of global risks while chanting America First to make it sound noble.
The fact that the UST had another near miss on default will make some forget that a more extreme leadership team in the White House or in Congress would have gotten us all there. If the center right and center left don’t start taking more principled stands on issues the political risk factors will someday turn this into something more dire.
The House used to be the gathering spot for the less disciplined, the more extreme, and in many cases the concept-free and fact-lite. Too many B-team (grade inflation) trial lawyers sign up to operate like advocates rather than leaders and thus can rationalize just about anything. Those smooth enough or with the right extremist power brokers behind them can get there and do damage. Once they feel the fund-raising benefits, they can’t put the pipe down. Crazy times.
One important factor remains the same…
As we covered in our systemic debt commentary this past week (see US Debt % GDP: Raiders of the Lost Treasury 5-29-23), the UST burden % GDP that has spiraled higher since 2000 is only going higher from here. As we discussed in that piece, just three Presidential terms (Bush term II, Obama term I, and Trump’s only term) accounted for 62 points of the 72-point rise in Debt % GDP since 2000. That is bipartisan glove in hand at its worst. The only President to post a decline since 1980 was Clinton. Before that, so did Carter. Those facts are no fun for either team, so they do not get much airtime. We reproduce the chart below just to highlight no party gets bragging rights.
The fact that the post-2000 era saw Greenspan easing like Santa Clause (including 1% fed funds by early 2004 three years into the recovery) despite a very mild economic downturn (see Greenspan’s Last Hurrah: His Wild Finish Before the Crisis 10-30-22) was part of a steady upward migration of the systemic public sector debt burden. Debt % GDP went off the rails with two wars, a bank systemic crisis, and a pandemic. ZIRP also fed the bad habit since the expense line was more user friendly than they are now and will be in future refi waves.
The corporate systemic debt stayed under better control (see US Corporate Debt % GDP: It’s All in the Mix 5-31-23) despite the same interest expense mirage that made it easier to borrow with interest coverages soaring even when leverage rose. That is the difference between shareholders and those buying love with tax cuts and spending plans. There is usually (not always) a restraining influence at some point with shareholders as multiples get penalized for high financial risk.
Political chess? Checkers? War games? Drinking games?
The wild finish to the debt ceiling process left everyone unhappy for a range of reasons but still mostly impressed by themselves. In the end, Washington used the crisis to be functional for a change and get some small victories while the main one (soaring debt burden and spiking interest expense) remained the same. Biden protected his big wins and thus came out looking good. McCarthy located his missing body parts, and he outflanked the crazies. There was something in the “Fiscal Responsibility” bill for most to grab onto in what could have gone south and caused the exact crisis some were seeking (those with assured reelection prospects).
The extremists just felt the rule of “everyone has a plan until they get punched in the face” (attributed to Mike Tyson) after attacking their own party members with the rule of “you can run, but you can’t hide” (Joe Louis). Now all they can do is bring more noise (which they will). The hard right for now is out of mass destruction alternatives until Jan 2025 when the GOP majority could be much bigger or in the minority. That election could bring all-new math that dilutes the power intrinsic in the handful of voters who seemed to be controlling legislation.
A big question is whether the GOP 2024 election period brings more “base-hunters” or more traditional economic planners with some awareness of global economic facts and less isolationist fantasies. Trade risk runs very high, and geopolitics has infected supplier chain risks.
Meanwhile, the left is rooting for the extreme right to damage their party by using their ability to toss the Speaker in a new vote. The post-deal color was that McCarthy is either grossly underestimated or knows how to blow with the wind. Meanwhile, the far left was stuck with “you’ll take it and like it.” The polar extreme crowds (left and right) are unhappy, and the political primary seasons will be revealing on which candidates have to pick a team (hard right vs. unyielding Progressive) whether at the top of the ticket or in the House and Senate contests. At least the “UST default risk” part of the daily news flow can now get off CNBC and political junkies can return to their respective echo chambers. Congress cannot blow up the market for a while.
Sending the economy into a downward spiral never war-gamed out to a winning election strategy, and McCarthy knew that. A policy of nuking record payroll numbers did not make sense with the recent rising employment ranks (see May Employment: Payroll Records Continue 6-2-23) and thus tanking tax receipts with it when deficits are the supposed focus. Plan A is usually not to force mass unemployment and to avoid going down a path that assures election losses in the House and in a key Senate election that has so many Democratic seats on the line. In the end, the “blow it up gang” was sidelined.
Meanwhile, the far left had little choice but to avert disaster and wave some flags to highlight their objection. There were some weak 11th hour symbolic gestures (Senate amendment to remove the pipeline support…see MICRO section below). The progressive wing and the climate-focused subset will feel cheated as will the purists on work rules, but that is a worry for turnout next fall. The 2020 election had the highest turnout rate in the US since women had the right to vote, and both parties need that again. Even if some of the election deniers are not big on long division and basic math, turnout will matter. That is next year’s debate to see who can scare more people off the couch in the right states.
The biggest surprise from the cheap seats was that Speaker Kevin McCarthy and his team stood up to the “let’s default” extremists and managed to materially enhance his reputation with independents in the process. Some of the wackier players on the extreme right made the expected noise, but there were very few “vacate the chair” threats (so far) that we took note of while surfing the political press. Some of the more notorious characters who tend to focus more on their ammo counts than vote counts (most are bullet proof on reelection) were muted in their criticism. They no longer have a systemic target so there is not much more they can do.
Default threats in 2025 would be low if the GOP retakes the White House (the GOP would not use a default threat with a GOP White House) or the Dems hold the House. The Dems might do a government shutdown on a budget but not a default on a GOP White House. The last three default threats were with a GOP House and Dem White House. The Senate tends to fight on many things, but they are more housebroken than the House (a lot of newspapers put on the floor across the last half dozen House Congressional sessions).
Comparative Asset Returns…
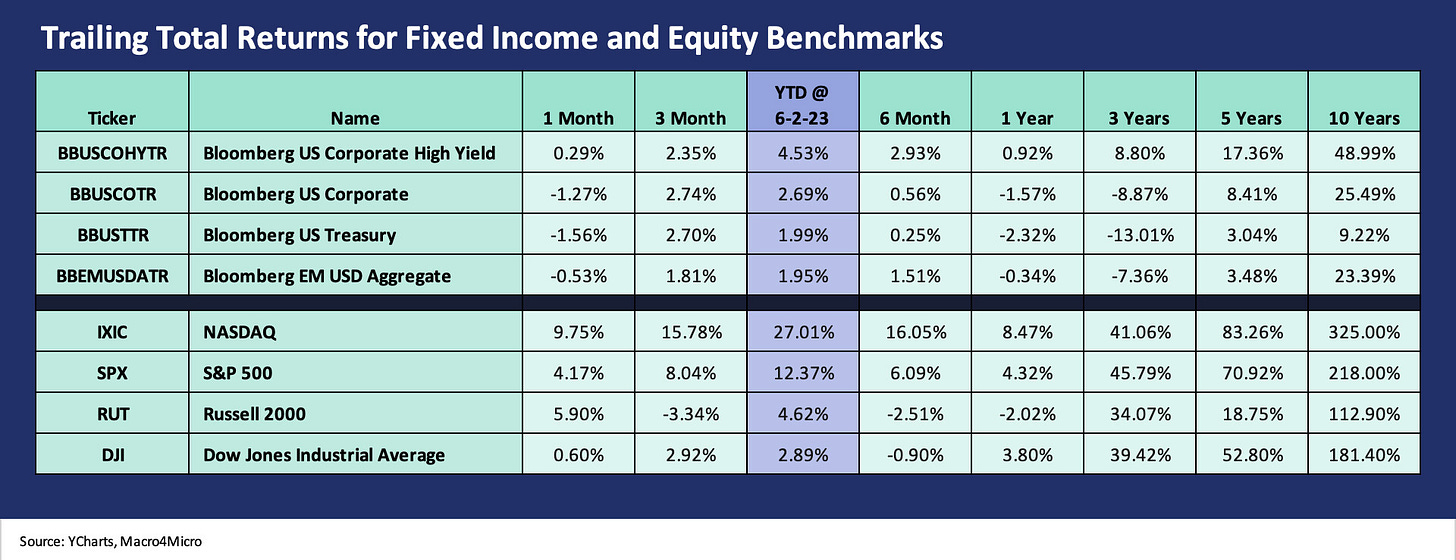
The above chart tracks our usual mix of debt and equity class benchmarks with the sectors lined up in descending order of YTD total returns. Last week was a shutout for the trailing 1-month returns in debt with all four categories negative, but this week managed to push US HY into the positive range with solid spread tightening on the week and the UST curve helping on the total return side (we look at curve deltas below).
On a YTD basis, US HY is in the lead as spreads continue to hang around the median level of where they have been since early Dec 2022. HY OAS is in the neighborhood of the multicycle median as well (see FOOTNOTES AND FLASHBACKS: Week Ending May 21, 2023). HY still holds the coupon income advantage even if those coupons are ancient history in the newly repriced world after the UST migration since March 2022. IG total returns are holding in well YTD also on the yield curve rally since the SVB collapse and regional banks chaos.
We update the 1500 and 3000 series above to reflect the longer tail of names from large caps to small caps. We now line up these benchmarks in descending order of YTD total return. Growth pulling away from the pack is not a new theme.
We keep seeing charts and headlines on the domination of the “Magnificent 7 stocks” and Top 10 and the Top 5 (as distinct from the “S&P 495”). Lack of breadth has been the streaming theme across articles and social media with some very slick charts attached. That narrow domination of a handful of stocks still gets back to the question of what you should be owning in a diversified portfolio that seeks to keep company-level weightings around 2% and highly correlated subsectors and industries in some reasonable balance. In the absence of a UST default, at least the correlation will not be racing towards 1.0.
The 1500 and 3000 chart above shows 3 of 6 of the asset lines items that we watch in positive territory YTD and 3 are negative. The Russell 3000 Growth benchmark is in a different zip code at around 23% vs. #2 S&P 1500 Industrials at +4.7%. Financials and Energy remain in a hole with real estate only slightly negative YTD.
Cyclical questions loom in equities…
The cyclical direction is anything but clear near term and the same for the policy decisions of the Fed given the uncertain impacts of what so much tightening will mean. The consumer is heading into the summer season that often serves as the seasonal peak for travel and housing, and both have held in well sequentially. For now, it is hard to call a recession with jobs at all-time highs (see May Employment: Payroll Records Continue 6-2-23) and the PCE line of GDP hanging in (see Personal Income and PCE: Inflation Stickier 5-26-23, GDP 1Q23: Devils and Details 4-27-23).
The global cycle, the US cycle, the China cycle, and the developed markets cycle are all over the map on predictions. As we go to print today, OPEC is again on the screen with the Saudis talking about voluntary cuts and continued supply tightening. The OPEC+ dialogue was reportedly contentious with Saudis doing their own voluntary cuts while others would roll over their quotas. The concerns around global oil demand are always tricky. The wide swings in oil over time somewhat disqualify it as a good predictor of recessions when cartels and speculative flows in oil markets can be a major influence. That said, demand worries lurk on possible China demand weakness and OPEC+ supply cheating.
ETF Returns and index benchmarks….
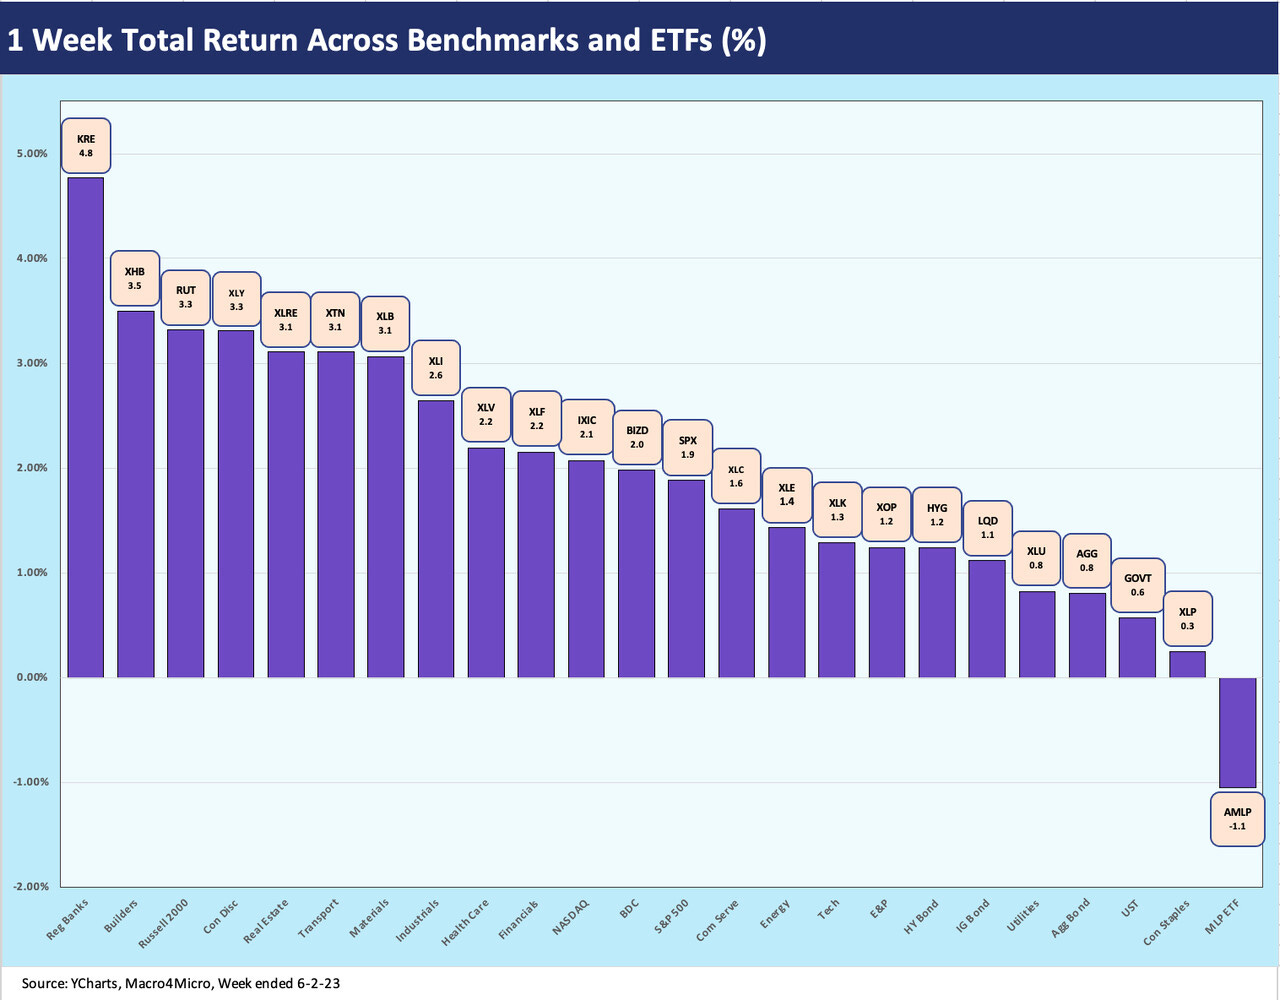
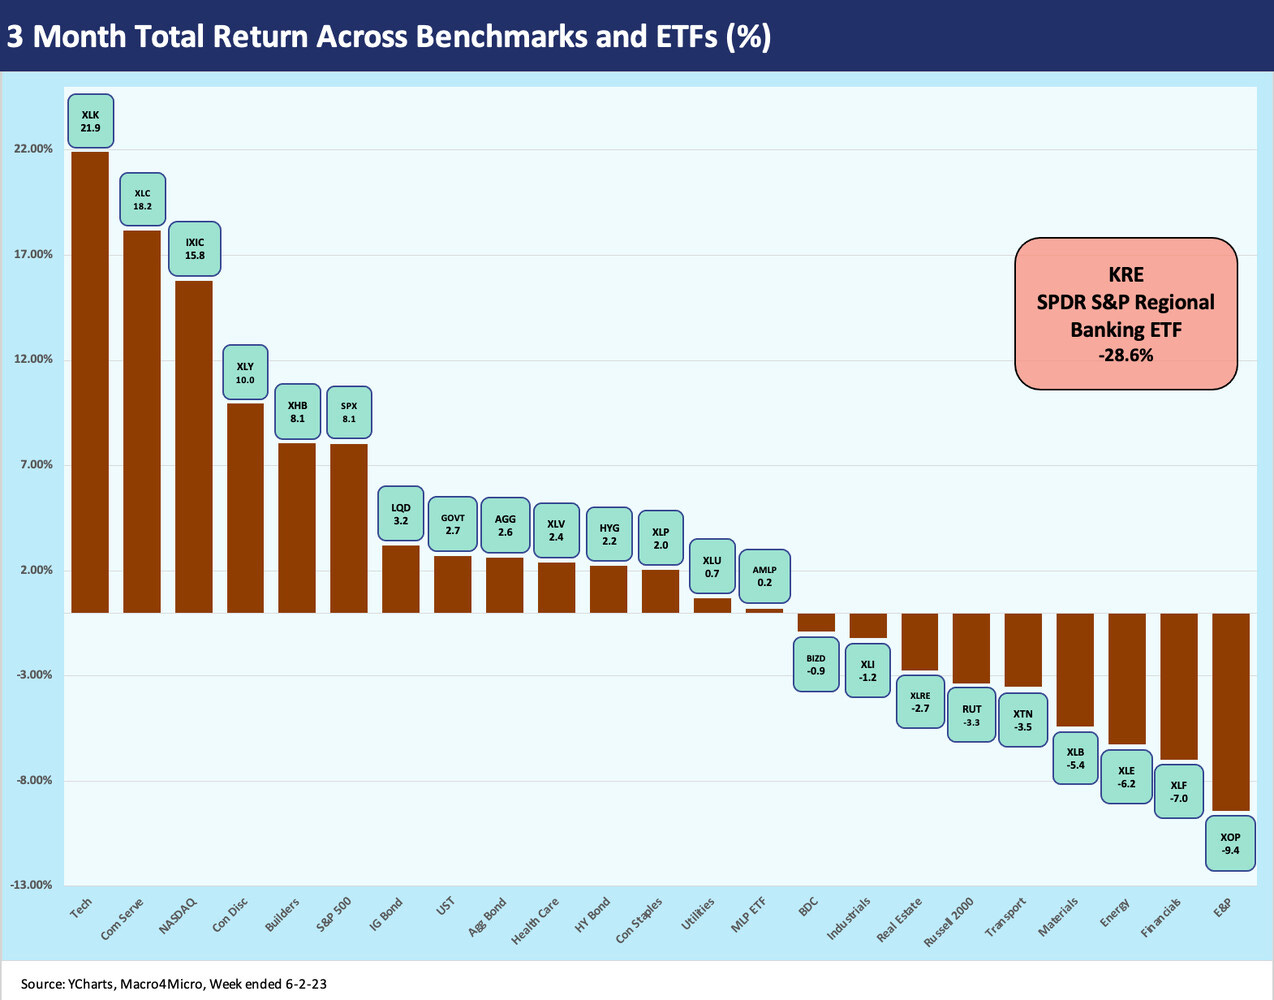
Below we look at total returns over the trailing 1-week, 1-month, and 3-month periods for 24 categories of industries, asset class proxies, and broader market benchmarks. The mix covers a wide range of industries and fixed income assets and offers some perspective on the rolling time horizons. The Hi-Lo difference over such short time frames offers a reminder that selectivity by issuer and industry can pay off. The flip side is that such Hi-Lo dispersion can be painful also.
1-Week ETF returns…
The 1-week ETF returns mirror the good news in equities as capped off with a big Friday rally with 23 of 24 of the categories in a positive range for the week. Only the high dividend paying AMLP ETF lagged into the slightly negative zone. The regional bank ETF (KRE), Builders (XHB), and Russell 2000 (RUT) lead the way with the KRE and RUT rebounding in the standings the past month.
1-month ETF returns…
The 1-month ETF returns show a broader rebound with 16 positive and 8 negative, up from 11 positive and 13 negative as of last week. Tech (XLK) and NASDAQ (IXIC) have been regular members of the upper tier this year while Regional Banks (KRE) have been making a ratcheting recovery in performance since the market adjusted to the SVB and regional bank deposit terrors. We highlight small caps at #6 for the trailing month as that is one benchmark that would make believers of sustained market confidence if that recovery holds up.
The dull ETFs on the bottom include Staples (XLP), Utilities (XLU) and Health Care (XLV). As an aside, XLV is led in ETF share by UnitedHealth and Johnson & Johnson with a range of “Big Pharma” right behind those. We see the high quality fixed income ETF at or around the upper end of the bottom quartile and HYG modestly ahead. Spreads generally have been tame until a good rally in US HY this week, but equities move faster and cover more distance in a market where UST is undecided and credit markets unfazed on the cycle.
3-month ETF returns
The 3-month ETF and benchmark returns were at 14 positive and 10 negative this past week, up from 12-12 the prior week. We see KRE still in the penalty box at -28.6% total return, down from -34.1% the prior week for the rolling 3 months.
We see most of the same Top 5 as the prior week except Builders (XHB) bumped the S&P 500 from last week to get into the Top 5. Tech (XLK) ranks at #1 and Communications Services (XLC) at #2 with NASDAQ at #3. XLK is heavy on MSFT, Apple, and NVIDIA while XLC is concentrated in Meta, Alphabet, and Netflix. The Consumer Discretionary ETF at #4 is wagged by Amazon and Tesla. The builder ETF (XHB) was likely not one on many lists to start the year as a solid outperformer.
Yield curve migration…
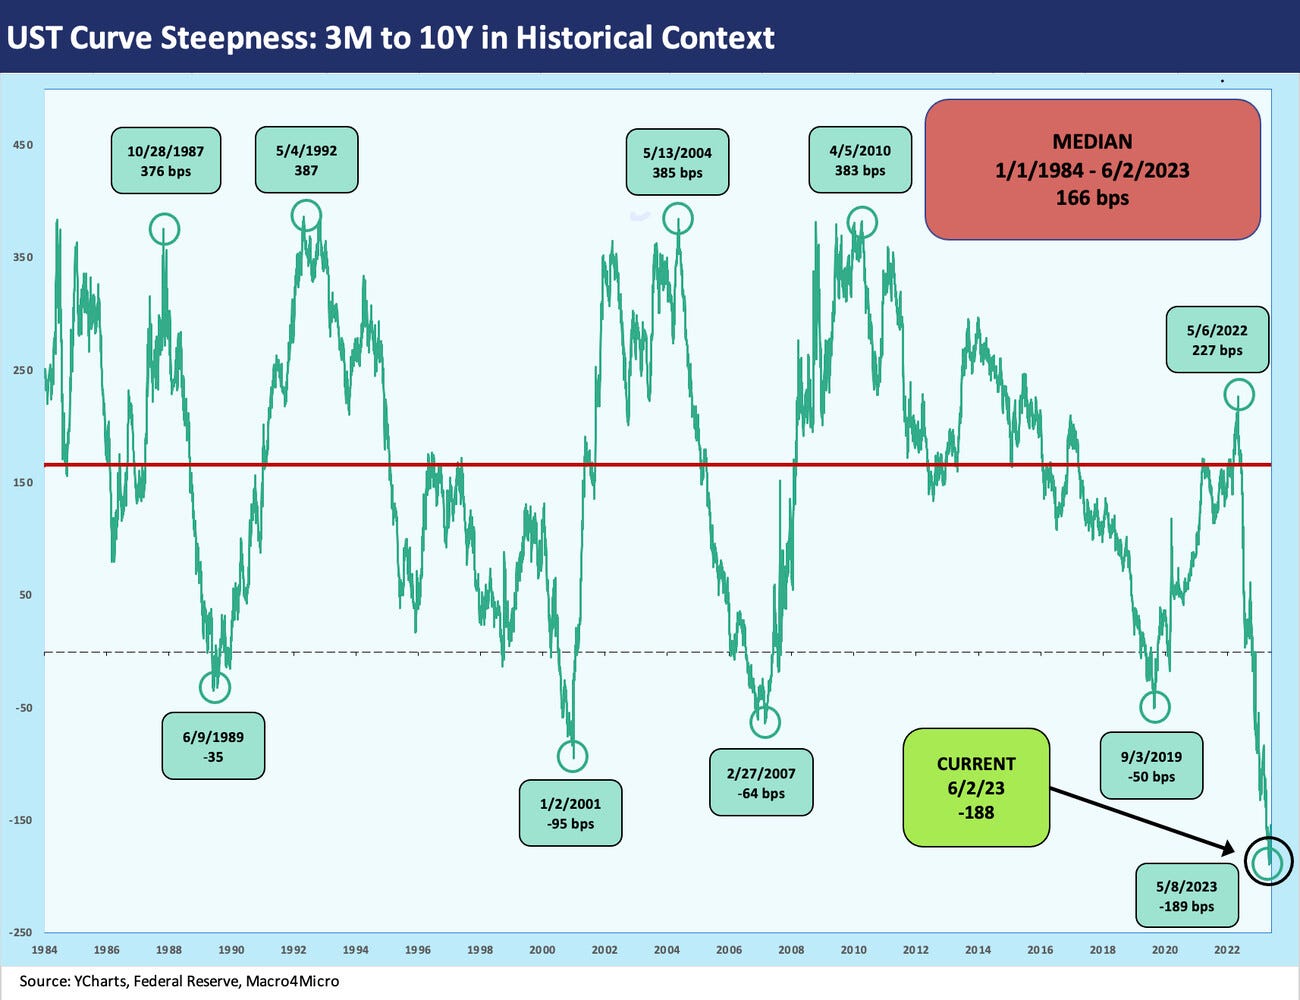
The above chart updates the UST deltas for the week, and we see another bout of inversion from short UST out the curve. As we detail further below, the 3M to 10Y UST is at -188 bps.
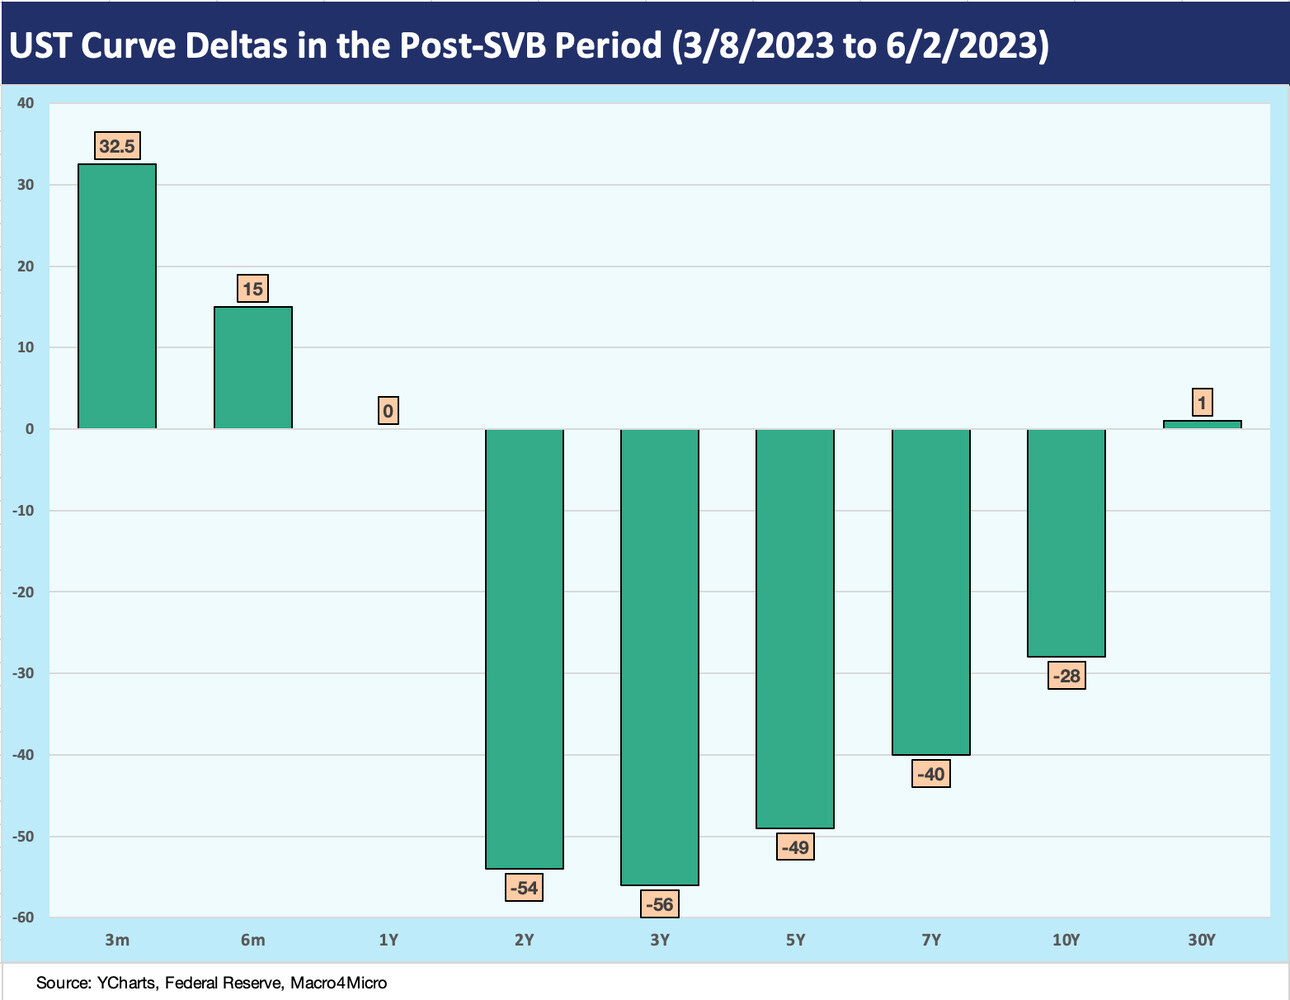
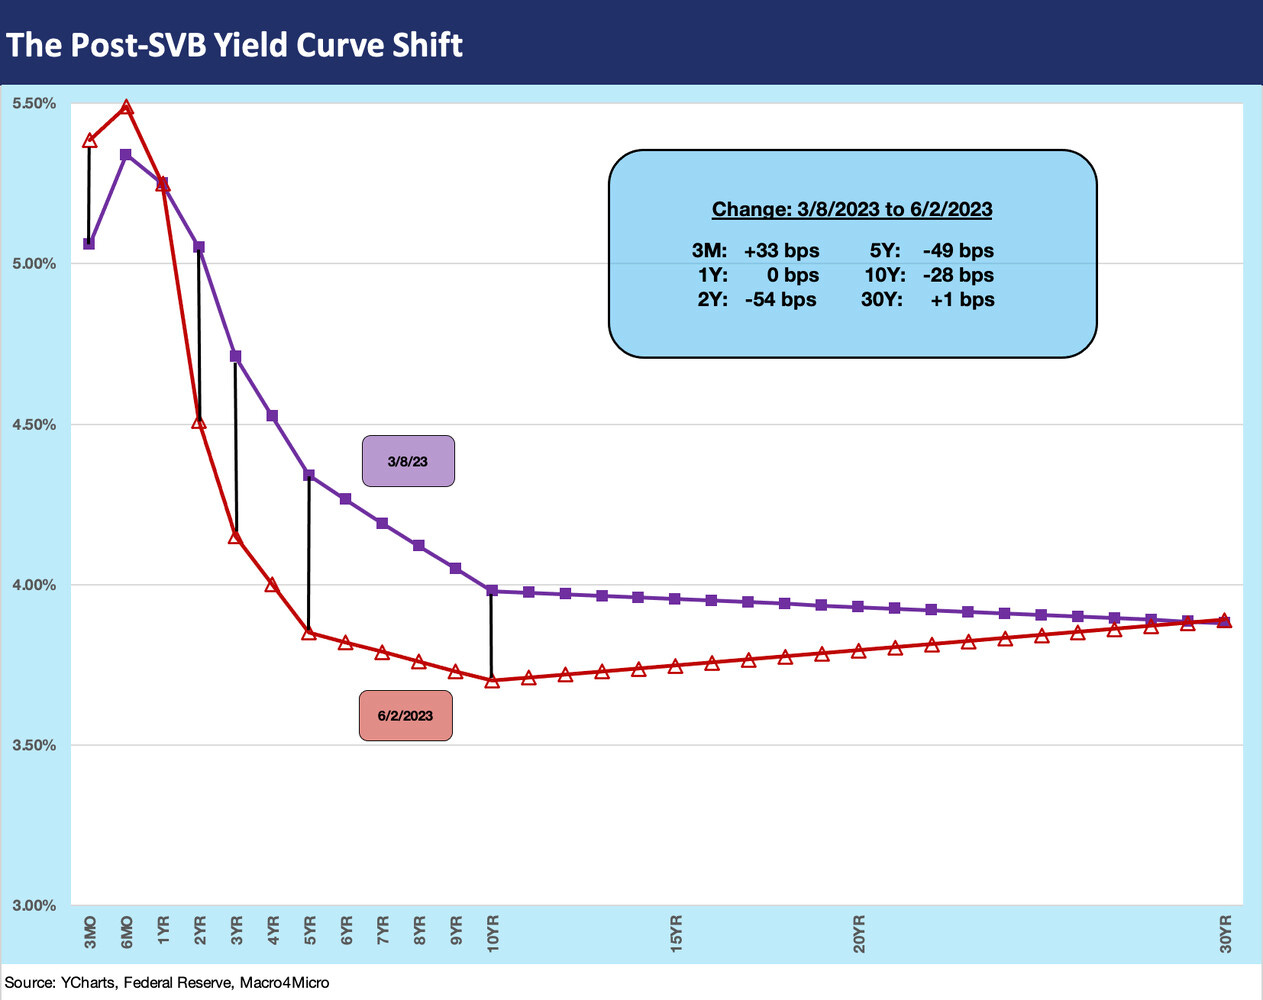
The above chart updates the post-SVB crisis UST curve deltas. We see a material move lower since early March in 2Y, 3Y, and 5Y. That has helped US HY performance given its short duration and also naturally has helped IG returns on the duration support.
The above chart updates our running tally on UST migration from March 1, 2022, the month that ZIRP ended in mid-March 2022. We also note the UST curve move as of 3-8-23 as a useful reference date for when the UST curve was near a peak and the regional bank noise shook up the UST market (see Silicon Valley Bank: How did the UST Curve React? 3-11-23). This is an easy reminder that the UST curve has come a long way.
The debate from here is whether we will revisit the 3-8-23 date in that critical 2Y to 10Y segment of the curve or start a move back towards lower inflation and easing. We still expect a protracted inversion that may redefine how people look at inversions relative to the low inflation cycles of recent decades.
The above chart updates the UST curve visual for another angle on the current curve vs. the pre-SVB 3-8-23 curve. The box breaks out the differentials by UST maturity with the 3M UST higher and the 2Y, 5Y, and 10Y showing the more pronounced inversion effect.
Yield curve slope: 3M to 10Y UST
The UST inversion from 3M to 10Y is captured above, and the inversion is still near the highs at -188 bps, or just slightly off the -189 high of earlier in May. This is where the UST bulls vs. bears can have a real debate that overlaps with the Fed policy discussions and cyclical question marks. The bear steepener risk of the UST curve moving higher is a major issue for mortgage markets among others.
In contrast, the bull flattener scenario is making a good case that the soft landing and inflation-fighting success theme would support many of the more cyclical industries and ease pressures on refinancing or working capital funding. A lot of moving parts can be debated realistically, and that is not making life easier.
Credit Spreads rally with debt ceiling…
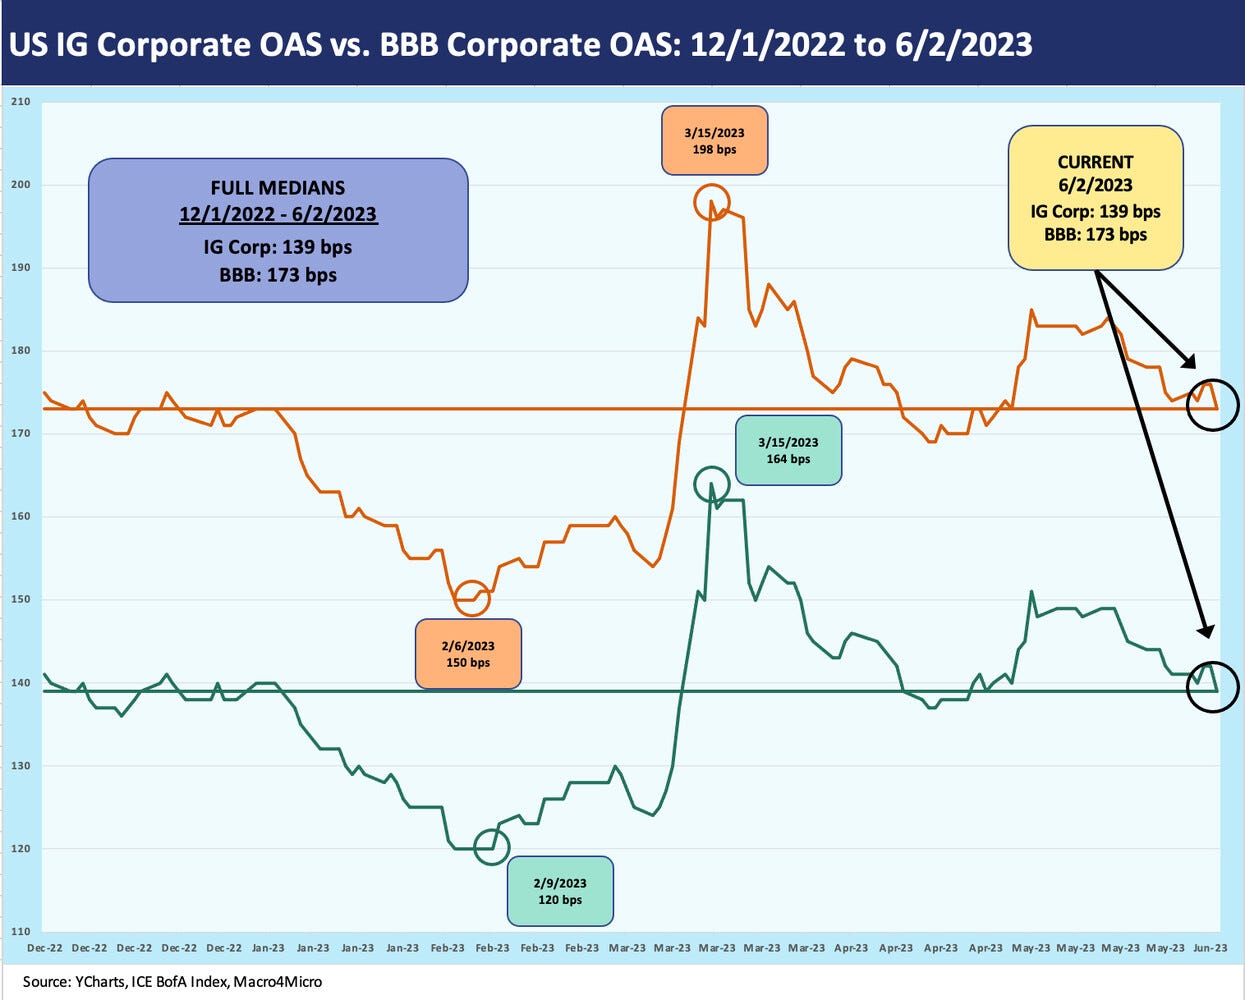
The above chart plots IG index OAS and BBB tier OAS since the start of Dec 2022. We chose a short timeline to cover 6 months to better capture the visuals on the swing wider in March and then the rally. US HY saw a move wider in Dec 2022 and a sharp rally in Jan 2023. We look at those in the next chart.
For the IG vs. BBB chart above, an interesting data highlight is that the 6-2-23 OAS for IG Index and the BBB tier are sitting right on top of the median for the timeline presented. We saw the sharp move wider in March after the regional bank trauma, and then the rally was relatively sustained as credit markets had a mild response to the threats from debt ceiling brinkmanship. The reality and actual events around regional bank seizures had a more notable impact given the importance of bank and financial issuers in the IG index.
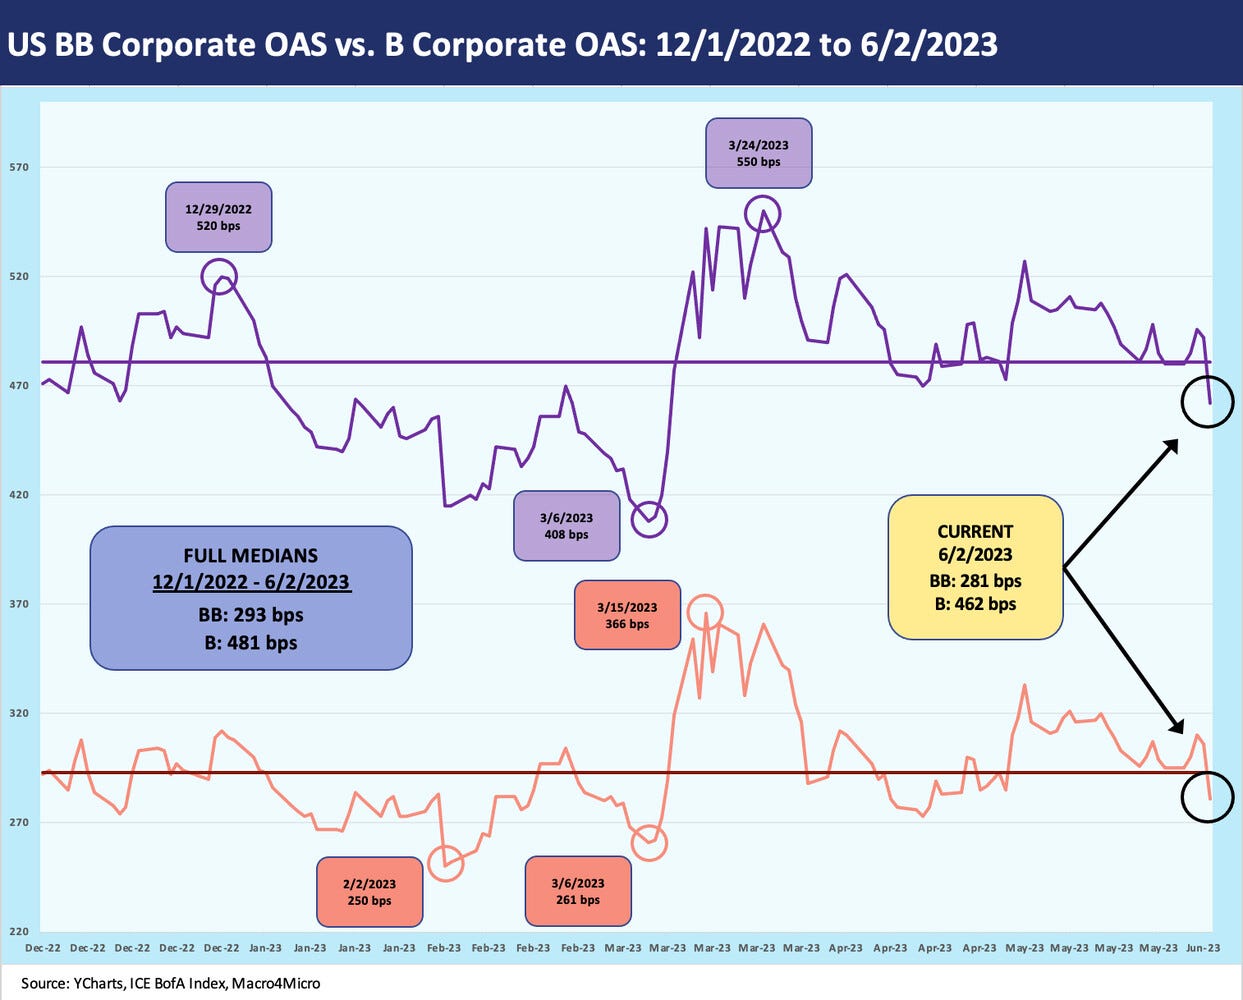
We look at the timeline of credit tier OAS since the start of Dec 2022 for the BB and B tier using the same dates as the prior chart. The US HY performance naturally was more reactive on Friday to the good news of the week on the debt ceiling taken in tandem with a material rally in equities on the day.
As the smoke cleared on a critical week, we saw the overall US HY market quality spread differentials tighten on the week across BB (-14 bps), B (-18 bps), and CCC (-31 bps). The major equity move on Friday was a helpful catalyst. As of Friday, the BB and B tiers were both inside the 6-months median as framed in the chart.
MICRO
Equitrans and Mountain Valley Pipeline’s Wild Ride…
The “Fiscal Responsibility Act of 2023” discussed earlier in the MACRO section brought substantial benefits to a notable midstream operator (ETRN), whose stock roared when the language was released. The actions to support this single important pipeline project will also have some multiplier effect benefits for a number of upstream and downstream operators with interests in seeing higher volume out of the Appalachian natural gas reserve base.
As a rule of thumb, when a new project goes into operation, the movement of natural gas and ancillary product streams continues beyond the narrow project and thus volumes (fees or commodity revenues) climb on multiple fronts depending on the mix of hydrocarbons. In this case, the relief factor is high given the billions sunk into this project and the historical constraints plaguing the major Appalachian basis.
We cut and paste the very clear and specific (and brief) language of the bill at the end of this piece. In plain language the legislation could have said, “The $6+ bn pipeline is happening, and we are taking the decision out of the hands of the regulators who have held you back and the district court where you seem to keep losing.”
The legislation’s language greenlights the approval of the Mountain Valley Pipeline (“MVP”) joint venture for the last steps. Based on management comments even before this victory, ETRN had indicated MVP would be operational in 2023. The reaction of ETRN tells the story as the week posted a +49% return and ETRN zoomed to the head of the pack in YTD total returns as we detail below.
As noted in the language, the legislation mandates that any challenges will be heard in the Fifth Circuit Court in Washington. Basically, the Fourth Circuit Court (Richmond, VA) has been cut out. Joe Manchin had even accused “the same three judges” in the Fourth Circuit of targeting the pipeline and finding problems that various regulators have not agreed with.
It may be a sign of how much of a problem the permitting process is when it takes a UST default threat to get a pipeline that was almost completed to the finish line. On a “half full” note, it is also a reminder of the value of pipelines already in/on the ground. That said, it would be very hard to conclude that the barriers to entry have been lowered, and more legislation has been floating around for a while specific to that topic.
The Appalachian Basin (including the operations of EQT, ETRN’s former owner and by far largest customer) is called the “Saudi Arabia of natural gas” in some quarters, so the strained attempts to build more takeaway capacity was always a headline even beyond the trade rags. The target markets for various regional infrastructure gets tricky, but the MVP is targeting the mid-Atlantic and Southeast.
This corner of the E&P boom over the past decade has had challenges in supply-demand balances and distorted price differentials that got a lot of attention as takeaway lagged. The erratic process undermined the ability of the Marcellus and Utica shale formations to drive more organic growth in cash flow. With the area running short on takeaway capacity for select end markets, MVP became the focal point for what is wrong with the permitting system.
MVP in context…
MVP is 47% owned by ETRN and has been the poster child for problems in capex planning for major projects whether in the US or Canada with their own set of issues up north that deter capital investment. The MVP battle is not new and has ruled headlines as well as stock price action on the company as evident in the chart below.
ETRN is a major BB tier bond issuer even though it is small relative to the major BBB tier names in the space that have debt balance multiples the size of ETRN (e.g., ET, KMI, EPD). It is on the income stock list for many, but ETRN’s stock price action had been erratic around news flow. As a matter of disclosure, I had purchased ETRN stock in 2022 and traded out at a gain in 2022 after the news on MVP ebbed and flowed. It was too much guesswork on the workings of courts and Manchin’s ability to get it to the finish line.
ETRN and EQM fell into the HY index in early 2020 for a range of reasons, but the dependence on MVP for sustained organic growth in cash flow was an important variable. ETRN and its complex history needs a separate commentary, and the merger with EQM cuts across a range of entities some of which were created under the EQT umbrella prior to its spin-off of ETRN in Nov 2018.
EQT had acquired Rice Energy in 2017 with its mix of E&P and infrastructure assets. As with many infrastructure relationships (in part or in whole), there has been a lot of action across the family tree over the years. ETRN and legacy companies are like numerous other names in the space with the juggling act of C Corps, MLPs, simplifications, and what sometimes seems like three card monte with legal entities and securities. That said, the main story for some time has been about MVP, and now that has been cleared up after years of battling.
The role of a key Senate swing vote in Joe Manchin (a well-known MVP advocate) increased the visibility of the issue and chance of success. The debt ceiling process thus gave Democrats something to horse trade to avoid disaster and the GOP the chance to take credit for the MVP approval with Manchin’s Senate seat up for grabs in 2024. The Democrats had stonewalled Manchin’s ambitions until he cut a deal on the IRA in exchange for MVP support from the Dems. Then GOP Senate minority leader McConnell blocked an MVP bill as punishment for Manchin reaching that agreement on the IRA. Now the GOP and Manchin can fight over credit for the approval, but for ETRN stockholders and bondholders the news is a relief.
The above chart then puts the Equitrans rebound this week in context with its YTD leap up the ranks. The updated trailing return charts for midstream equities shows mixed performance numbers YTD for total returns vs. the overall market. Cash dividends still carry ample weight even in a market where cash returns offer sound alternatives for many portfolios who might need a placeholder as major macro variables get worked through. At least now the short UST alternative does not have a default in its future until 2025.
What the legislation says on Mountain Valley Pipeline…
We excerpt some of the Fiscal Responsibility bill language below. There is not a lot of room to misconstrue the clear intent of the law:
“Congress hereby ratifies and approves all authorizations, permits, verifications, extensions, biological opinions, incidental take statements, and any other approvals or orders issued pursuant to Federal law necessary for the construction and initial operation at full capacity of the Mountain Valley Pipeline.”
“Notwithstanding any other provision of law, no court shall have jurisdiction to review any action taken by the Secretary of the Army, the Federal Energy Regulatory Commission, the Secretary of Agriculture, the Secretary of the Interior, or a State administrative agency acting pursuant to Federal law that grants an authorization, permit, verification, biological opinion, incidental take statement, or any other approval necessary for the construction and initial operation at full capacity of the Mountain Valley Pipeline, including the issuance of any authorization, permit, extension, verification, biological opinion, incidental take statement, or other approval described in subsection (c) or (d) of this section for the Mountain Valley Pipeline, whether issued prior to, on, or subsequent to the date of enactment of this section, and including any lawsuit pending in a court as of the date of enactment of this section.”
“The United States Court of Appeals for the District of Columbia Circuit shall have original and exclusive jurisdiction over any claim alleging the invalidity of this section or that an action is beyond the scope of authority conferred by this section.”
“This section supersedes any other provision of law (including any other section of this Act or other statute, any regulation, any judicial decision, or any agency guidance) that is inconsistent with the issuance of any authorization, permit, verification, biological opinion, incidental take statement, or other approval for the Mountain Valley Pipeline.”
From our standpoint, that pretty much covers it for a massive project that can now proceed to completion.
The capex planning and permitting are still murky…
While the MVP news was a major immediate positive for a subset of the midstream and upstream markets, the broader optimism around permitting and major new energy initiatives – especially on the infrastructure side, will still need to navigate Progressive anger and the vagaries of the court system. The Democrats will need to go into damage control mode with the hard-core climate constituency in its base.
The pro-carbon vs. anti-carbon heavyweight fight is still on, and the court battles are not going away any more than the FERC or the regulatory alphabet checklist cited in the legislation. The battle sure looks like it is going away for MVP and the massive-embedded investment held by its stakeholders with ETRN right at the top. The industry experts and lawyers for the warring factions will have plenty of follow-up color to watch around what this means for other challenges.








He does look younger than me. But I need that sweater.
I really liked your picture at the top of the report...you look younger there.
Of course kidding.
Thanks for the hard work and comedy...oh yeah that is supplied by our leadership.
Take care