
May Employment: Payroll Records Continue
The jobs swarm continued even in the lead up to the debt ceiling's wild finish.


“Job opportunities still drawing a crowd."
Job adds for May came in strong again as record payroll keeps ticking higher despite the headline unemployment rate rising from 3.4% to 3.7% in a range that has been in place since March 2022 when ZIRP ended before CPI ran to new highs.
The BLS release had a heavy dose of “little changed” in the commentary in stats such as marginally attached, part time, and labor participation rate (unchanged).
The +4% range for YoY hourly worker wages (+4.3%), in goods-producing (+4.6%) and in private services (+4.25%) did not set off alarms and at least supports consumption with more bodies in the employed ranks.

The steady rise in payroll count got the market excited, notably given the fact that those numbers were generated even in the face of all the debt ceiling dramatics and recurring regional bank anxiety. The combination of these payroll numbers for May and the JOLTS numbers for April released earlier this week (see JOLTS: Debt Ceiling Threat Did Not Derail Postings 5-31-23) tell a story of some unflappable employers who will keep on track with their plans until they see tangible proof of weakness in their core businesses (order rates, service backlog, working capital needs, etc.).
The actual hiring gets captured in the monthly employment numbers, and the signals of “mood” can be seen in the JOLTS data. The most recent data point is record payroll counts and the other recent data point is rising job openings back above 10 million for April. The job openings compare with an actual unemployed total of 6.1 million. That comparison comes with a lot of asterisks, but it is a solid story. Until we see both the JOLTs numbers and payroll get trimmed, it is hard to jump into recession scenarios to arrive at a “lag to be named later.”
The employment trends across the sea level occupations is something we looked at in detail for LTM and post-COVID deltas (see Employment April 2023: Post-COVID Deep Dive by Occupation 5-5-23), and this latest jobs release did not tell notably bad stories at the industry line.
The +339K jobs detailed in the bar chart above was accompanied by material upward revisions in April job adds (another +41K added to a revised +294K) and March data (another +52K added in revision to +217K). As usual, we invoke the rule of “Mo jobs, Mo Money” that usually translates into “Mo Spending, Less Household Defaults.” That second part (spending, paying your bills) is obviously not assured, but more paychecks beat less. That is not advanced econometrics.
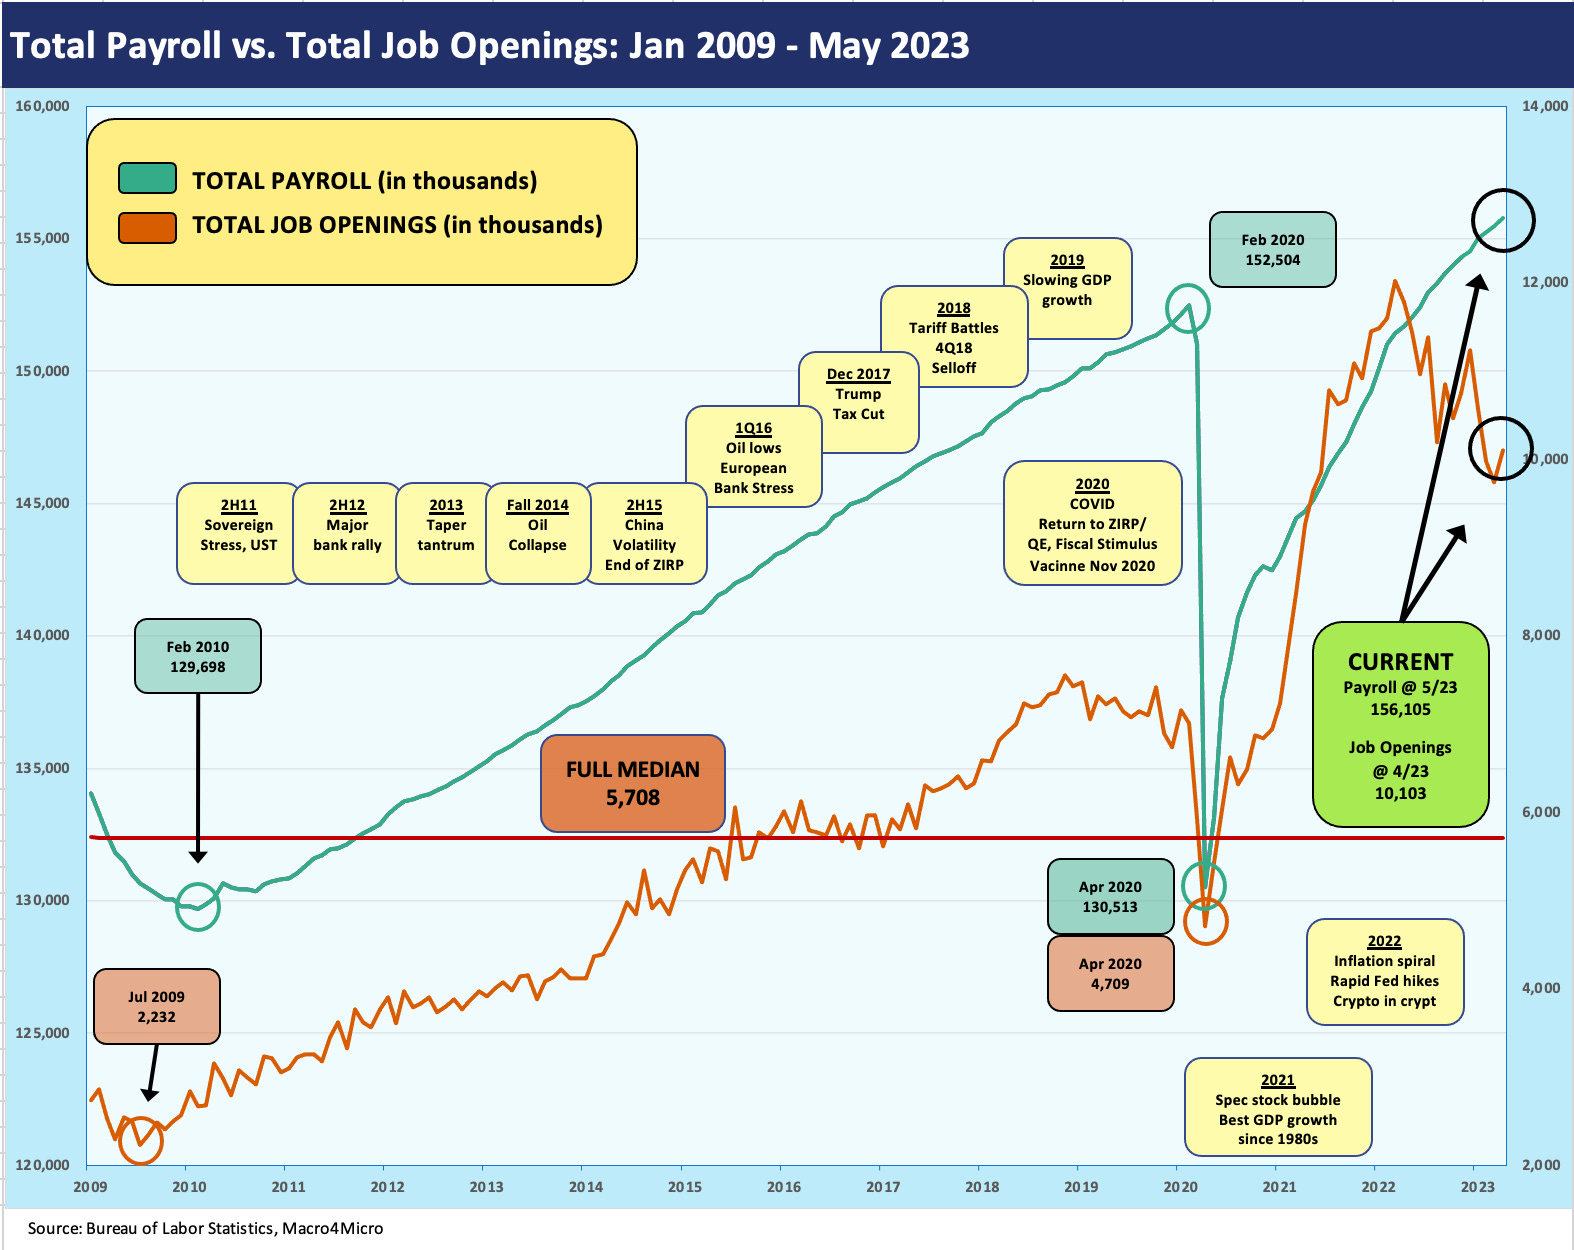
The above chart plots payroll vs. JOLTS (note: 1 month lag on JOLTS). We see the same employment themes as seen in recent months. Namely, it is tough to spin this as a negative sequentially or YoY or in historical context. Peaks come eventually but the PCE marches into battle on the consumer. The boost to construction and IRA related beneficiaries stays in place after the debt ceiling deal, and we see that in the construction numbers (see Construction Spending: Demystifying Nonresidential Mix 5-9-23) and in construction jobs (+25K for May).
Across the mix of “Goods” jobs, we only saw +26K in May with Construction the main event at +25K and Manufacturing only at -2K. The manufacturing line on jobs supports those talking about cyclical peaks in some bellwether industries. Private Services occupations drove the bus this month at +257K followed by Government at +65K (dominated by State and Local).

The above chart plots the monthly payroll adds vs. the headline unemployment rate (U-3). The time series covers the post-crisis period (the credit crisis, not the COVID crisis), but we remove the worst swings in COVID in the interest of chart visual utility. We break out those wild COVID swings in the box within the chart. In the chart further below we plot the U-3 vs. the Total Payroll. These charts go hand-in-hand.
We hit the 3.4% post-1960s low twice in 2023 (Jan, April), and the overall employment growth helps justify optimism on the demand side of PCE as it flows into GDP. Some of the other numbers in the mix were worse this month sequentially (U-4, U-5, U-6), but we tend not to get too caught up in that number series. On a YoY basis vs. May 2022, other variants of “above U-3” metrics are biased to flat to better (U-4 and U-5 flat, U-6 better).
We saw some solid numbers in the most recent personal income and outlays report (see Personal Income and PCE: Inflation Stickier 5-26-23), so this jobs report keeps the beat going. The half-empty side of all this is that the Fed has another “negative” data point on inflation fears and keeps the to-and-fro going on the need to tighten in the next FOMC session or the one after that.
The recurring phrase of “just wait for the next CPI number for a better read” was a common reaction again on the financial media circuit and the cable show discussions. The CPI numbers have YoY math on their side but the steady move higher in demand will still make life tough for the Fed if the YoY wage increases remain over 4%. The new White Whale is a sighting of a few rounds of 3% inflation metrics.
