PulteGroup 1Q23: Company Comment
We look at a strong quarter from Pulte as the #3 builder posts solid margins despite industry-wide volume weakness.
“Who says houses don’t grow on trees?”
Pulte put up some good financial numbers with homebuilding revenues and earnings up YoY 1Q23 vs. 1Q22 while low leverage and balance sheet liquidity remain positive factors.
Gross margins were solid as a partial shift away from build-to-order to more spec building pays off.
There is no hiding from the steady slide in YoY backlogs and orders for Pulte or the homebuilders broadly, but the stabilization theme was heard on the earnings call as potential buyers get more accustomed to 6% handle mortgages.
Key markets such as Florida and Texas (PHMs two largest) are making the difference for PHM.
The #3 builder weighed in with 1Q23 earnings, and the gross margins and stories around their core markets were supportive as homebuilding continues to demonstrate its resilience and outperform the broader securities markets. PHM’s ability to post 29% handle gross margins was a strong signal to the equity and credit markets about where the shifts across volume, pricing net of incentives, and variable costs are shaping up on a net basis for financial trends. The cash flow strengths were reflected in a fresh $1 bn incremental share buyback approval. The stock market reaction was immediately favorable as we go to print at +2% on a day when the broader market is slightly selling off.
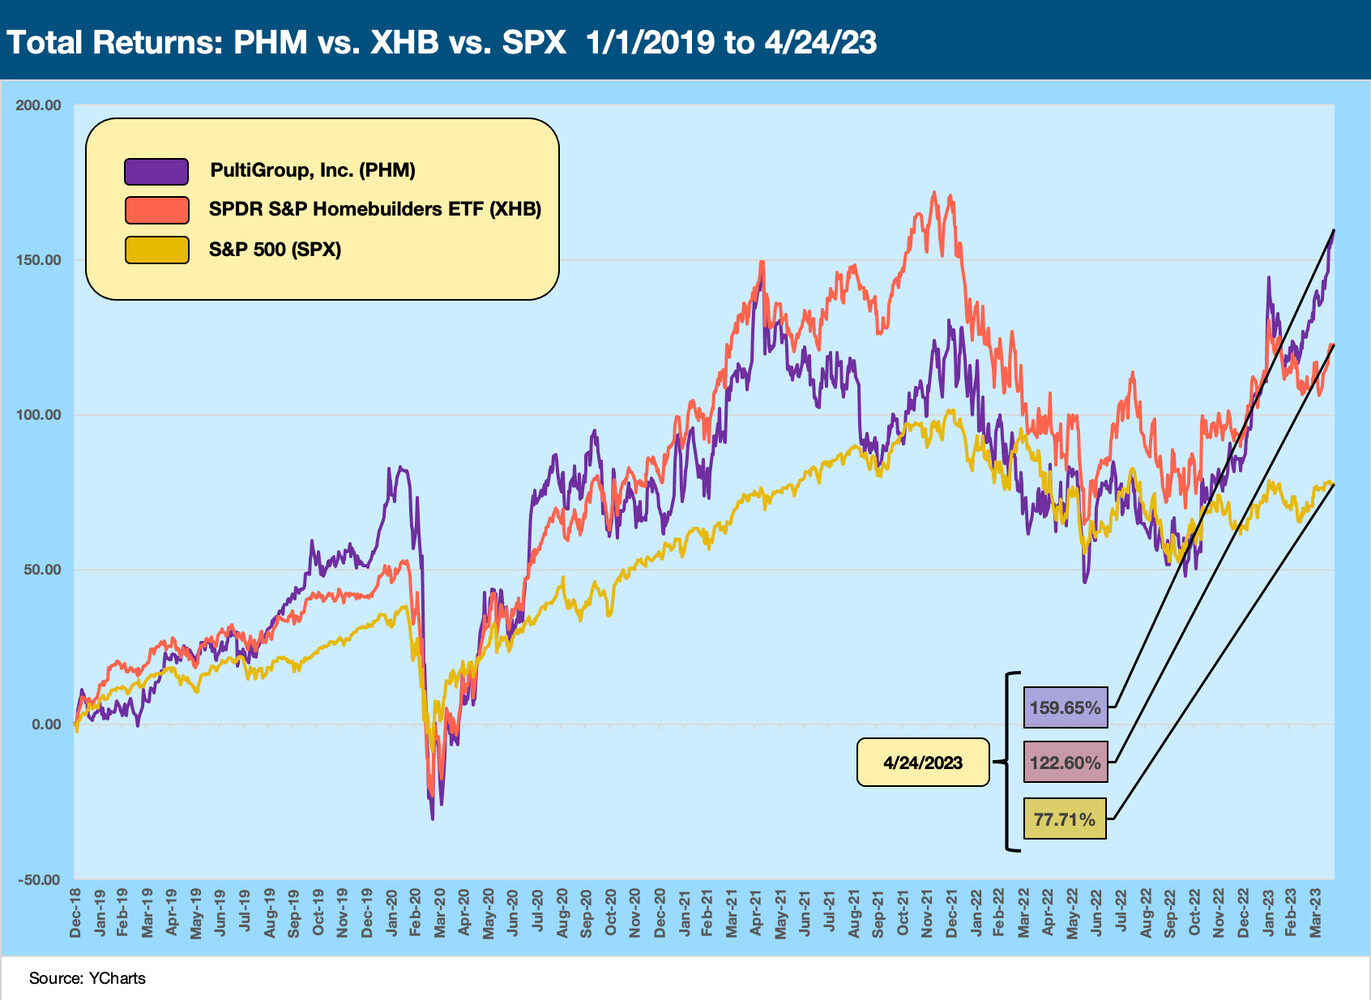
As we detail below in the equity charts above and below, PHM equity has been a solid relative performance vs. the broader market over the period from before COVID and during the inflation and tightening period. The chart above frames PHM vs. the homebuilder ETF (includes both builders and suppliers) and the S&P 500. PHM wins that comparison.
Below we plot PHM in the Big 3 builders with D.R. Horton and Lennar against the S&P 500 for the period from just before the end of ZIRP through last night close (i.e., before today’s outperformance). Pulte is getting it done.
PHM hung with D.R. Horton (DHI) over a very tough two years of mortgage spikes, inflation fears, supplier chain challenges, and recession risk chatter. That said, DHI has been aggressively pushing into more ventures from land development to single family rental to sustain its growth potential down the line. PHM has a deliberate and more conservative strategy after some earlier histories of boardroom drama.
The ability of the major builders to fine tune construction in process, spec inventory, and manage the mix of land spend, starts, and closings in the working capital process will be getting some tests ahead (see Housing: Starts and Permits and the Working Capital Challenge 4-18-23).
As PHM and other builders have indicated, forecasting ahead for a single quarter is a necessity but full-year guidance has too many moving parts to be very definitive at this point. That is especially the case with mortgage rates at the top of the list and broader economic contraction a tough one to call with peak selling season now upon us.
By the numbers…
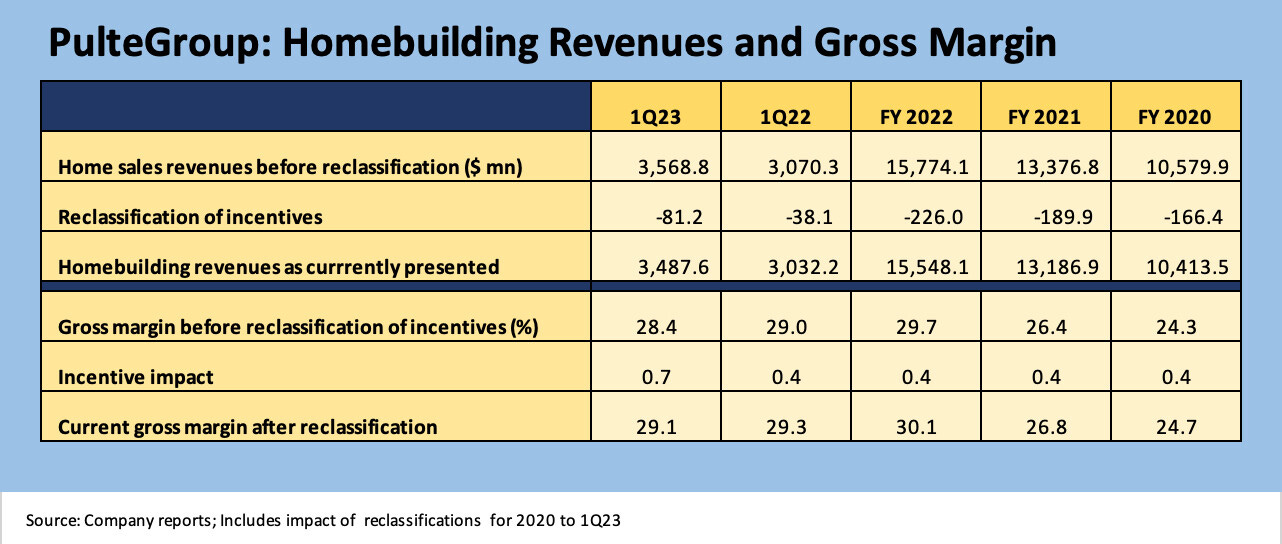
Gross margins tend to be the dominant variable for those watching the builders, and the PHM gross profit numbers came in quite strong regardless of the reclassification of incentives into the revenue line from the cost of sales line. The company provided some additional disclosure in its supporting slides on what the changes meant back to FY 2020, and we reflect those below.
Margins in a 29% range will be hard to sustain as weaker prices are likely to flow into the numbers during 2023, and management pointed out they would not be “margin proud.” The gross margins from 2019 to 2021 were in the mid-20% handle area, so they have ample room to maneuver. The impact of incentives as detailed above underscores the very competitive market of 2023 relative to gross margins.
Volume and operating metrics and regional breakdowns…
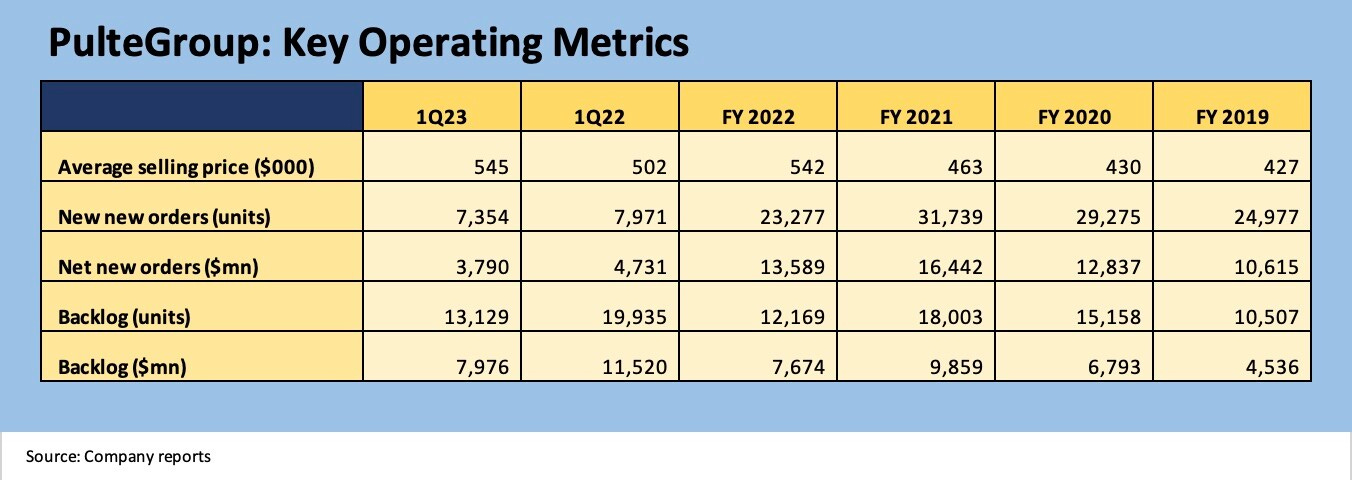
Below we break out the regional closing data and how volumes rolled up into average selling prices, orders, and backlogs for some signals on where the company is headed. Gross margins were impressive, orders were down sharply along with industry-wide volumes, but backlogs ticked higher from year end with the crucial seasonal demand increases ahead.
The volume numbers for closings in 1Q23 vs. 1Q22 show how much demand in the sector has dropped off since the end of ZIRP and the mortgage spike that really kicked into gear after 1Q22 earnings. Despite the closings plunge, home sales revenue was +15% (ex-land sales) with income before taxes at +17% on the way to a $532 million bottom line in 1Q23 ($455 mn in 1Q22).
We lined up closings for 1Q23 from highest to lowest, and the importance of the Florida and Texas markets is clear enough. Both were up substantially in 1Q23 with Florida especially strong. The Southeast also put up a healthy increase with the West and Midwest down substantially and the small Northeast market higher.
The last operating metric chart offers some details on orders and backlogs based on units as well as dollar value. We also provide average pricing details. Orders plunged with mortgage rates and the backlog of 1Q22 of over 19K units was run down to year end 2022 level of just over 12K as noted. That backlog has ticked up sequentially in 1Q23 to 13.1K with a value of almost $8 billion. The average sales price in backlog was $608K or up 5% YoY. Some of those effects get into mix shifts. PHM is strong in move-up and active adult segments. Overall, this is a strong performance in a challenging market.
Quick notes on the balance sheet…
PHM has a very strong balance sheet with “House and Land Inventory” at 5.6x total homebuilding debt. “Homebuilding debt and Inventory + Cash” stands at 6.2x homebuilding debt. Gross homebuilding debt is 18.1% of capitalization with net debt at 7.6% of capitalization. The $1.28 billion in cash and equivalents highlights the strong balance sheet liquidity even as inventory liquidation will continue keeping cash flow strong in 2023.


