
Footnotes & Flashbacks: State of Yields 10-29-23
A quiet UST market sees a rare winning week for fixed income ETFs.


We look back at a week where booming 3Q23 GDP numbers and strong personal consumption numbers did not phase the UST curve and saw a flattener run alongside a weak equity market.
PCE inflation numbers weighed in on the side of sustained higher-for-longer conviction even though the inflation signals were in line with expectations.
Oil has been manageable and largely immune to Mideast tension so far with WTI hanging around $85 Friday vs. $88 the prior week.
We update some UST segment slopes with a look at 3M to 5Y UST and then 5Y to 10Y UST as the various shifts from earlier inversions will keep the duration decision a tricky one.

The above chart updates the steady UST migration across the period from the end of 2021. The shape has not changed materially from last week when the UST curve took a beating (see Footnotes & Flashbacks: State of Yields 10-21-23). We break out the fed funds moves in the internal box in the picture covering the ride from ZIRP to 5.5% upper target. The debate on any new moves by the Fed will continue, but the weight of the market voting is that the Fed will let the higher real rates on the intermediate and longer end of the curve do the dirty work from here.
The ability of the UST curve to yawn at the 3Q23 numbers and Friday’s PCE consumption pop was reassuring to those planning an extension into more duration risk and to those who moved in too early. Higher for longer may be an embraced reality, but the term premium debates and the interplay with the UST supply-demand outlook for rising UST issuance volumes will get back into action.
With Israel ramping up its ground game over the weekend and the diplomatic headlines getting noisier, the potential paths ahead are going to get more numerous especially with an unpredictable Iran and Hezbollah on the loose. There is a flight to quality path in there somewhere but that one would require US military action.
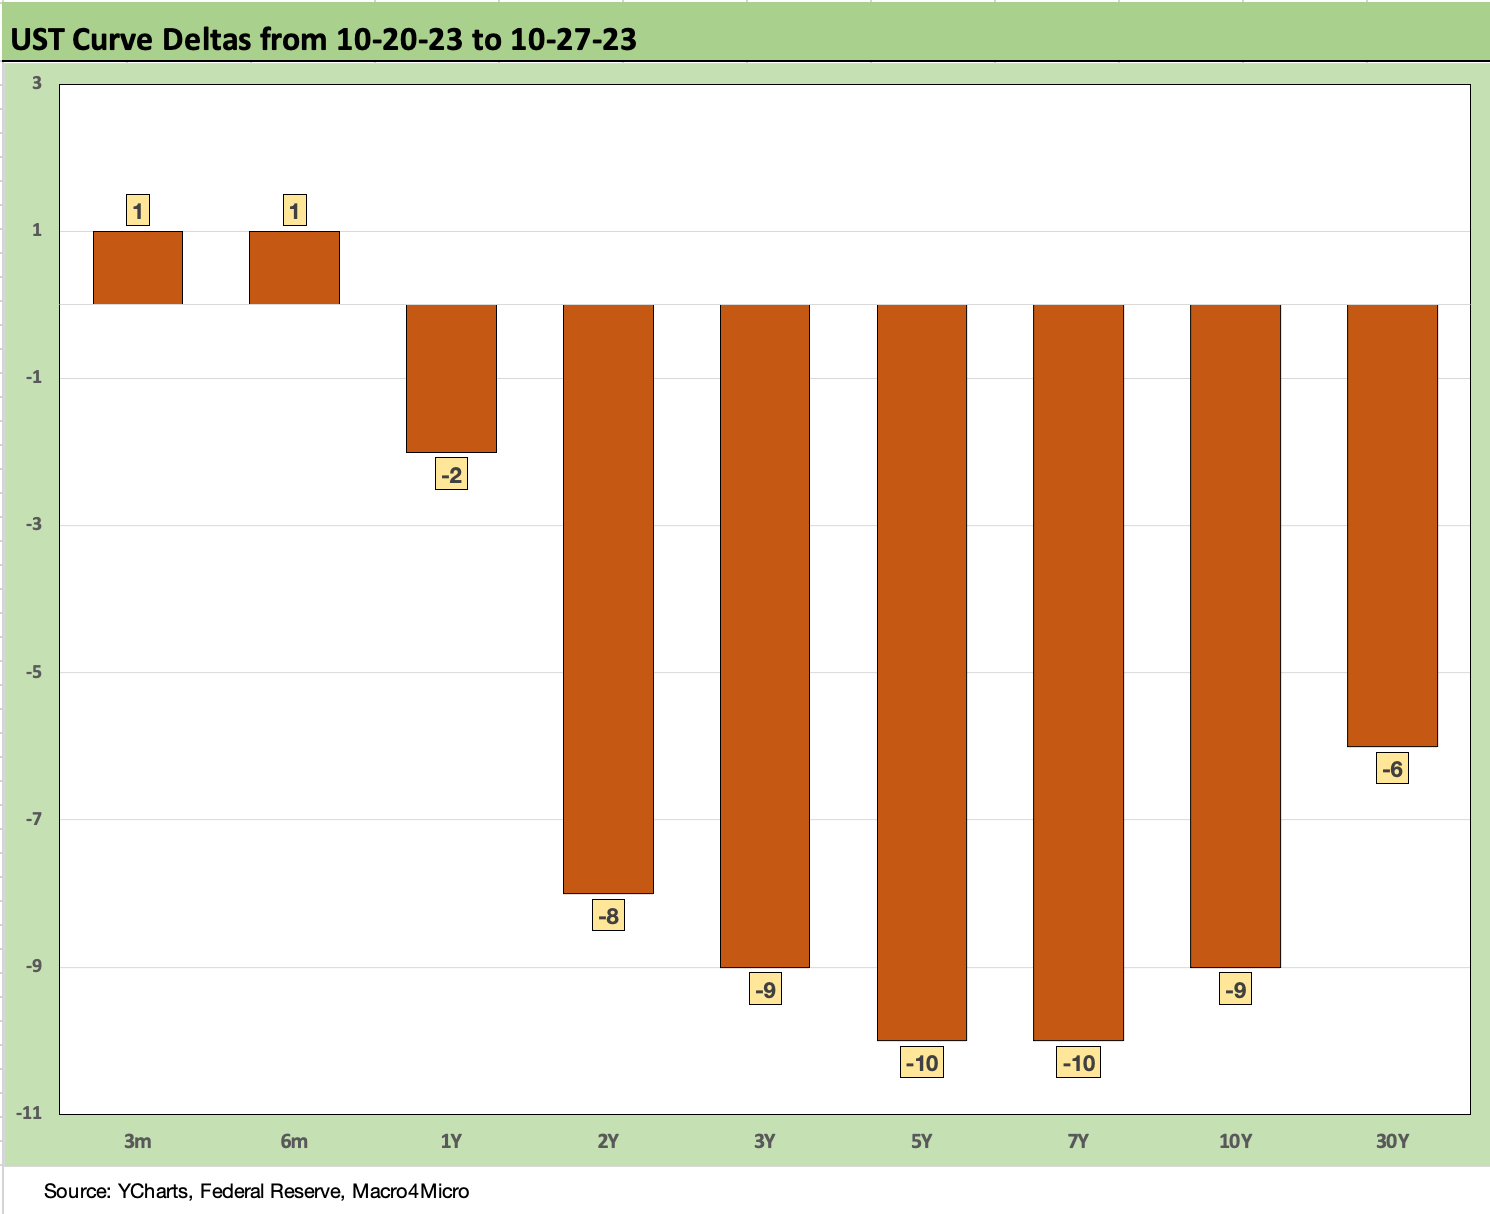
The above chart highlights the UST deltas across the curve with the short end uneventful but 2Y to 10Y seeing a downward shift despite an above-consensus consumption number in the monthly PCE release (see PCE Sept 2023: Consumption Strong, Inflation Steady 10-27-23). 3Q23 GDP weighed in with a very robust headline GDP number of +4.9% (see GDP 3Q23: Old News or Reset? 10-26-23). The GDP numbers were led by 4.0% in PCE and 7.6% on PCE for Durable Goods. Those consumption levels are not showing a consumer sector “dialing it back.”
We also took a look at the Savings Rate question marks that got some financial market airtime with the PCE release (see Savings Rates: Context Across the Cycles 10-27-23). The move to 3.4% was an eye-opener and starts the clock on when “enough is too much.” The savings rate is still above the frothy 2005-2006 period, but not by much.
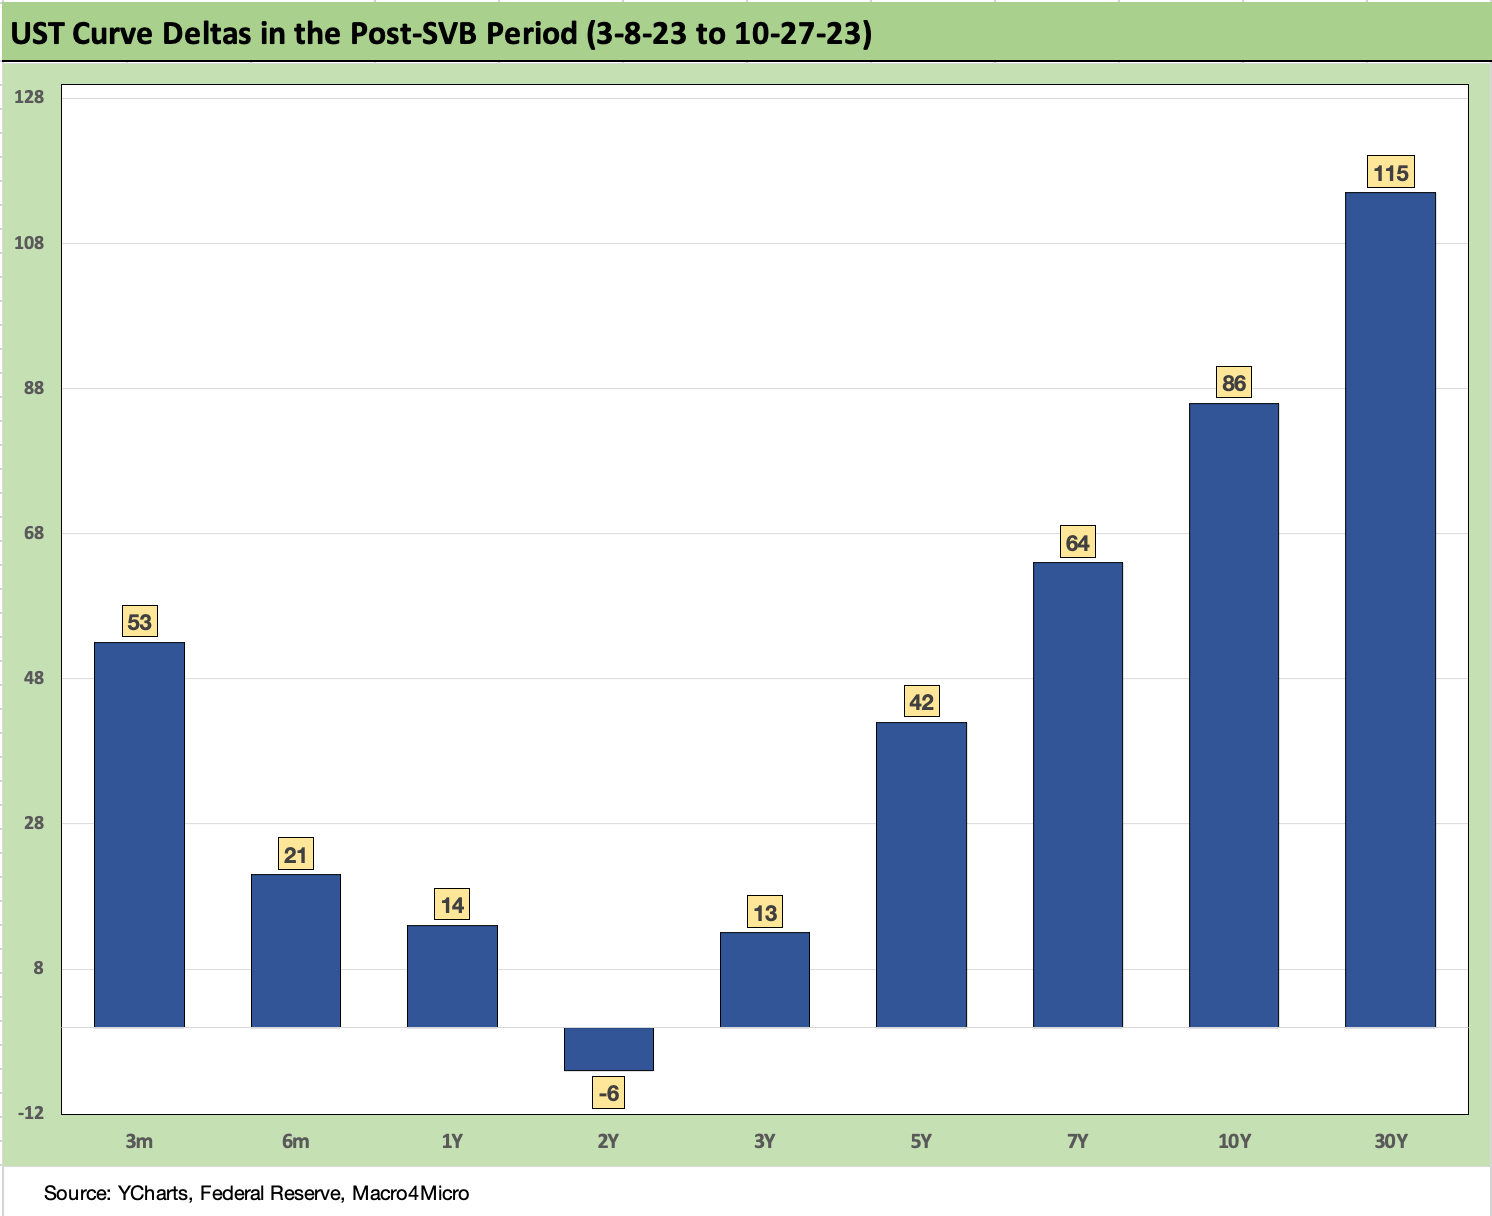
The above chart updates the UST curve for the post-SVB period as the bear steepening is very much alive after a stretch of serious duration damage even if the 2Y UST is lower. As a reminder, the March 8 date was the last clean trading day before the regional bank mini-crisis kicked into gear. That was two earnings reporting periods ago, and the threat subsided so far.
With the Fed likely to hold the line where it is, the deposit cost threat is likely seen as maxed out at this point as assets reprice and cost of funds are at least manageable. The asset quality and provisioning adequacy skepticism comes at a lag, and those are still very much alive.
What has been interesting so far in UST behavior is the relative lack of a flight to quality pattern in the context of the Middle East crisis. The swing factor could be the expectation that there will be a lot more UST borrowing ahead either way subject to what the White House and Senate can get past an increasingly radicalized House and its new leader (who led the legal challenge to the 2020 election results).
The House strategy does not reflect brinkmanship as much as an all-or-nothing plan (on everything) controlled by a dozen or so extremists. The last guy who interfered with that was removed as speaker. The “new guy” seems more a “true believer” zealot. That could mean government shutdown risk is high.
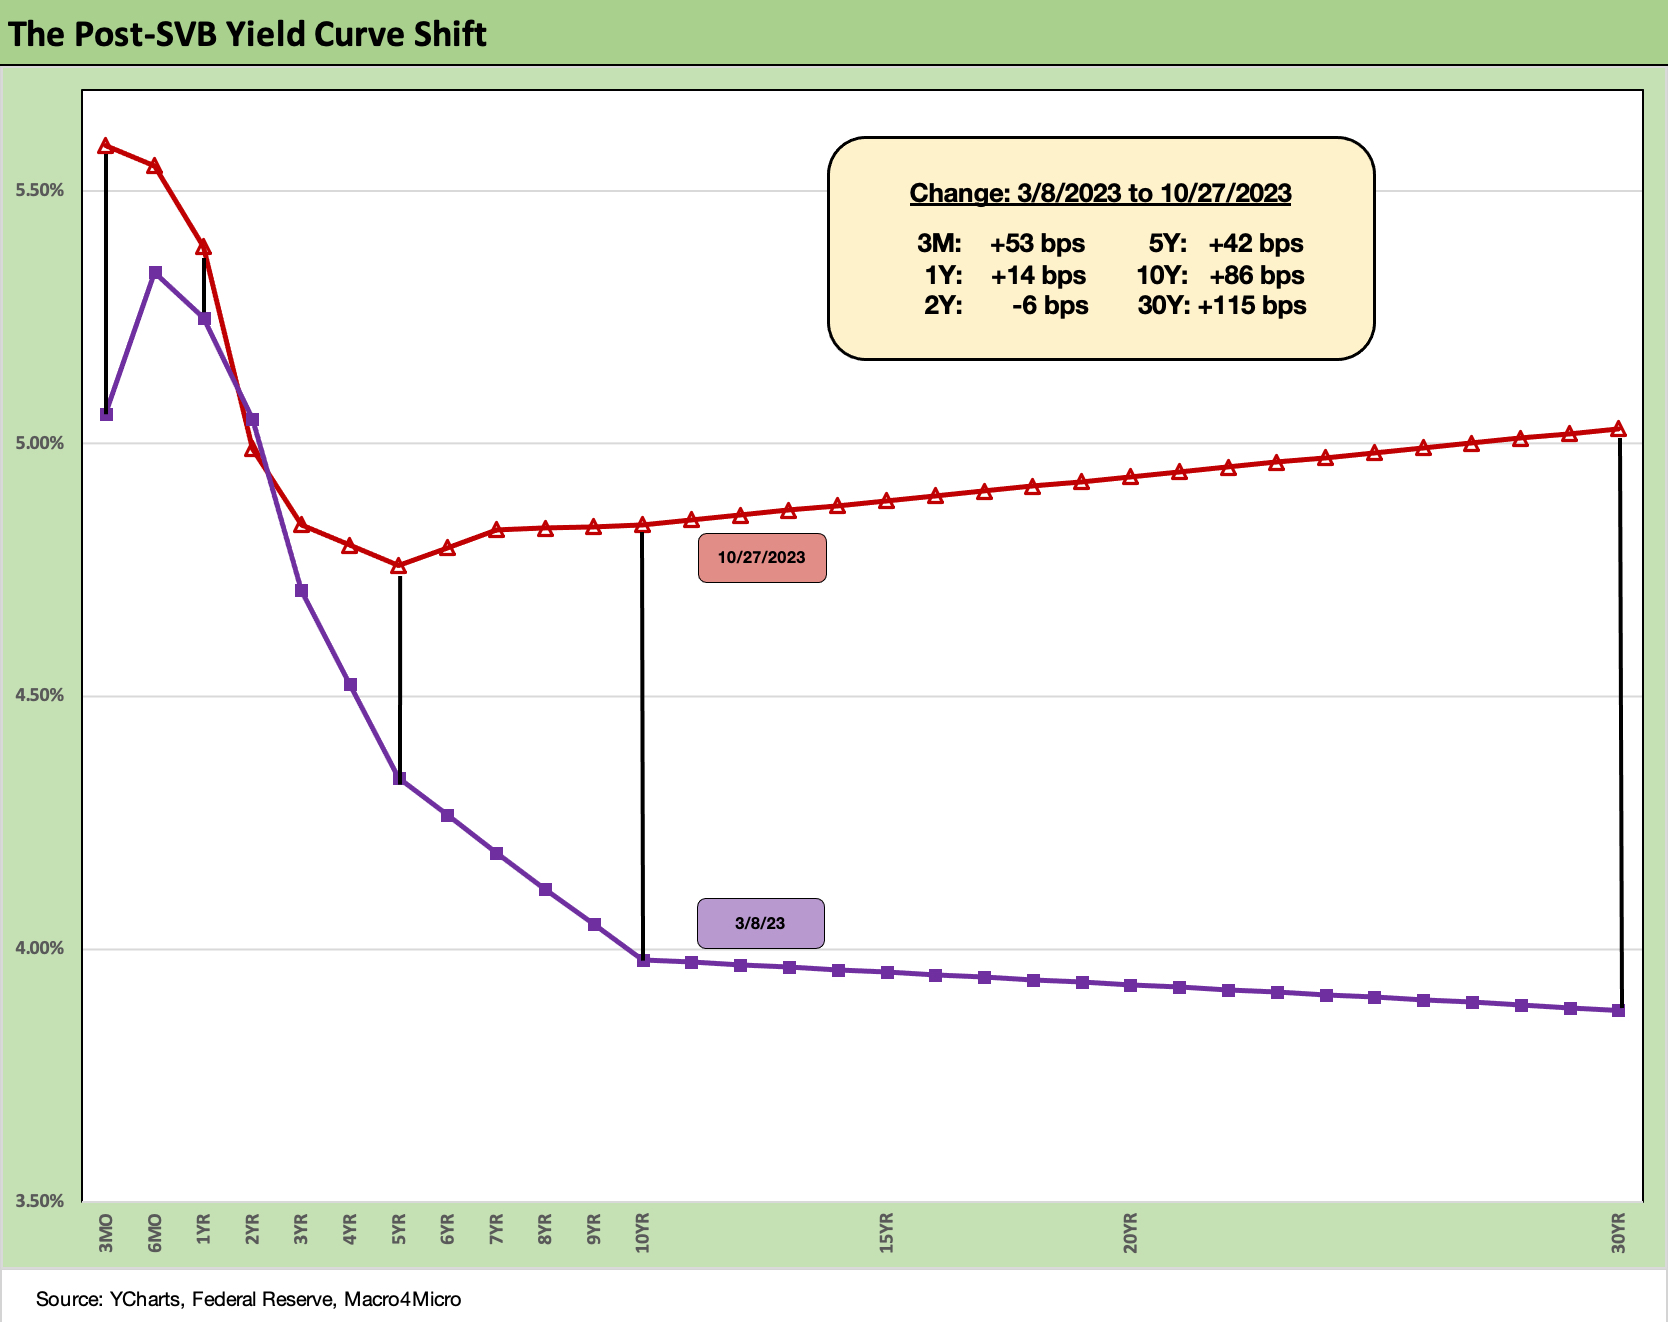
The above chart puts the post-SVB UST deltas into a UST curve format. The effects are pretty clear in this visual. The move to a steepener from inverted beyond 5Y UST has been tough on bond performance. We look at the migration of the 5Y to 10Y UST slope further below.
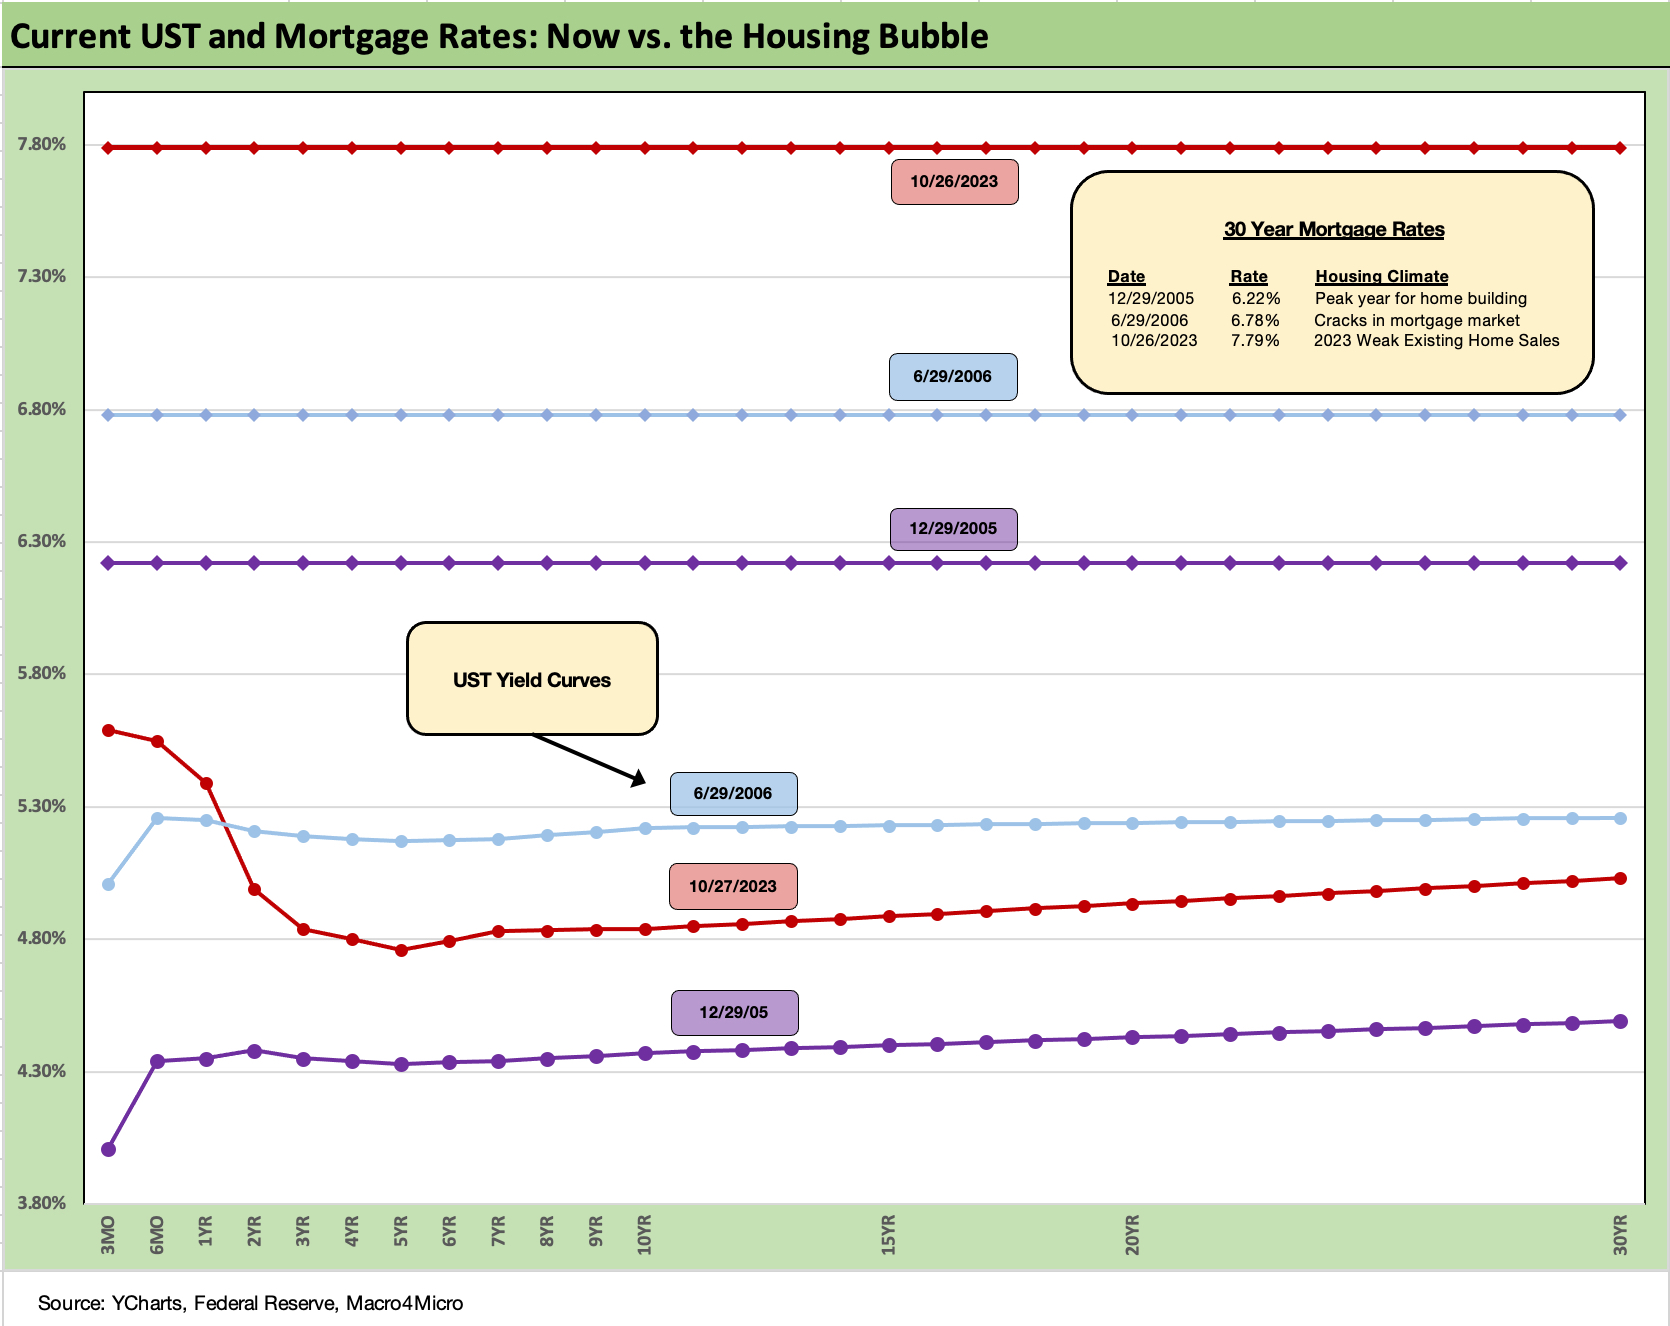
The above chart updated the 30Y Freddie Mac mortgage benchmark and the current UST curve. We also drop in the UST curves and Freddie mortgage level for two periods from the housing boom and bubble. We include the year end 2005 as the peak homebuilding year and the middle of 2006 when the “liar loan” phenomenon and subprime excess was cresting.
In 2006, subprime was starting to show some cracks but not yet sending the credit markets into a case of nerves. That would take a few more quarters. Even then, equities only folded later in the fall of 2007 before the onset of a recession in Dec 2007 (that “official” date for recession was set much later).
It is notable that the current UST curve is now well above the end of 2005 in 10Y UST but below the intermediate and long end of the UST curve seen in mid-2006. Despite that UST configuration, the 30Y mortgage levels of 2023 are well above 2006 and pulling away.
The actual levels across a wider expanse of mortgages and fee structures hit 8% last week (see Sept Existing Home Sales: The 7% Solution Running Low 10-19-23) while the Freddie Mac 30Y benchmark crept up this week from 7.63% to 7.79%.
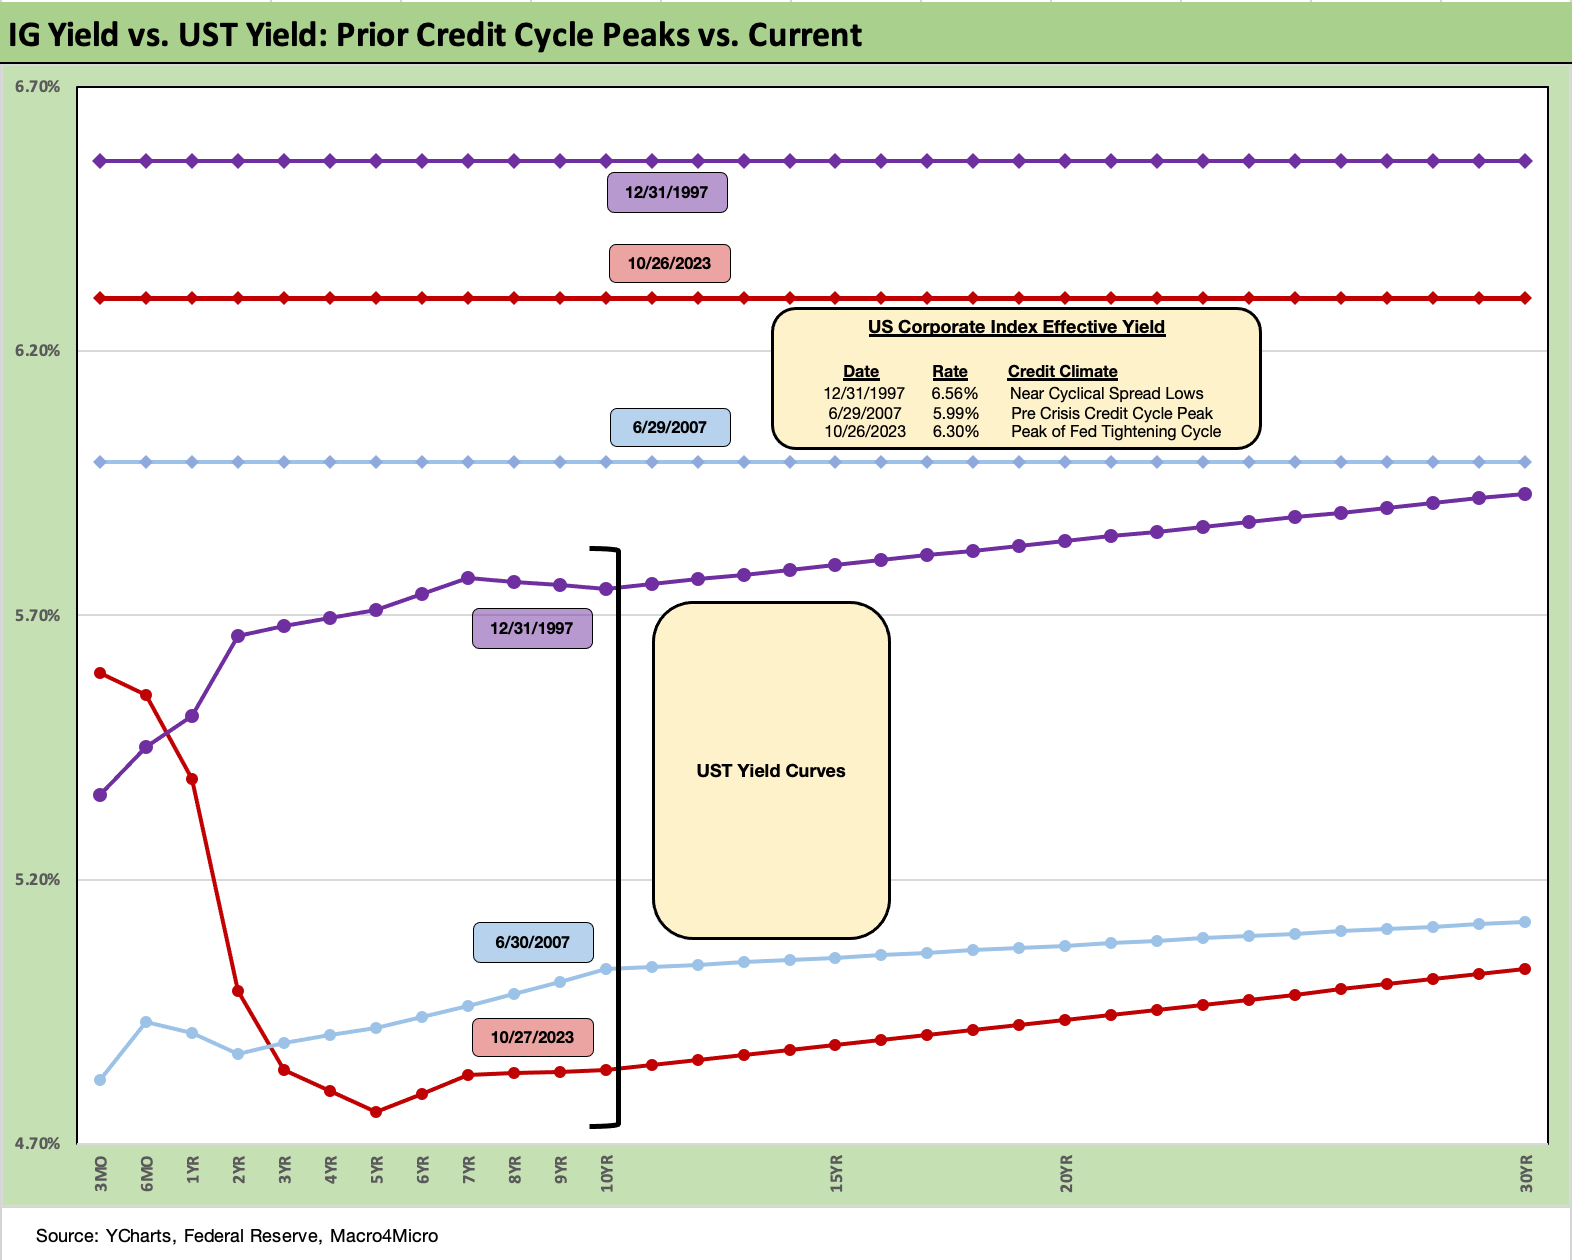
The above chart goes through a similar exercise for the current UST curve and IG index yield for current days vs. two periods where the market was at or near spread lows.
Spreads were much tighter in those peak periods relative to the +131 bps to close last week in the ICE IG index (10-27-23). For the past week, IG spreads tightened by -2 bps. The ICE IG index OAS is in the area of the long-term median, so spreads are not wide to historical levels.
The +70 bps for the index at the end of 1997 was much lower (the low was in Oct 1997 at +53 bps) and +100 bps at 6-30-07. The 1997 and 2007 periods were tight parts of the credit cycles on shaky ground given the direction of credit quality. As we know, a lot can happen in a hurry even in IG as later 2007 and 2008 showed.

The above chart does the same drill for the US HY market as we did for the IG markets. We use the same dates to frame the symmetry of risks today. We see HY OAS back in June 1997 at +296 bps (12-31-97) although HY OAS had been inside +250 bps in Oct 1997 (+244 bps 10-17-97).
During the crazy period of June 2007 as the market fuse was burning down, we saw HY OAS of +298 bps on 6-30-07 (as tight as +244 on 6-1-07) vs. the +453 bps (10-27-23) to end last week. HY OAS was +1 bps wider on the week. These levels are modestly below the long-term HY median, so there is a long way to go if the market gets sloppier and the geopolitical risks head in an uglier direction. Oil has been well behaved so far in all the Mideast turmoil.
The fundamentals have been in aggregate solid and 3Q23 earnings season not signaling worry in the immediate context of spreads. The forward expectation handicapping continues, but this is a very different HY cycle than past downturns.
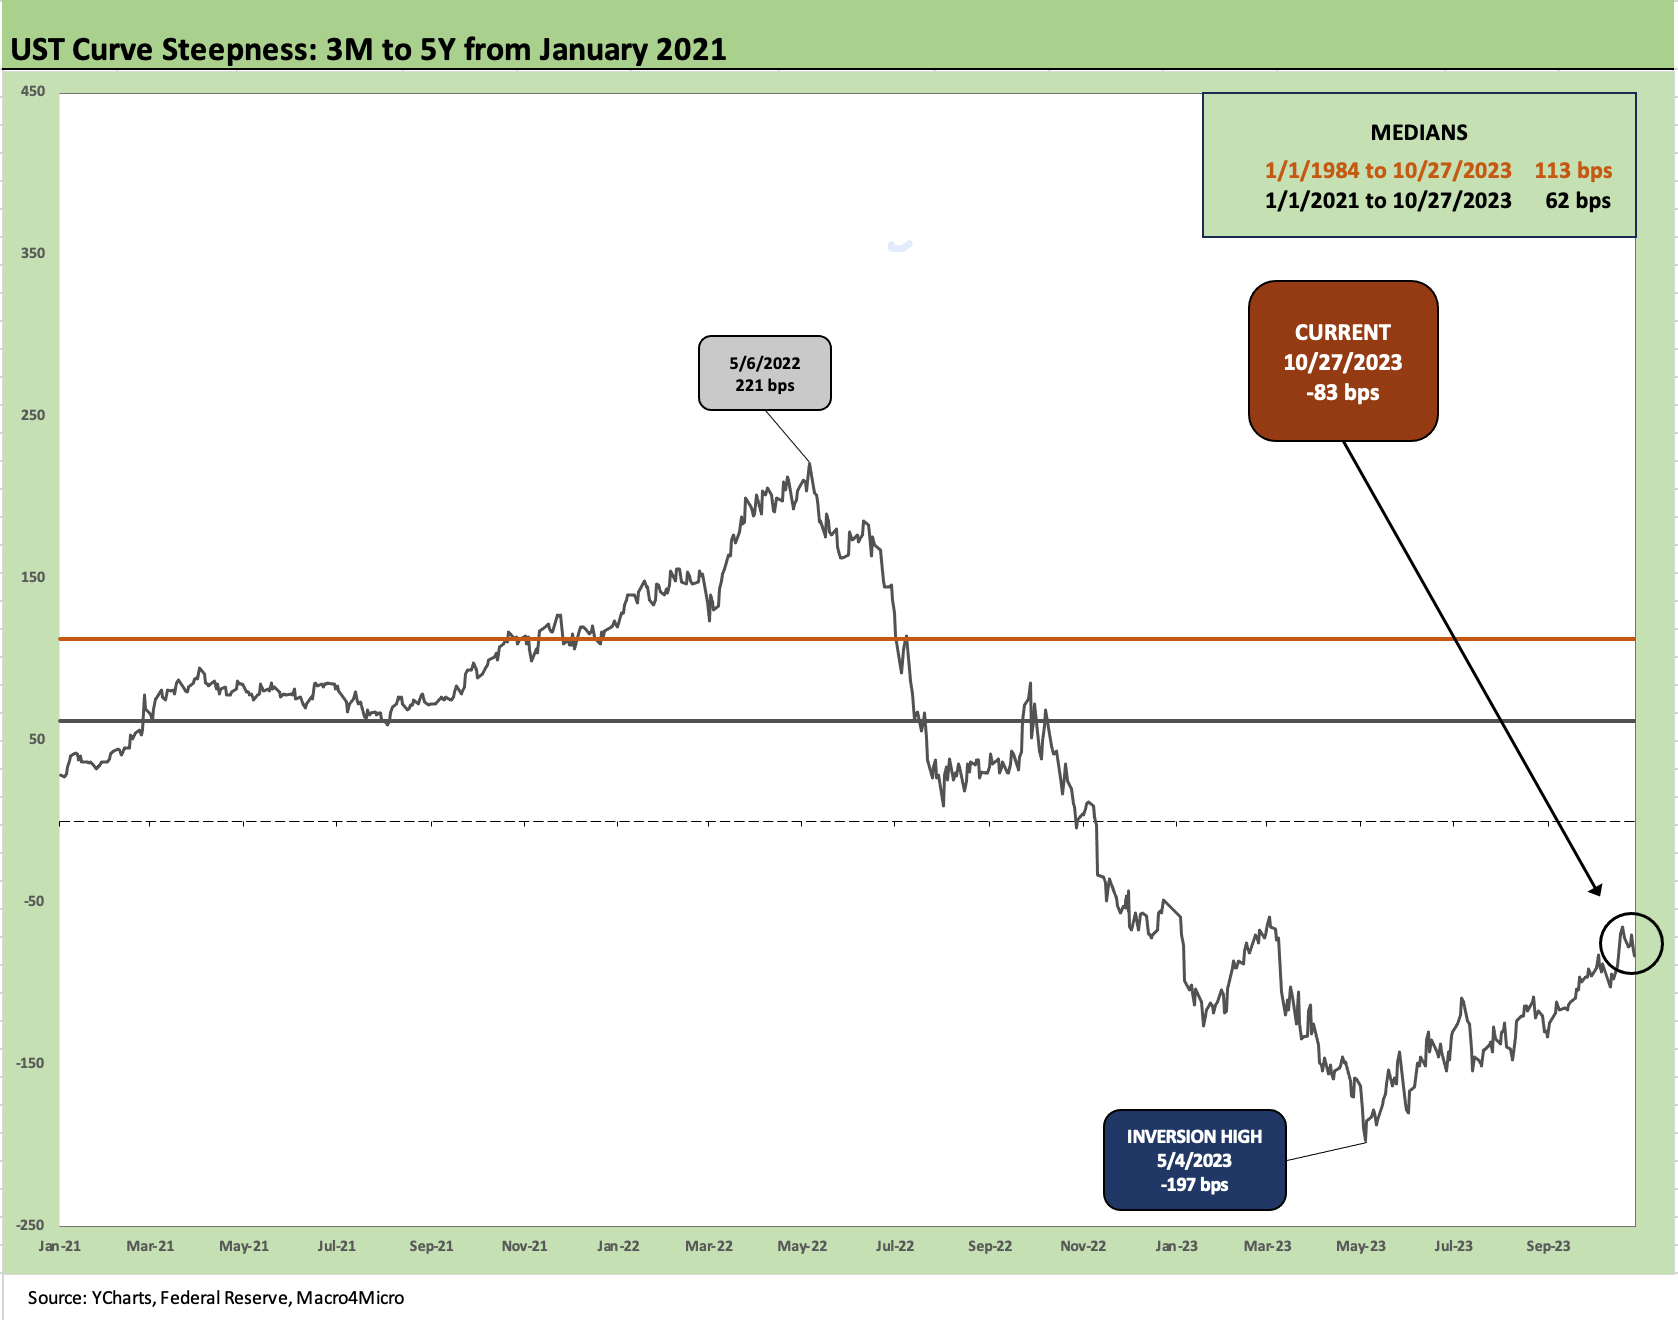
We pick a few UST slope segments to update each week, and this week we update the 3M to 5Y UST. We see the inversion still very much in place at -83 bps. That is well in from the wides of -197 bps back in May 2023.
We have looked at this one routinely since last year (see The Cash Question: 3M-5Y Yield and Slope 10-19-22). We have had a hard time (including for my personal portfolio) to make a case to extend rather than overweight on 3M UST with such an inversion and sustained constructive economic fundamentals that extend down into many HY issuers.
“Pushing buttons” to move out of cash and into bonds is not a time-consuming exercise with 5% handles and locking in 5% area yields holds some attraction to the extent you are currently underweight duration (not an option for the asset class constrained).
The decisions around what a normal slope would look like can be seen in the median box for the period since 2021 and long-term from 1984. Even getting back to flat would mean duration pain if the front end if anchored. Reaching down the credit tiers requires attractive spreads, and those spreads are not there either and are still below long-term medians.
The asset class constrained need to operate in the market they face, and a logical strategy is defensive overall in credit and being very selective down the food chain. That is what the seasoned HY players know how to do. The waiting game in this market is for quality spreads to widen from the low end and reverberate upward. That seems to be getting started (see Quality Spread Trends: Treacherous Path, Watch Your Footing 10-25-23) and we saw more CCC widening this week. We are not yet in the pricing zone of a sell-off and that takes patience.
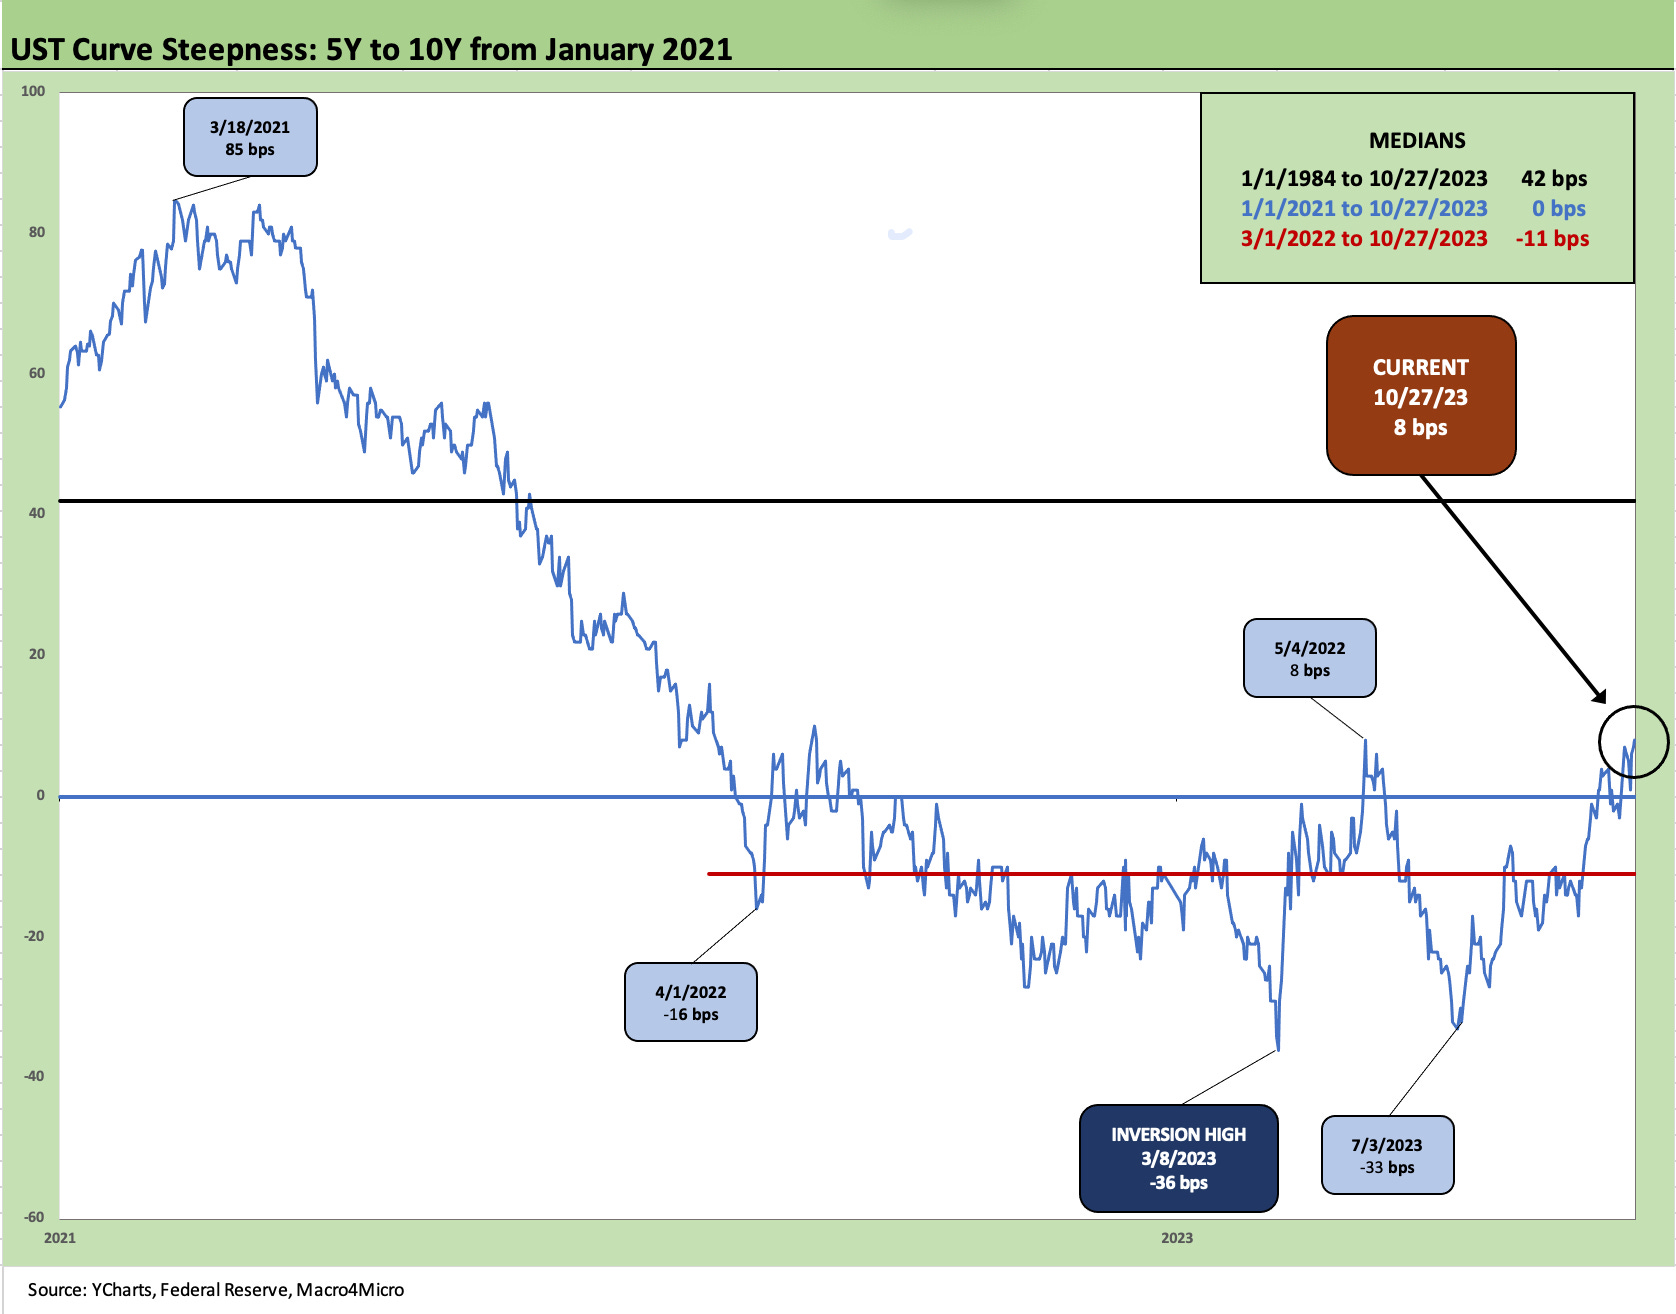
The above chart frames the 5Y to 10Y UST as it has now broken back into upward sloping at +8 bps after being at -33 bps in July. The long-term median for 5Y to 10Y UST slope from 1984 is +42 bps while the median from the start of 2021 is zero – or flat. The median since March 2022 when ZIRP ended is -11 bps.
If you are worried about duration risk in a higher for longer market, you are watching that 42 bps “normal” slope. If you believe this steepening party (not a fun party for bondholders) comes to an end with lower inflation and a fade in employment, you see room for the market to start discounting in higher recession risk. Then the duration opportunities are greater and credit spreads will be wider.
Last year around this time, we had been more oriented toward a soft-landing scenario, but we view that ill-defined term as not precluding recession risk. We saw that outcome as more akin to the 2001 style “recession” with weak fixed asset investment but resilient PCE. As it stands now, there is room for job losses after such a heady period without that being the pitch into a hard landing.
We also see room for a leveling off of what has been a very strong growth period in nonresidential construction even with residential fading from peaks but sustaining a reasonable level of activity that might stay in low growth or flat into next building season.
Credit contraction is a risk, but the menu of alternatives is subject to more repricing and structural tweaking to sustain demand for a growing mix of credit assets. In other words, a triple digit widening in HY off a higher curve can do wonders for demand and an asset allocation shift.
The last time the economy had a soft landing (by our definition) in 2001, the market was plagued by some of the worst underwriting in the brief history of HY thanks to the TMT boom and too many banks entering the space in the 1990s and chasing deals.
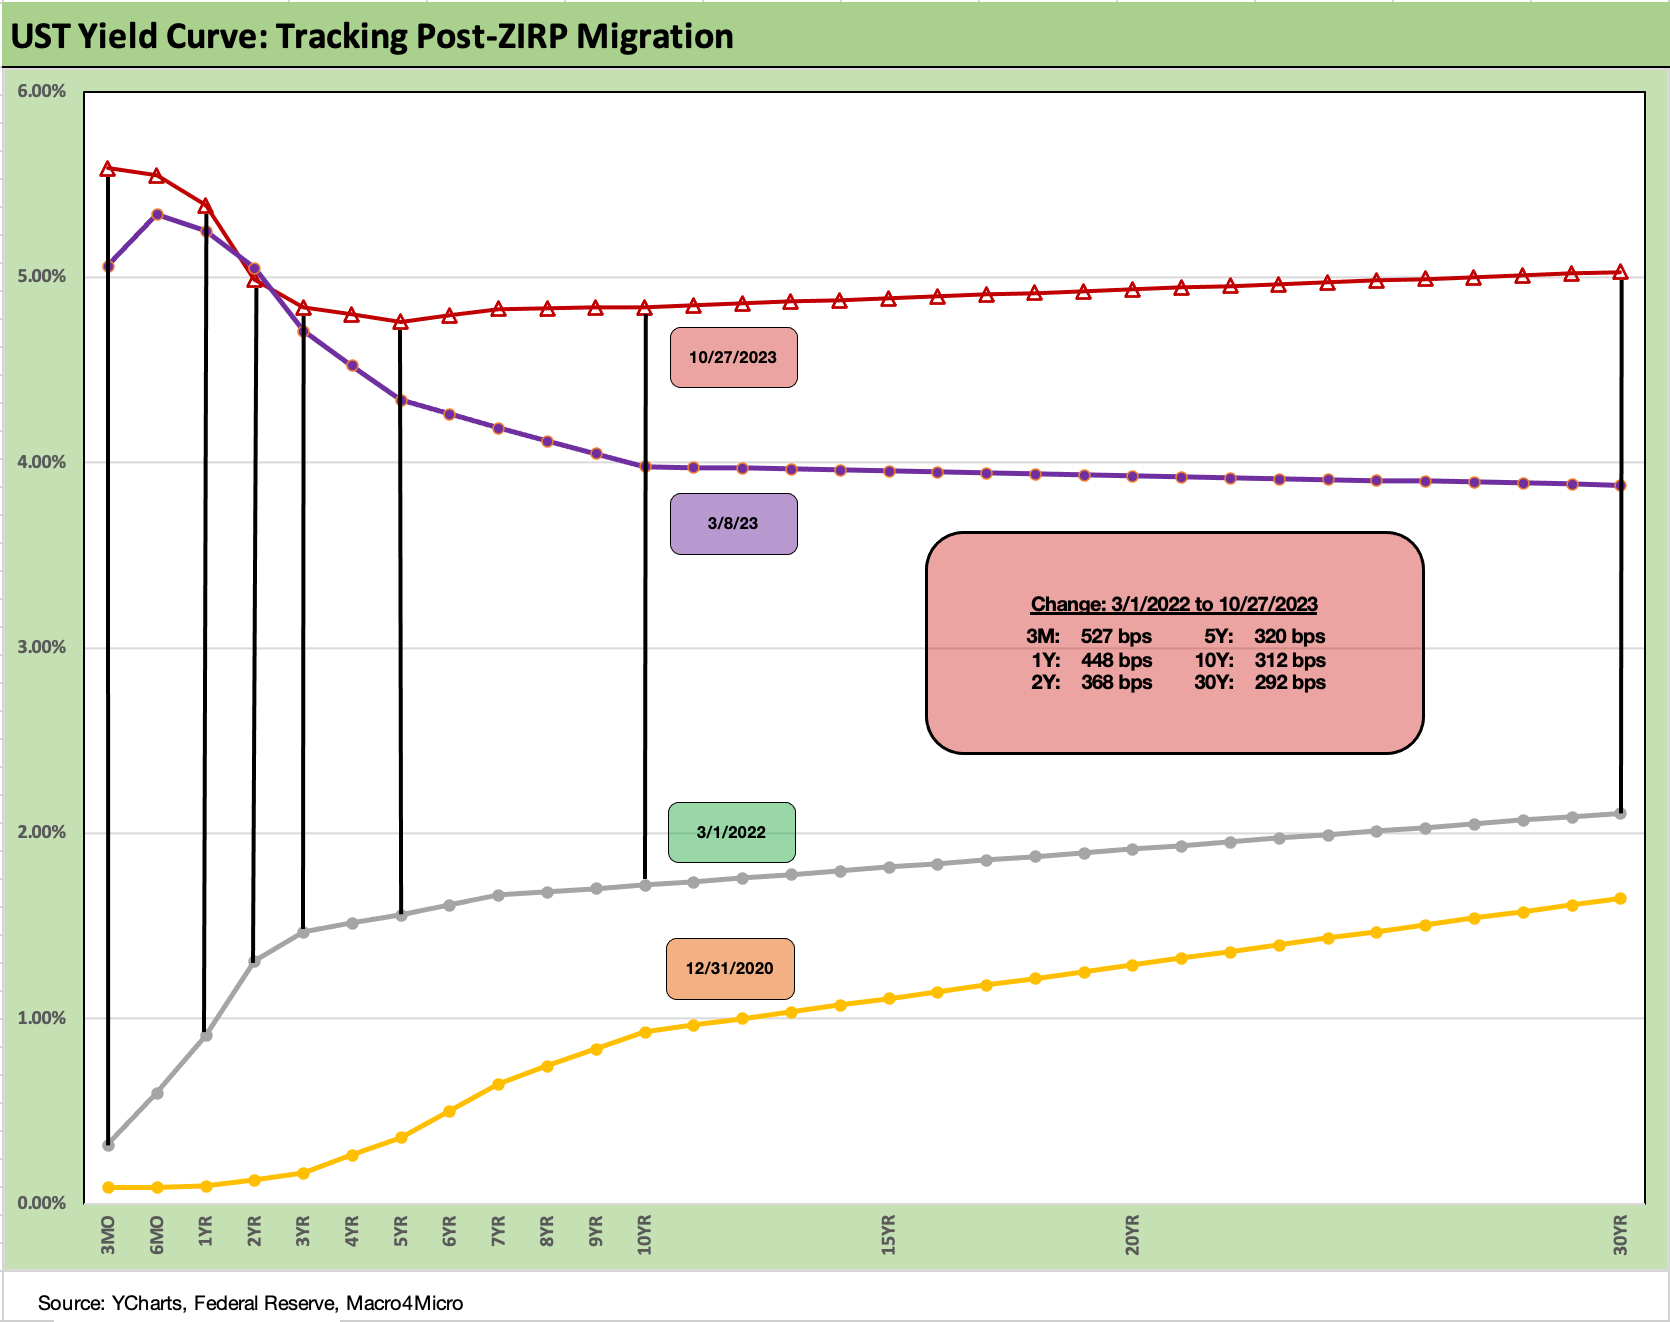
We wrap this week’s State of Yields with the usual chart showing the migration from March 2022 with the UST curve deltas in the box. We also present a 12-31-20 UST curve for a frame of reference shortly after the vaccines were rolled out.
I have had some people say to me that this is the most challenging market to grasp in 40 years. The inflation and tightening cycle by itself takes us back over four decades, but these markets are all at record size and growing if we frame UST, Equities, and Credit as the main buckets.
Within credit itself, the variety and the ability to mix risk (floating vs. fixed, high quality vs. speculative, secured vs. deeply subordinated, etc.) is unprecedented. The US has never seen such systemic government debt risk in the modern era and never experienced such a state of dysfunction from election challenges to near UST defaults. The “new genus” sprouting in Washington is hopefully a branch of the devolutionary tree that catches a serious blight.