
PCE Sept 2023: Consumption Strong, Inflation Steady
We look at PCE inflation set against another strong consumer month.


After the banner 3Q23 GDP numbers and 4.0% PCE line, this month might be a rare one where investors focused more on the outlays than the inflation in the monthly PCE release.
The headline PCE inflation rate of 3.4% was flat with the past 3 months (above June’s 3.2% but well below May’s 4.0%) while Core PCE Inflation was 3.7% for a small downtick (from 3.8% in August) and well below the 4.7% Core PCE in May.
The personal savings rate was getting the most debate time on the morning financial channels, and the 3.4% savings rate is a metric that is chosen to support a bear’s theme of “this party has to end.”
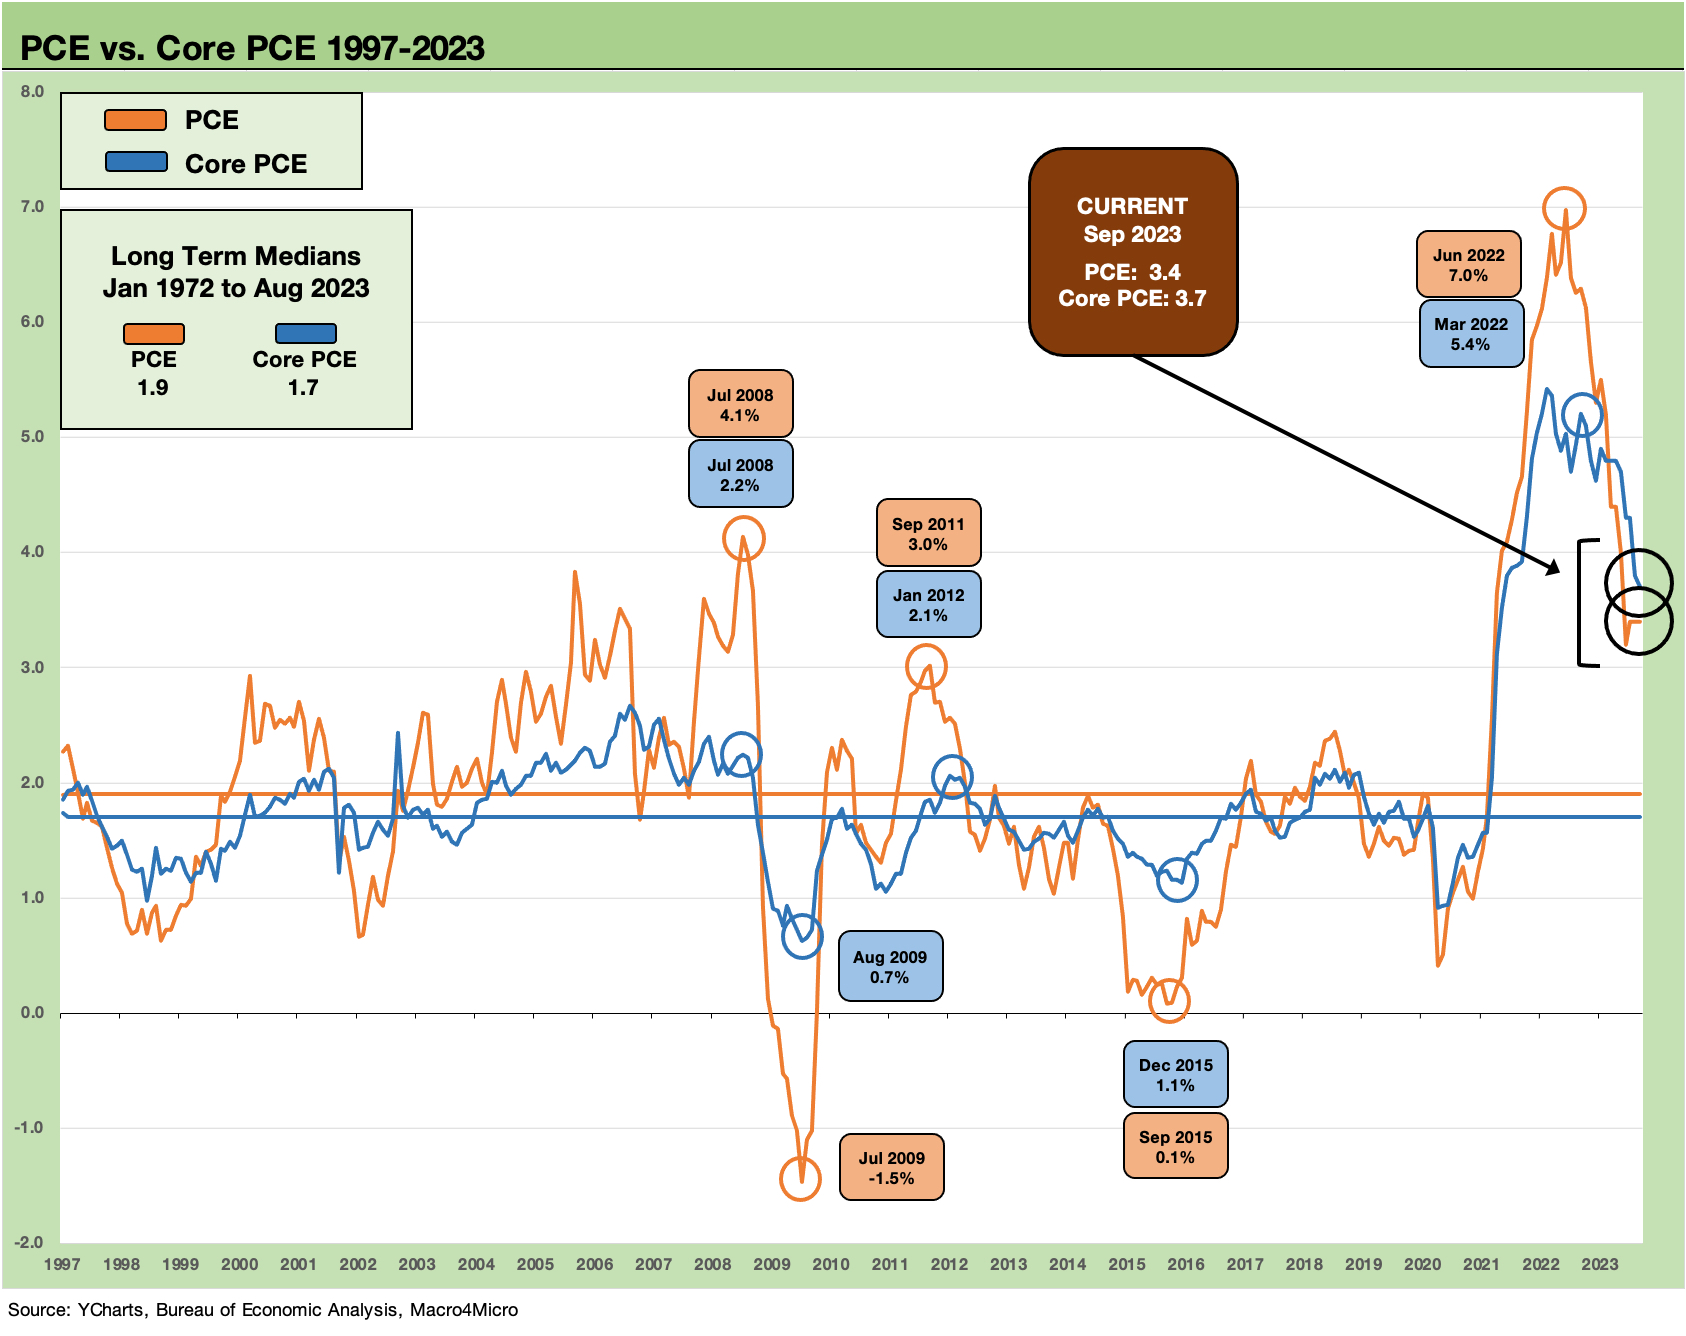
We plot the post-1997 time series for the PCE Price Inflation above along with the Core PCE data. The time horizon medians below 2% offer a clear reminder that we are still facing inflation headwinds. The Fed did not pick the 2% number out of a hat even if some market watchers can reasonably disagree whether that should be the number as the structure of the economy goes through secular change. The 2% line is empirically supported by history in this chart. If we look at longer term time horizons back to the period before the 1970s inflation spikes, then maybe 2.0% is a bit of a hardline goal.
The monthly PCE inflation drill gets a lot of attention as the Fed’s preferred inflation metric and thus is the main event in FOMC tea leaf reading. Depending on which Fed article you read over the years, the 2.0% target is either headline PCE or Core PCE (I have literally read both versions inked by FOMC members). For arguments sake, let’s pick the Core PCE. That means the current 3.7% is a long way off from 2.0%. It is not as far off from 3.4% but far enough to make easing unlikely.
In CPI (vs. PCE), you can play with the adjusted numbers ex-Shelter and get down to a low inflation metric pretty easily (see September CPI: Big 5 Buckets and Add-Ons 10-12-23). With PCE ruling the FOMC meeting agendas, it is fair to say that there is not much reason to think easing will happen any time soon.
Even with high interest rates on credit, declining affordability in many households across so many products, and a consumption basket that had repriced materially higher after 2021-2023, the PCE party continues. That is what the Fed and the markets see.
The outlay numbers in the Sept PCE release this month together with the 3Q23 GDP PCE data are telling a story about a high propensity to consume. The 3Q23 GDP release and today’s PCE release affirm that the consumer keeps doing just that – consuming and spending. That is another factor that tells the Fed that assumptions on household behavior are taking much longer to adjust.
It is hard to have a recession without negative PCE. Alternatively, it takes a major collapse of fixed investment numbers to get there, and we have not seen that either. We have even seen a sequential firming of investment since COVID on the mega projects and nonresidential spending breadth (see Construction: Project Economics Drive Nonresidential 10-2-23).
Savings? Not lately…
The personal savings rate disclosed with each PCE monthly just got more serious as it dipped below the 4% line to 3.4%. Personal savings as a % of personal disposable income was above 5% in the spring of 2023 and it kept trending lower to where we stand now. As we detailed in the 3Q23 GDP commentary, the hefty trend line in Goods (+4.8%) and in Durables (+7.6%) told a story of an unflappable consumer who apparently has high confidence in sustained employment. Either that, consumers are at the casino betting on sustainable household income growth. This is apparently working for the UAW!
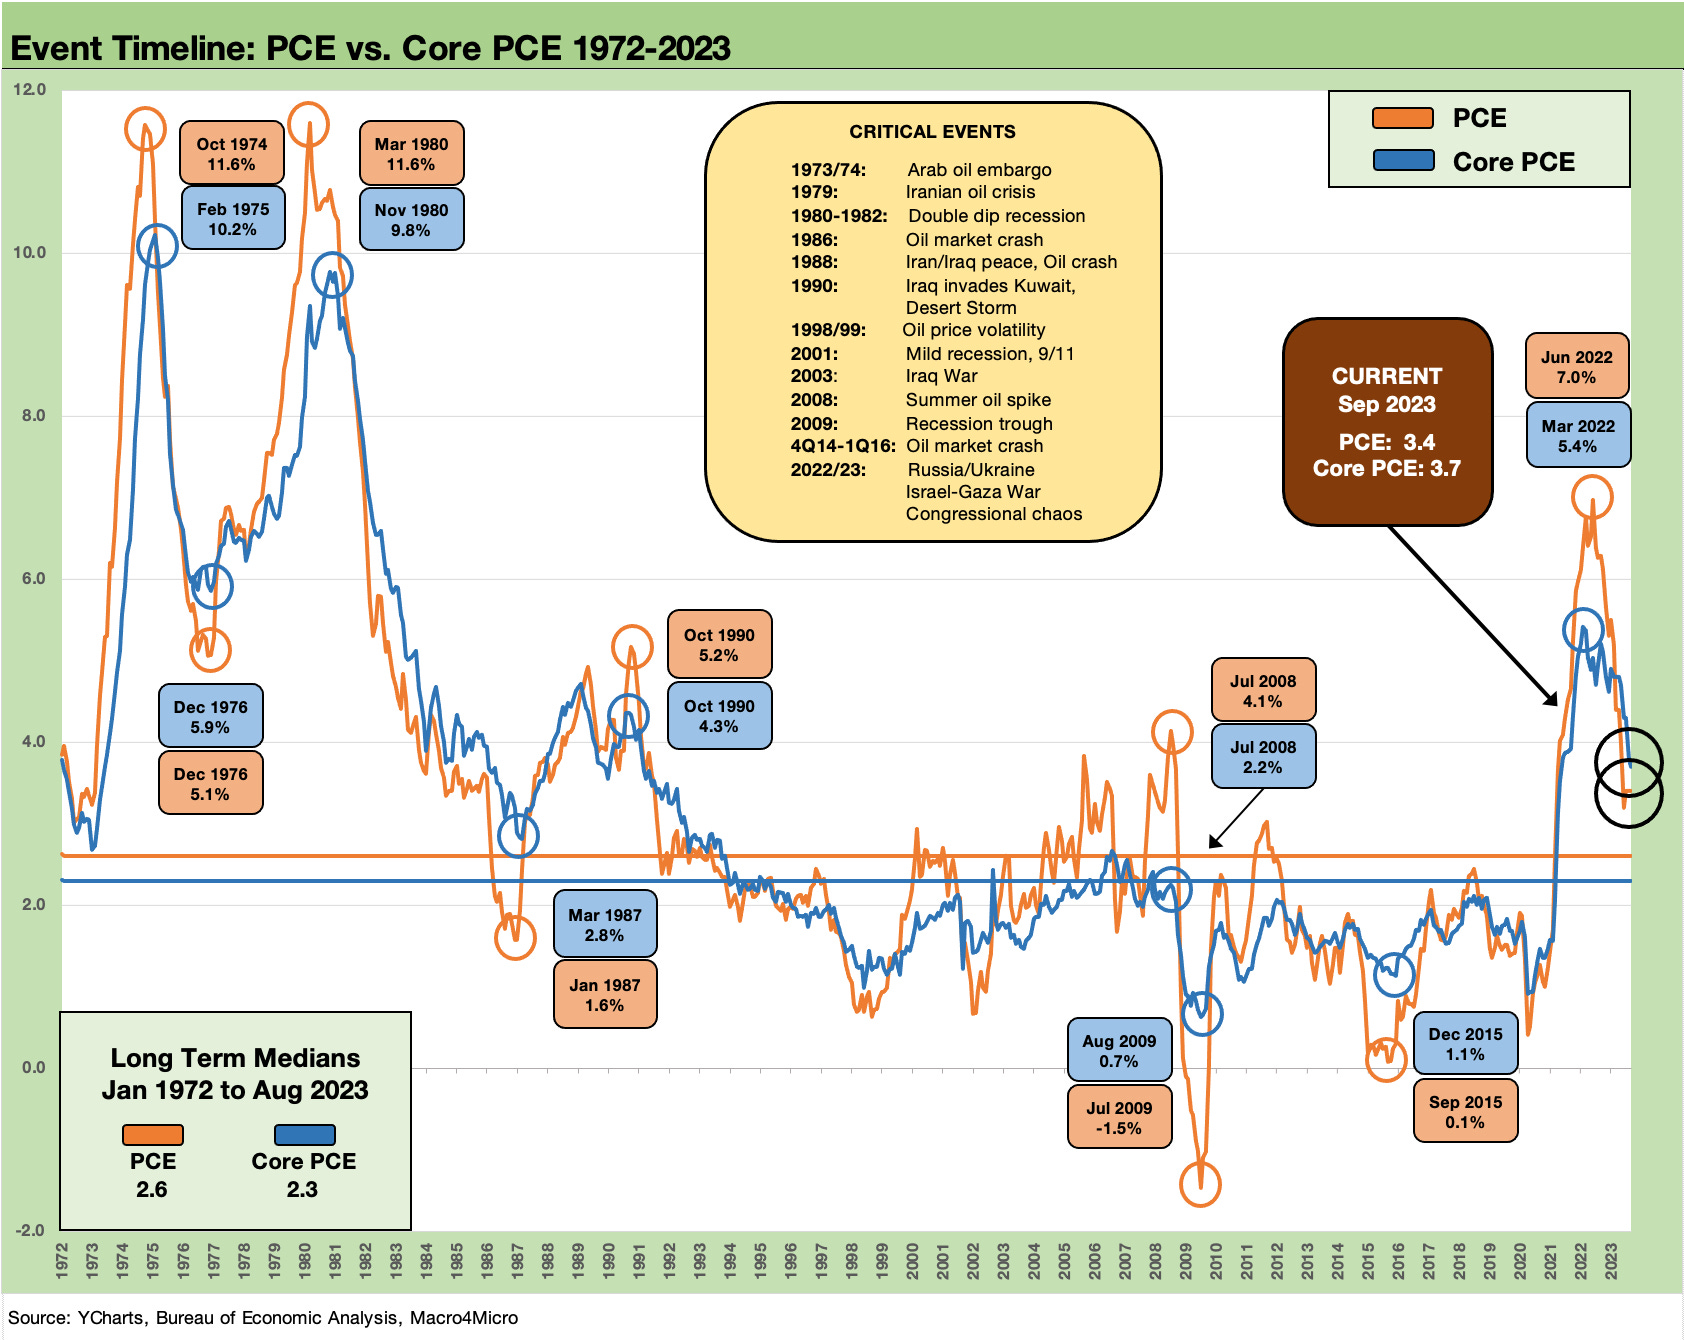
The above chart shows the much longer timeline for PCE inflation from the early 1970s that drops in the ugly 1970s and early 1980s numbers. This time series supports the pushback to the 2% target and asks the question “Why not 3%? 2.5%”?
The chart also includes some event timelines noted in the box across what has been a very busy world across wars, oil shocks, systemic shocks, and both deep and shallow recessions. The medians are 2.6% for headline PCE and 2.3% for Core PCE.
The periods in the event box include political disarray, impeachment threats, wars, geopolitical tension and militarism in Asia, Middle East conflicts between Israel and bordering nations, bank system stress, wild swings in inflation and unemployment, potential war between the US and Iran… and that was before 1980! Sound familiar?
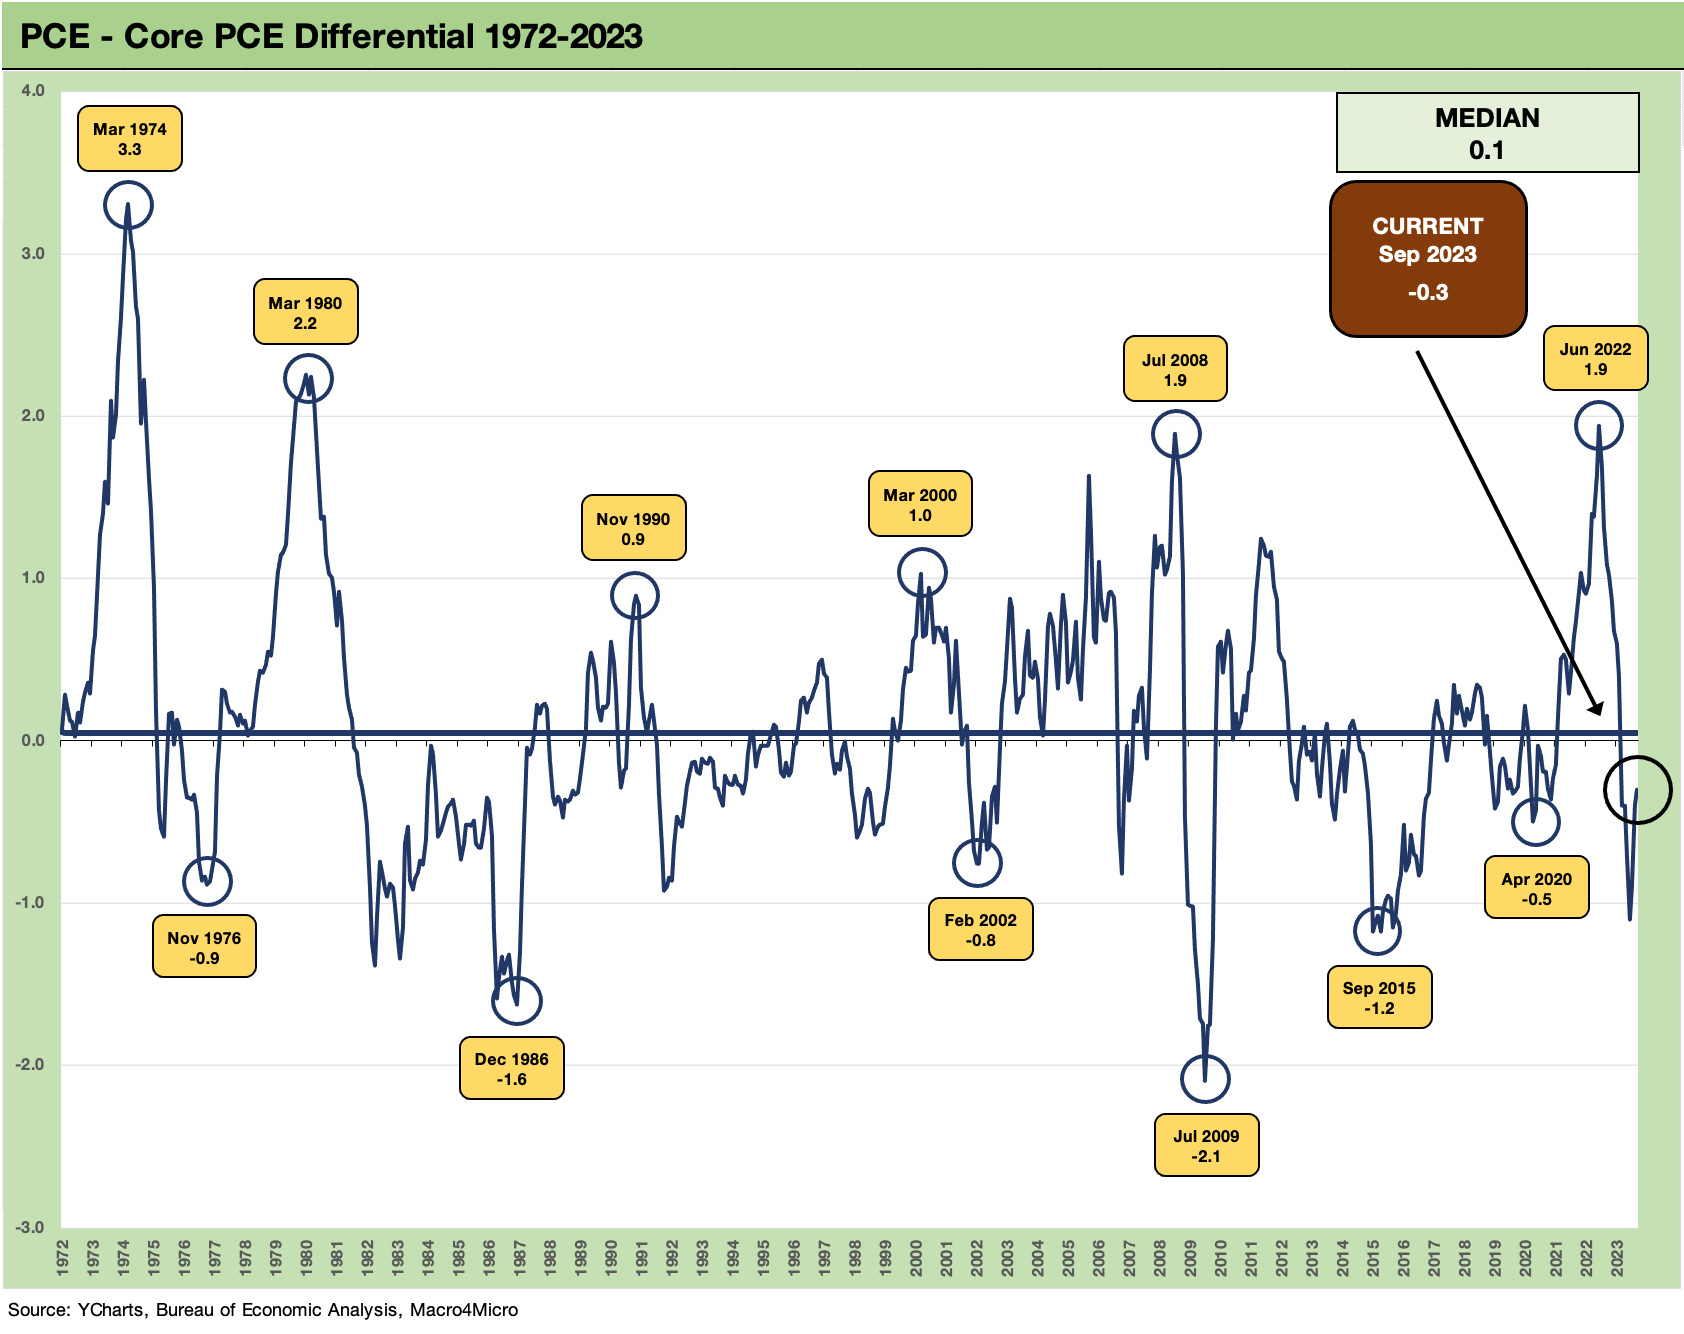
The above chart updates the PCE vs. Core PCE long term differential. Energy and Food alike have some big dislocations. The early 1980s had some extreme food inflation right alongside oil and gas. We see the distortions generated by oil along the way in headline PCE vs. Core. The 1974 oil embargo led to gas rationing and long lines at gas stations (I had some “colleagues” in those years who became adept with the use of siphoning tubes…not me though. Promise.). Those were strange times.
The oil spikes and refined product supply-demand crisis of 1979-1981 was another one. Nov 1990 was the lead-in to the Gulf War. On the back of OPEC jawboning, March 2000 saw oil rise above $30 for the first time since 1990. July 2008 saw $145 WTI in the US. Russia-Ukraine drove June 2022.
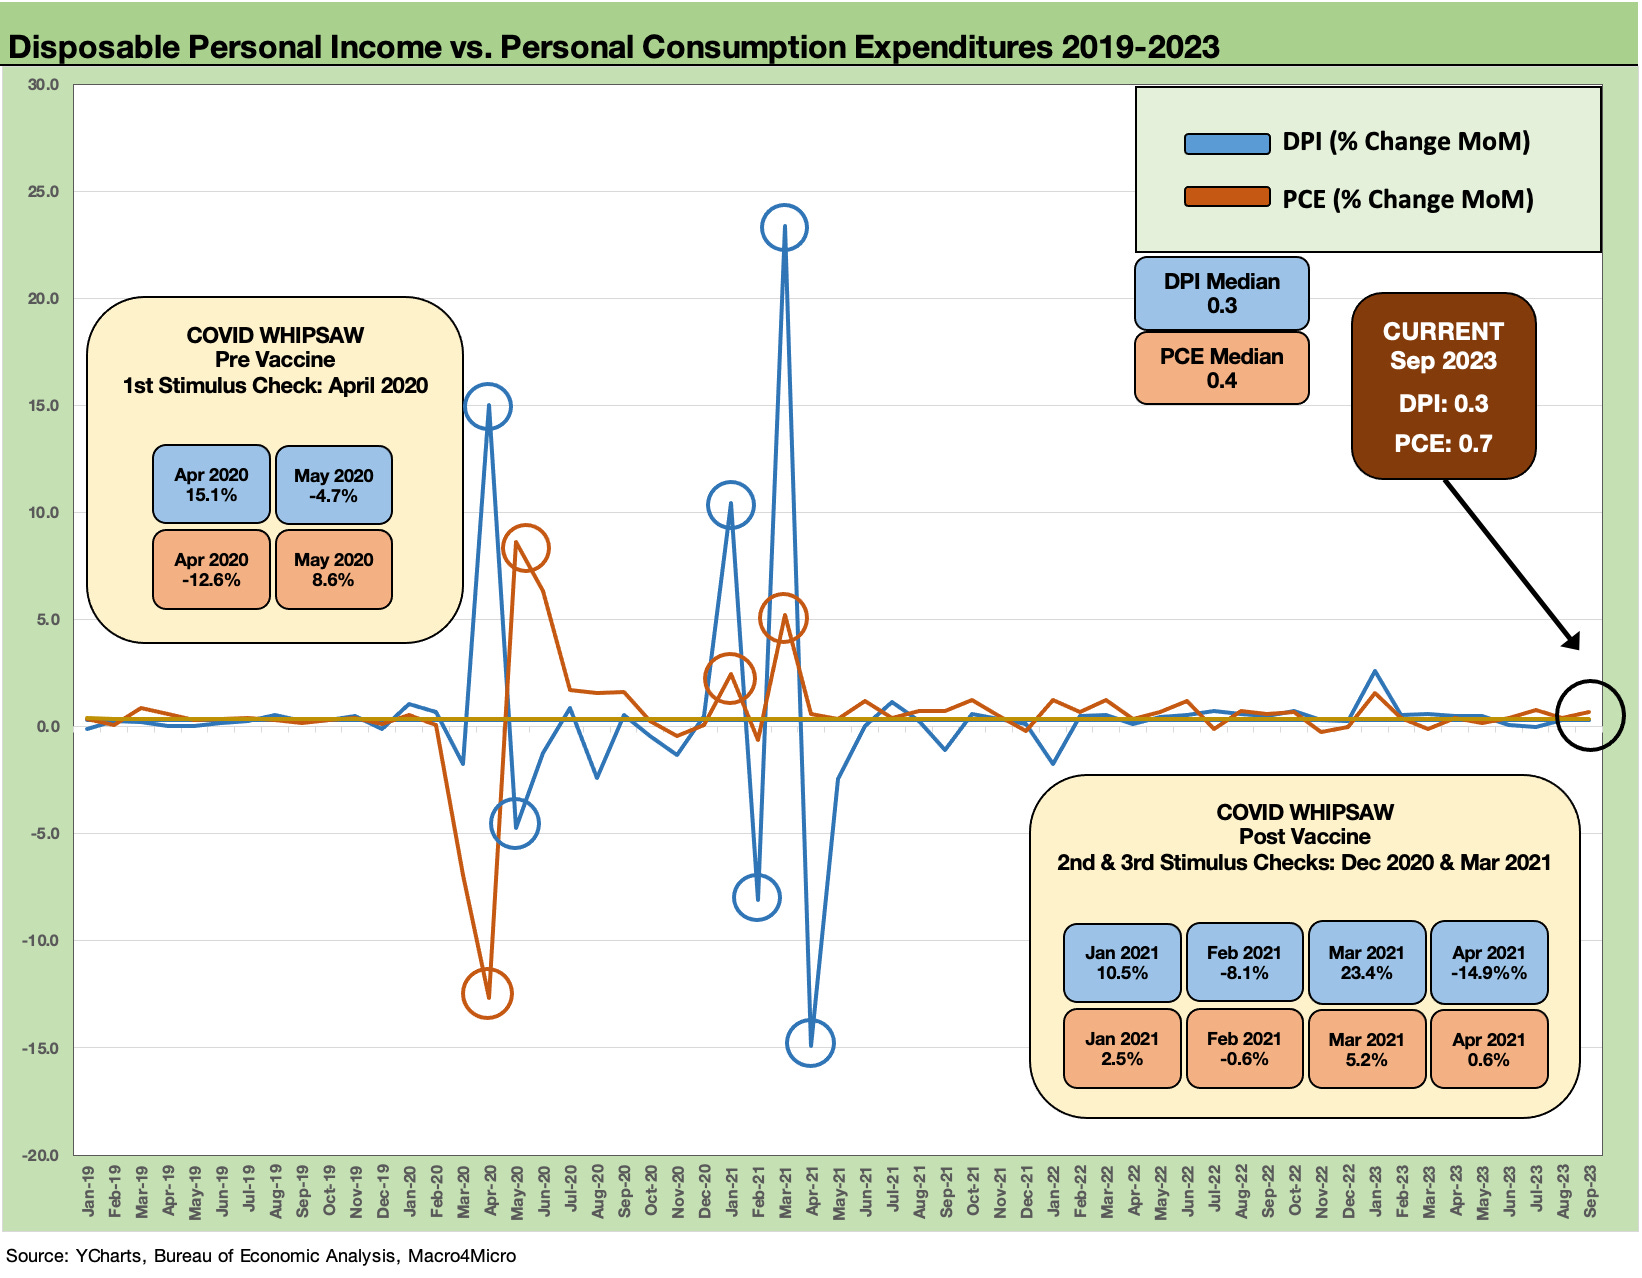
The above chart shows the Disposable Personal Income (DPI) trends vs. Personal Consumption Expenditures (PCE) using MoM data from 2019 and a pre-COVID starting point. Economists and policy wonks are still trying to figure out how to frame the efficacy of the policy actions by Trump and then again by Biden in the immediate aftermath.
We had drilled down into this period in an earlier piece, but the topic is so colored by politics and which constituencies were served (or not served) sent this period into economic analysis limbo. Overall, the postmortem on the legislation was just a politics game.
Many parties benefited from both stimulus/relief programs, but both were partisan actions that fueled recovery and demand. Demand in the face of supplier chain problems fuels inflation. Supply and demand forces work that way. Supplier chains tied into Covid and the related fallout. The GOP was not loading the containers and the Democrats not sinking the ships. In the end, it was all stimulus with different underlying ideological drivers.
There were at least three shifts of stimulus with the last one being the middle finger from the Democrats to the GOP on items in Stimulus #3 that they could not get included in Stimulus #2. Many of these programs were continuing in their effects across time and not one-off moments to “go shopping”.
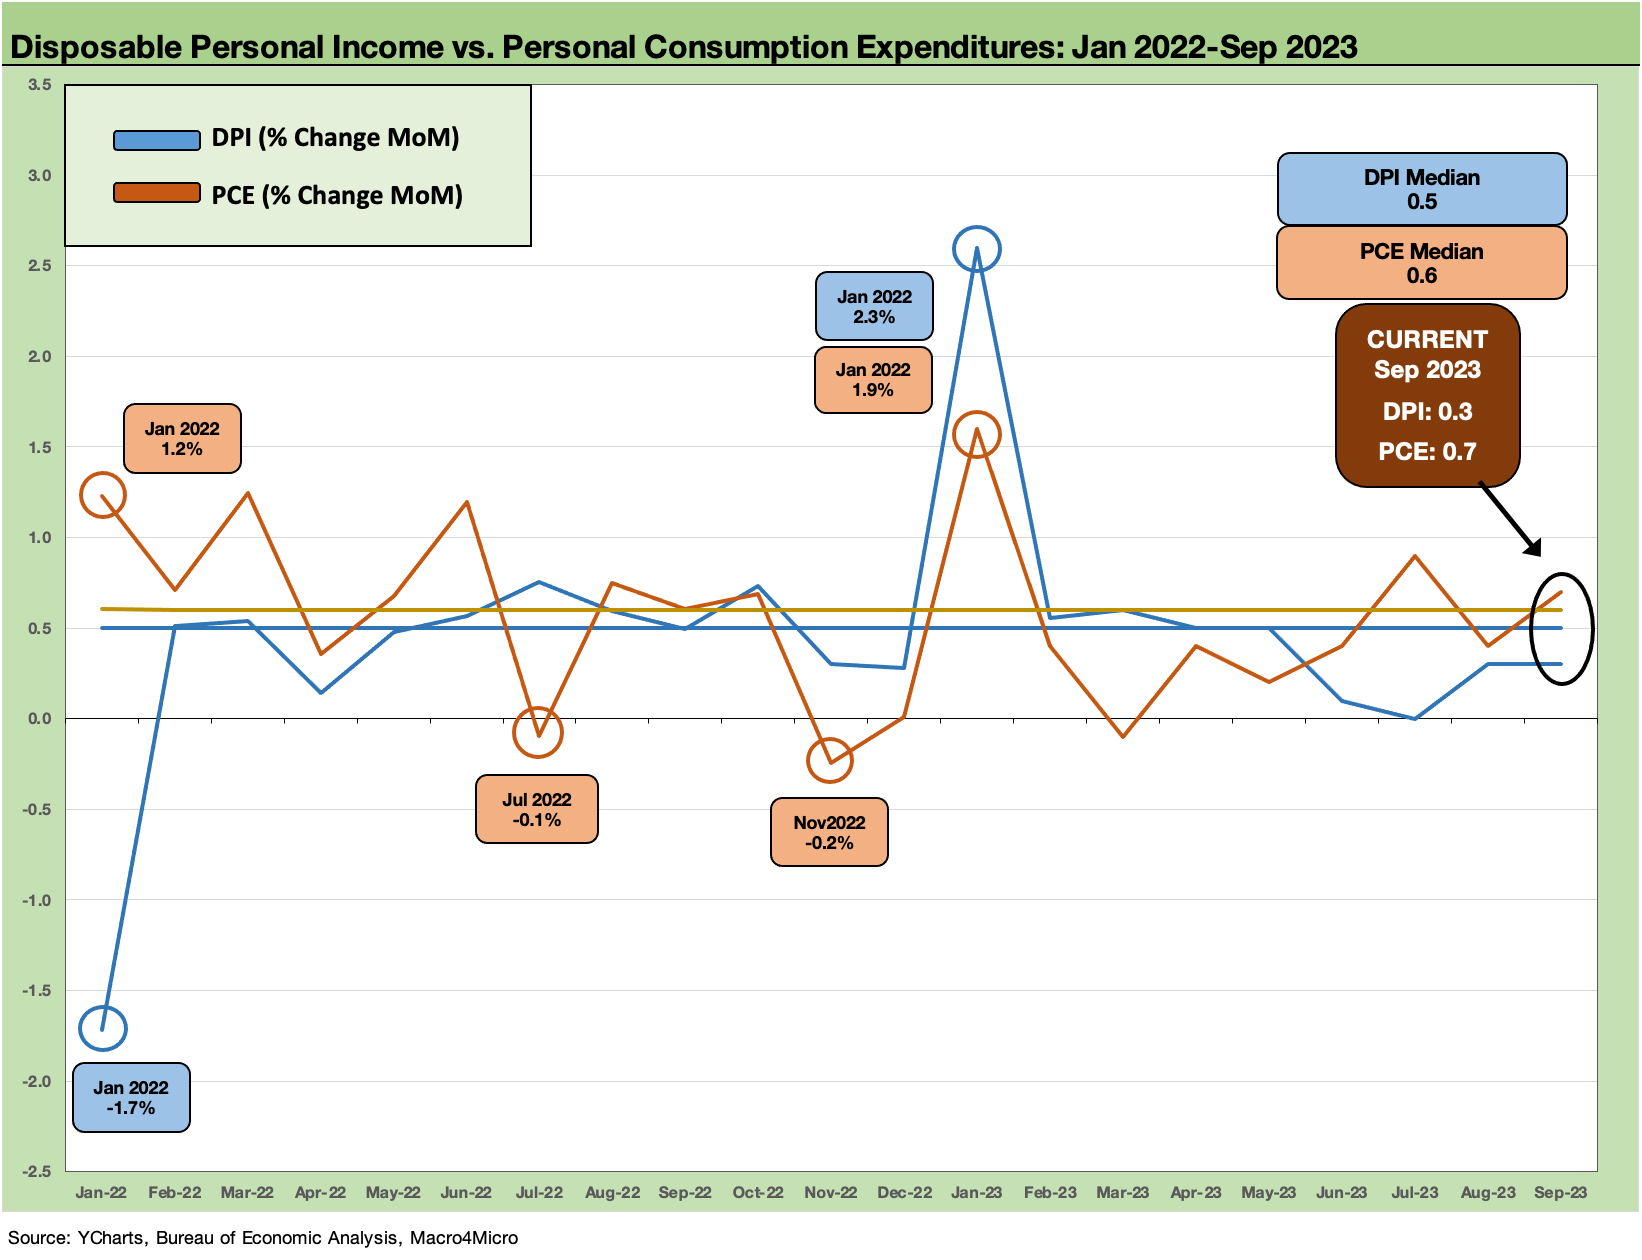
The chart above zeroes in on a narrow time frame from the start of Jan 2022 as inflation ramped up and ZIRP ended in March 2022. The stimulus and relief debates will never end, but the above chart at least offers some objective data on what happened in DPI and PCE as the tightening cycle unfolded to deal with an inflation spike.
The table in the next section tells a MoM timeline story for DPI vs. PCE that offers food for thought on how resilient PCE has proven to be across some volatile times. To us, jobs are always the critical swing factor, and employment trends have defied the odds with continued record payroll counts (see Jobs ‘R’ Us: The Perils of Plenty by Occupation 10-6-23).
The idea that you don’t bet against the US consumer is an old one. You also have a hard time figuring out exactly when that consumer will blow up the credit card line and start the descent into spikes in delinquencies and charge-offs. That is followed by more aggressive tightening by lenders, who are still making very high margins in absolute terms despite some margin squeeze. The balancing act is tricky until outright credit contraction kicks in.

The above table frames the monthly historical for the DPI vs. PCE comparison as a reference. When things get testy is when debates kick up over who caused inflation. Many simply tend to read off the usual partisan talking points even if anyone serious knows the inflation story is exceptionally complex and cuts across a lot of variables.
The “Biden did it” school of inflation blame game (with the Butler as his accomplice, he did with a candlestick in the dining room, etc.) is not new (Carter was crushed by it in 1979-1980). For political purposes, inflation was one very juicy topic to launch into with plunging unemployment and superior GDP growth in 2021 messing up the partisan game plan.
We looked at some of those topics in an earlier piece (see Inflation Rorschach Test: Looking at Relief and Stimulus 2-7-23), so we will not revisit all that here. DPI (that includes stimulus/relief payments) vs. PCE can be logically reviewed with the simple finger scroll across the lines. Finding the smoking gun to 9% handle CPI by mid-2022 is not so easy coming off a massive dislocation of supply and demand and supplier chain meltdowns.
One can say that anything that drives demand contributes to inflation. Nixon and Ford tried wage-price controls as well. So, the world is not new to grasping at straws in an attempt to deny to laws of supply and demand (including pent-up demand).
The flip side of demand is that anything that allows COVID to destroy households and drive PCE lower can also feed into a downward employment spiral and recession. “Let the market work” does not always work as Herbert Hoover discovered after 1929 and the world would have in 2008-2009 if the Fed and UST and legislation did not intervene in the credit crisis. That is a different debate for a different day.