
Footnotes & Flashbacks: State of Yields 10-7-23
We look at a volatile week for the yield curve as the weekend now brings us a major geopolitical event.


A wild week of yield curve gyrations pulls the term structure of interest rates back onto the front burner with solid jobs numbers driving a fresh dose of UST volatility and rattling the equity markets in a two-day whipsaw to end the week and pushing HY spreads wider.
We update UST deltas and the 3M-5Y and 2Y-10Y slope details as we also see more research making the rounds on term premiums for taking duration risk.
The “ammo, canned food, and bunker” crowd is making a comeback on the fears of a systemic upward interest rate spiral and sovereign debt crisis at a time when Congress is incapacitated (that is, more than usual).
As we go to print, we add another geopolitical shock to the global picture with the Middle East events.
Some history from this weekend back to 1973…
There are some lookbacks at history that bring no nostalgia. This weekend is one of them as headlines explode with a surprise attack by Hamas in Israel that everyone saw splashed all over the news this morning. Reports of dozens of civilian and military hostages and already more than 200 Israeli dead and over a thousand injured (as we go to print) cannot be laid off as just another terrorist attack. From someone who lived across the street from the Twin Towers on 9/11, the sense here is that the outrage will be mirrored in the US and on a bipartisan basis.
Biden immediately jumped into the headlines with an appearance on TV to promise the support of the US. Israeli Prime Minister Benjamin Netanyahu thanked President Biden for his support, and Netanyahu indicated that a “prolonged and powerful campaign would be required in which Israel would win.”
The terms “prolonged and powerful” were chosen for a reason and this one crossed a line for Israel even if it is not on the scale of 1967 or 1973. Events from here could create some stress on US ties to the Saudis and Egypt, but this is a “pick your team” moment for the US and Europe. The US picks Israel without equivocation or a clock on what “prolonged” means.
This event in Israel is one that could have some material geopolitical overtones that might even flow into better behavior in Washington, where a House leader is needed for budgets and military aid. This is also an event that at the very least brings isolationism into disrepute.
The attack comes on the 50-year anniversary of the start of the Yom Kippur War in the Middle East in Oct 1973. That saw a sequence of events that included an Arab Oil Embargo and a stagflationary spiral. Half the idiots in the US House of Representatives probably do not even know what happened in 1973 but should be getting briefs this weekend.
October 1973 was a busy month…
That 1973 stretch was a period that the word “tumultuous” does not quite capture. We looked at that period in some detail in the first commentary we posted just over one year ago in our first analytical piece on this platform. We detailed the wild events of 1965 to 2022 that had an outsized influence on the markets.
October 1973 saw ungodly amounts of action domestically and politically at that time as the great stagflation catalysts kicked into high gear (see Inflation: Events ‘R’ Us Timeline 10-6-22). The events ran the gamut. October 1973 brought the Yom Kippur War, a near clash between the US and Soviets (the scale of which only became known in more detail later with DEFCON 3 and a rumored quiet DEFCON 2 for some units), an Arab Oil Embargo, Vice President Agnew’s resignation, and the “Saturday Night Massacre” with Nixon and the Watergate scandal. During early 1973, the last “regular” US troops had exited Vietnam. That was some year.
Oct 1973 is relevant to today’s market history since it was the start of a brutal inflationary spiral and deep recession from Nov 1973 to March 1975. That recession was 16 months and was later tied with the recession of July 1981 to Nov 1982 as the longest post-Great-Depression downturn until the credit crisis of 2008-2009 saw 18 months (Dec 2007 to June 2009).
On Saturday, the Middle East turmoil saw official statements from the Saudis and Egyptians among others, and that offers another flashback to the key players in 1973. Obviously this is about more than inflation, but as a timeline reminder, we saw the Iran regional conflict escalate in 1979 and set the stage for another inflation spike, oil shock, and steep double dip downturn (see Business Cycles: The Recession Dating Game 10-10-22, Expansion Checklist: Recoveries Lined Up by Height 10-10-22.
One item of weekend discussion was on Saudi-Israel normalization. That is going to get analyzed by many. Stress with the Saudis could generate a lot of scenario-spinning as Russia looks to exploit the issue. The biggest difference now vs. 1973 (OPEC broadly) and 1979 (Iran) is that the US is the world leader in combined natural gas/liquids and oil production. From a geopolitical risk management standpoint, it would be entirely possible to turn a combined US-Canada tag team into a new dominant producer/exporter. This is not the 1970s.
The House isolationists will have some awkward moments with the Biden Administration citing unequivocal support for Israel. In addition, Pence was on the screen calling out isolationism today (Trump, DeSantis, Ramaswamy), calling them “voices of appeasement.” The latest event in Israel does in fact offer a reminder of why the US needs to be global in reach and readiness – and have allies. It is hard to be only “mostly isolationist.”
Yield curve shift keeps the heat on…
Below we turn through some of our weekly yield curve chart collection as another week of steepening and volatility. A lot of reassessments by market strategists are underway.

The above chart updates the upward migration across the tightening cycle and inflation path from the end of 2021 through this past week. The move from 1Q23 to current times is especially notable. It is a picture of pain for duration.
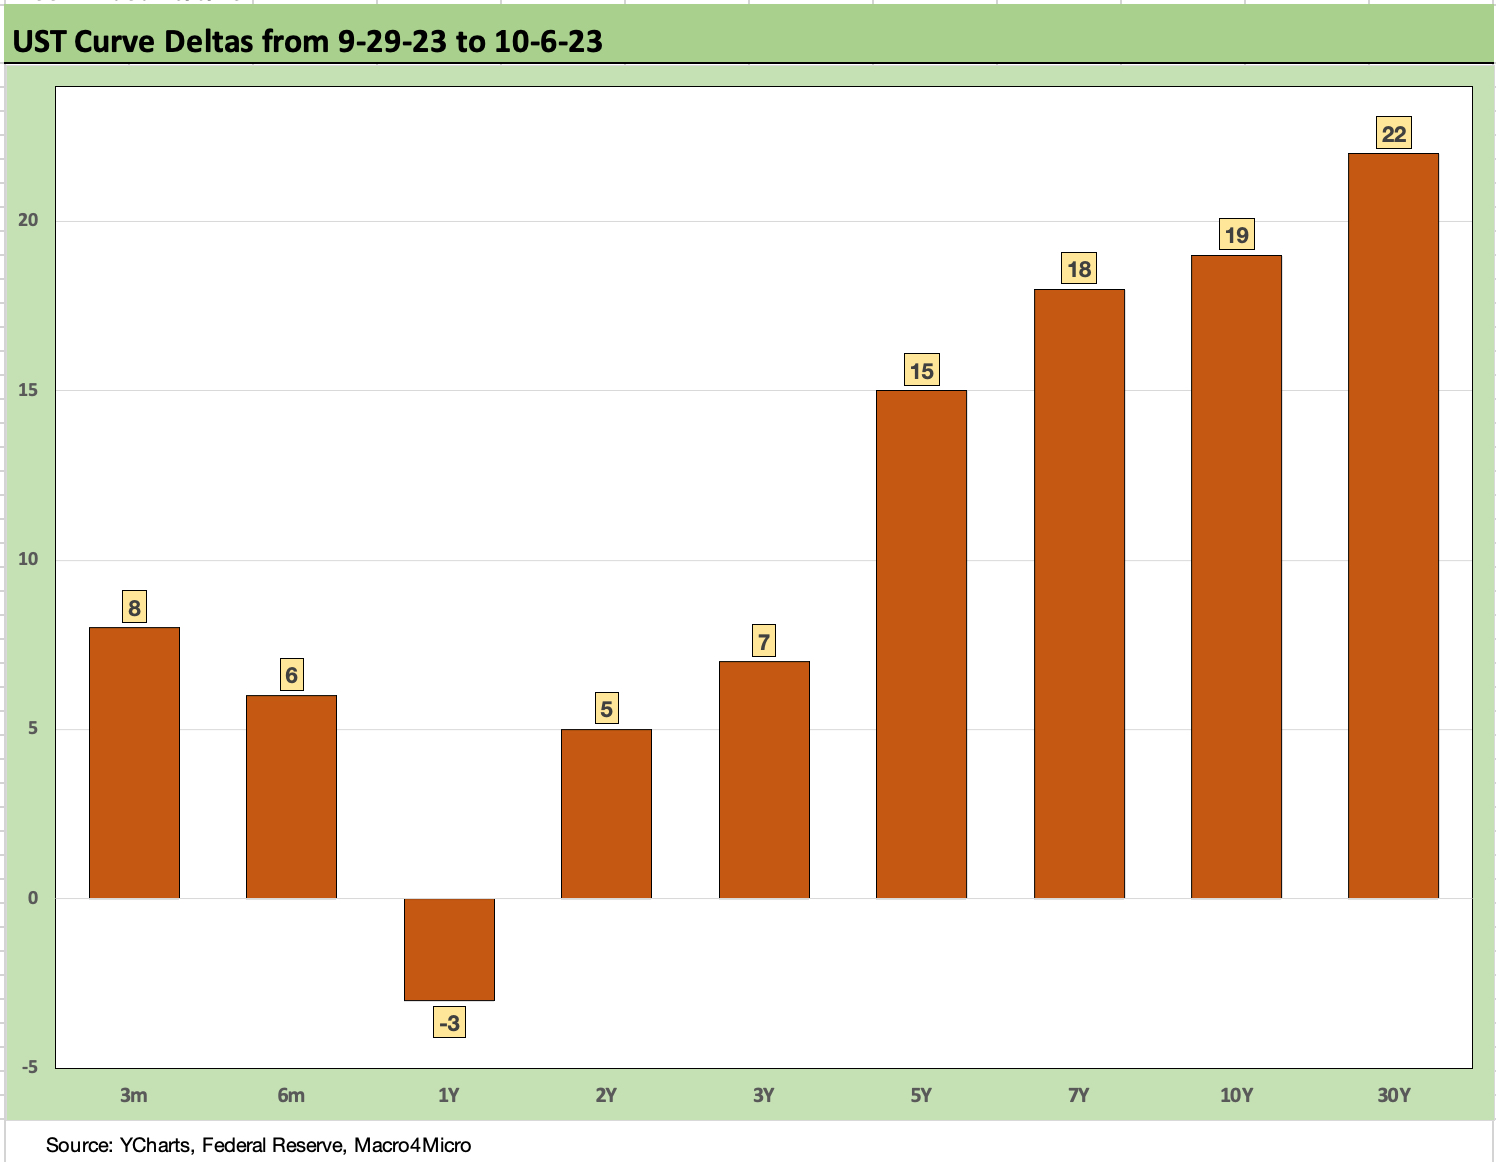
The above chart updates the UST deltas across the UST curve. We see another upward shift and steepening this week following several weeks of turmoil in the fixed income markets (see Footnotes & Flashbacks: State of Yields 10-1-23).
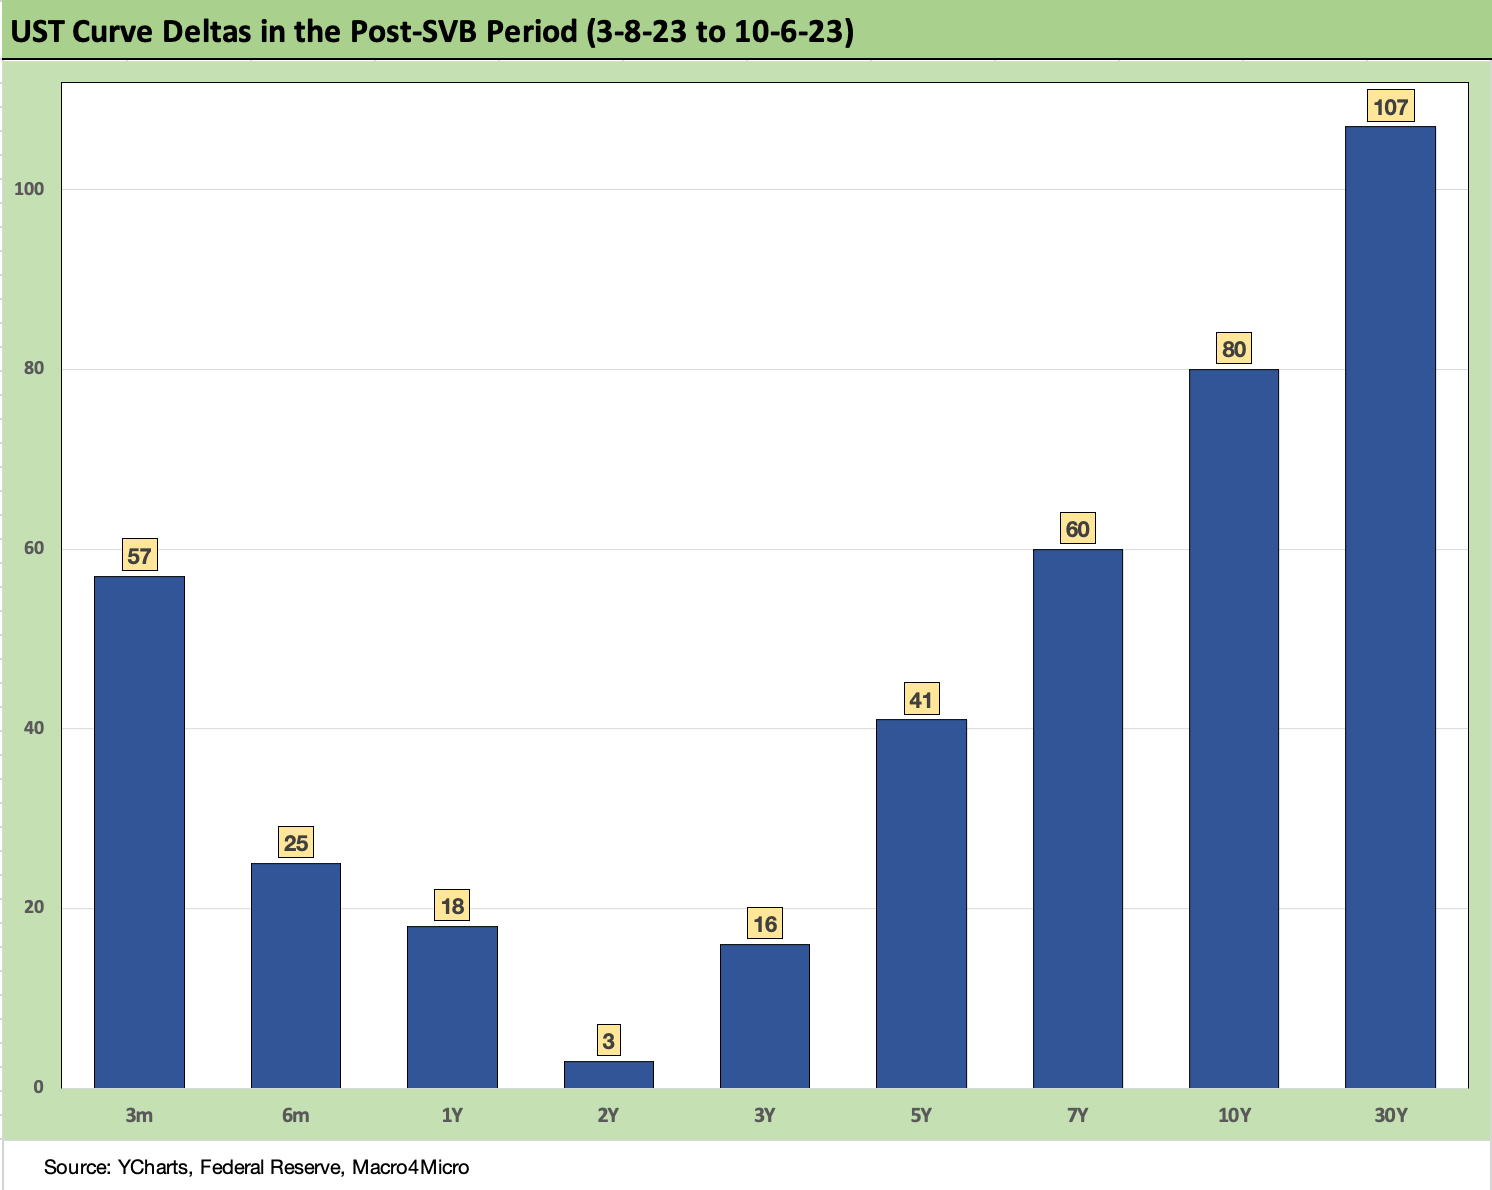
The above chart updates the post-SVB (Silicon Valley Bank) timeline for UST deltas. This one is a bit more dramatic in the steepening. With an initial rally after the regional bank mini-crisis took over the market’s risk handicapping on bank health and credit contraction risk, the world has settle back into worries around the Fed and the natural shape of what a UST curve should look like for term premiums and a potential return even to just flat. Getting back to flat requires sustained steepening and upward moves in longer UST beyond the 2Y UST.
The reminder in the above chart is that we already had one bout of asset liability mismatch headaches for banks with unrealized losses on the checklist. Those unrealized losses will be pretty daunting again as 3Q23 earnings get reported. Then everyone will point out that the unrealized losses just climbed again since the 3Q23 balance sheet date. What the market does not need is another one of those push-button bank runs.
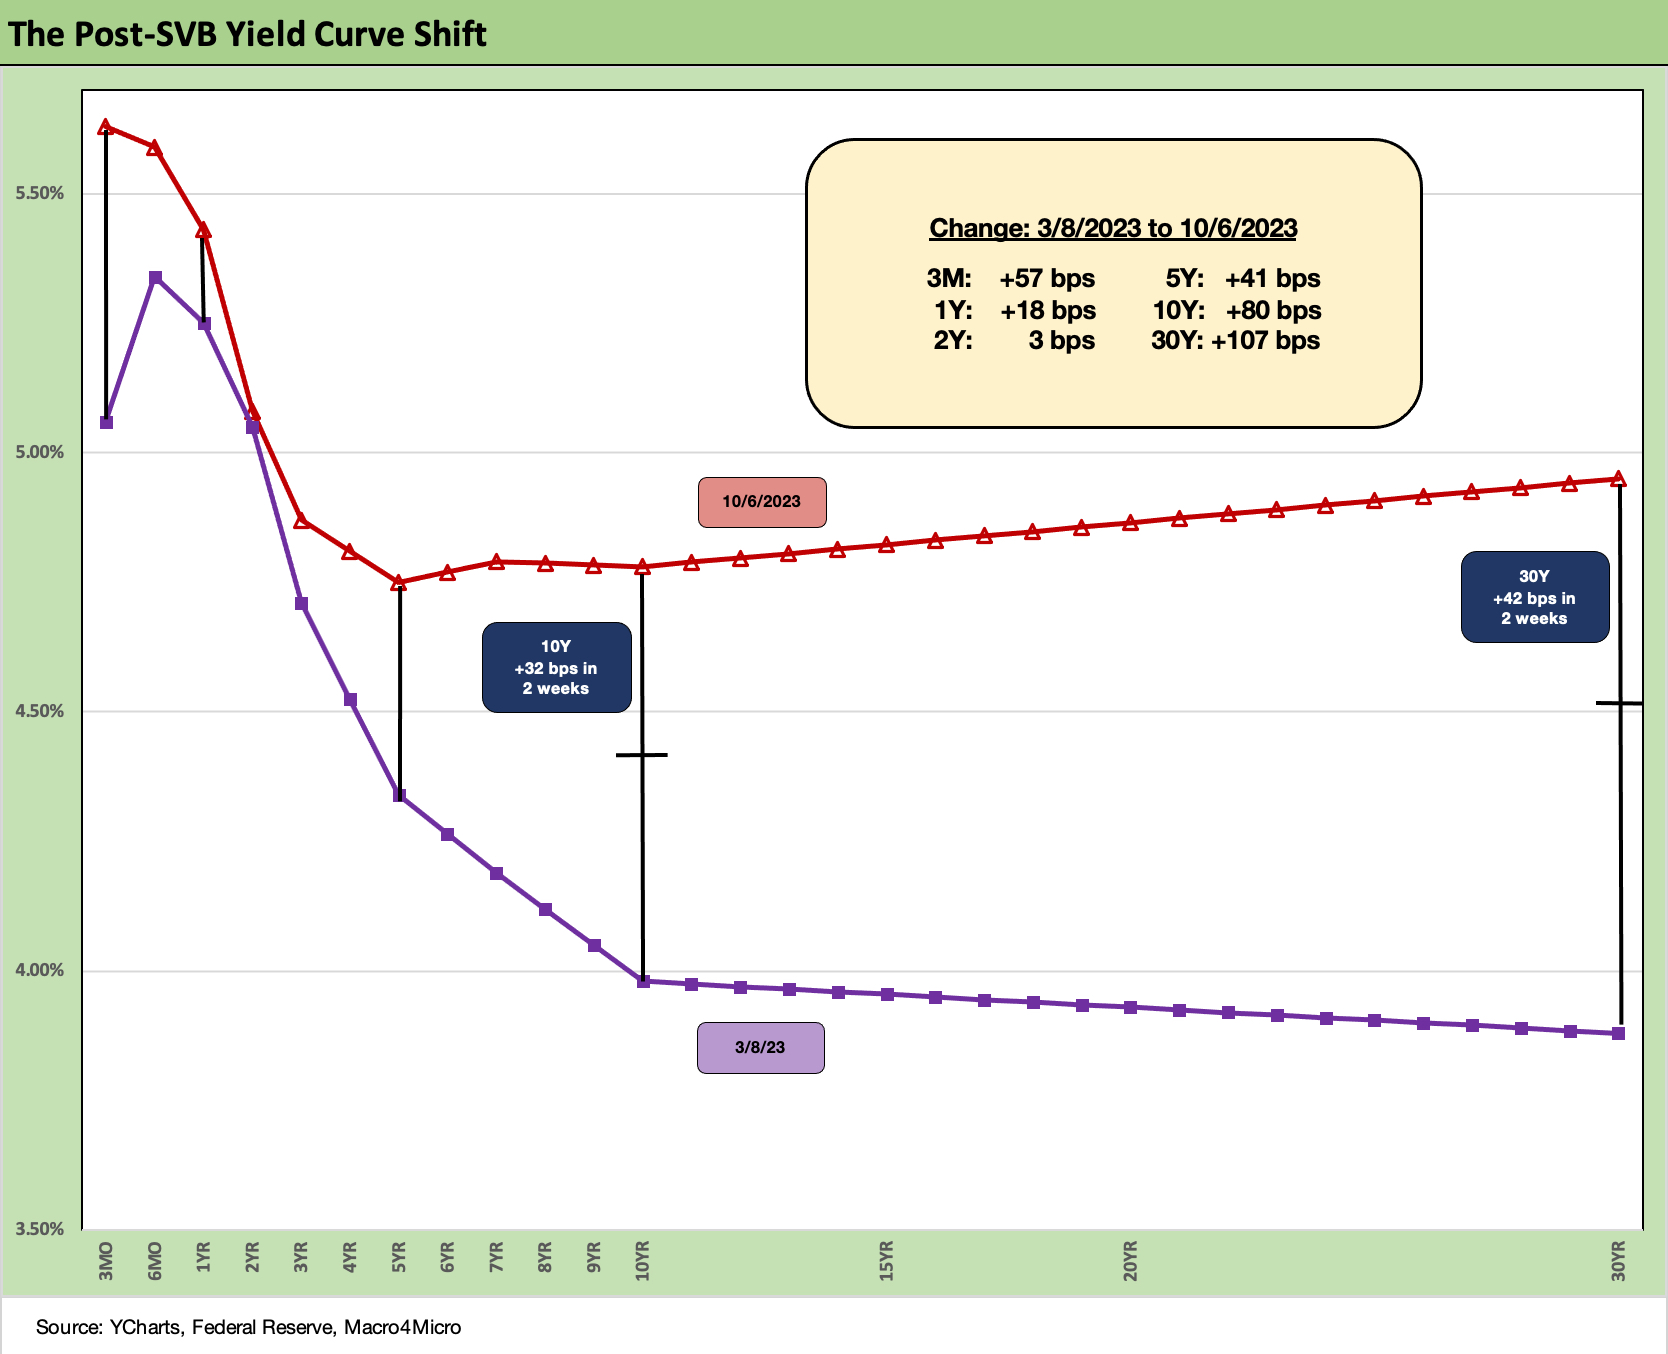
The above chart offers a UST curve visual on the post-SVB curve shift and steepener. We added a notation on what the move looks like over the past two weeks for the 10Y UST delta at +32 bps and 30Y UST delta at +42 bps. That is an ugly two weeks.
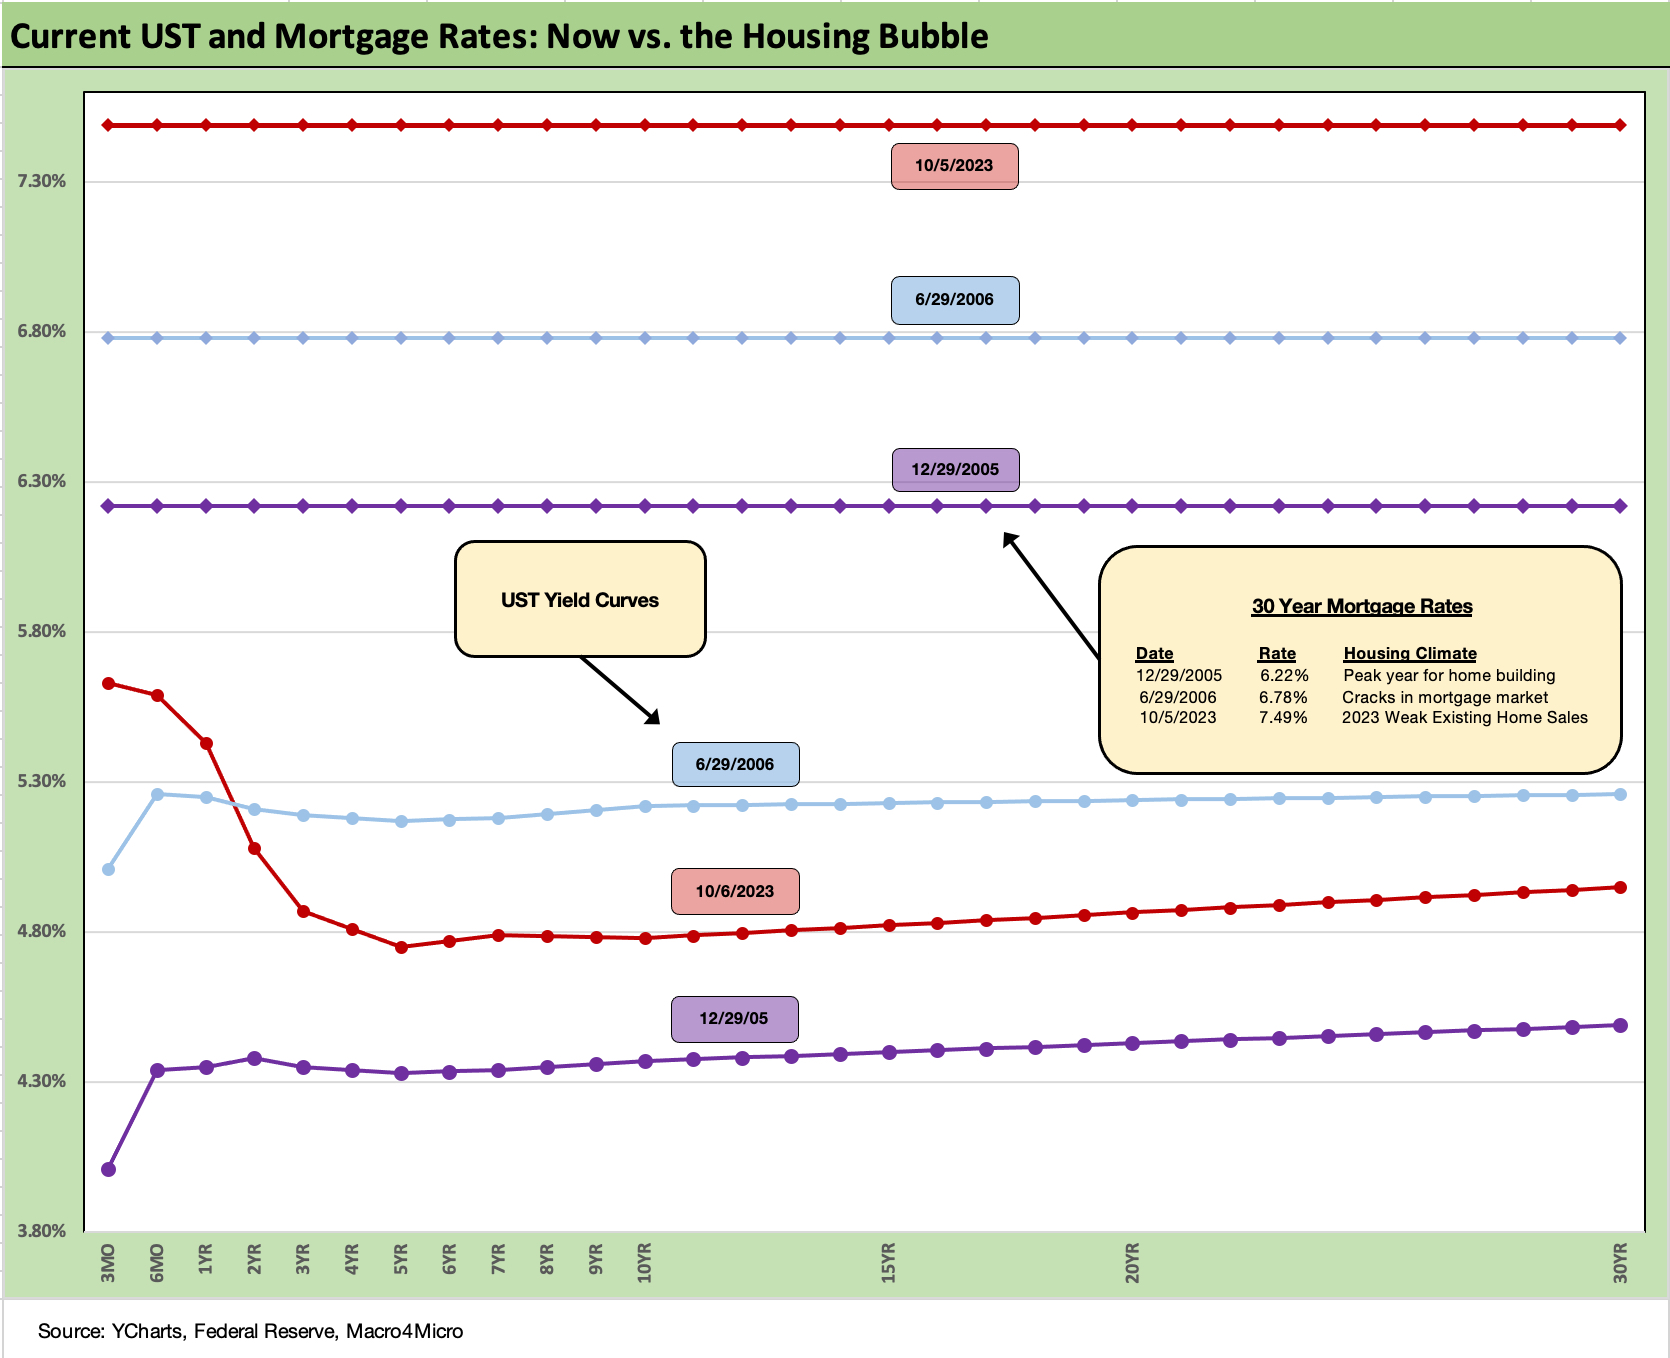
The above chart updates our comparison of the current UST curve and Freddie Mac benchmark 30Y mortgage to the peak homebuilding year to end 2005 as well as a look at mid-2006 as the subprime markets were starting to crack. The cracks became fault lines and were shattering by late 2007 after a summer of turmoil started to crush some hedge funds and Countrywide was looking for a de facto bailout (in stages) from BofA.
Interestingly, the current UST curve is still below mid-2006. A growing fear is that the current UST yield curve will see the 5Y and 10Y today start chasing the 5% handles of mid-2006 with even more damage to mortgage rates (the 8% 30Y mortgage rate threat seen in more mortgage trade rags these days).
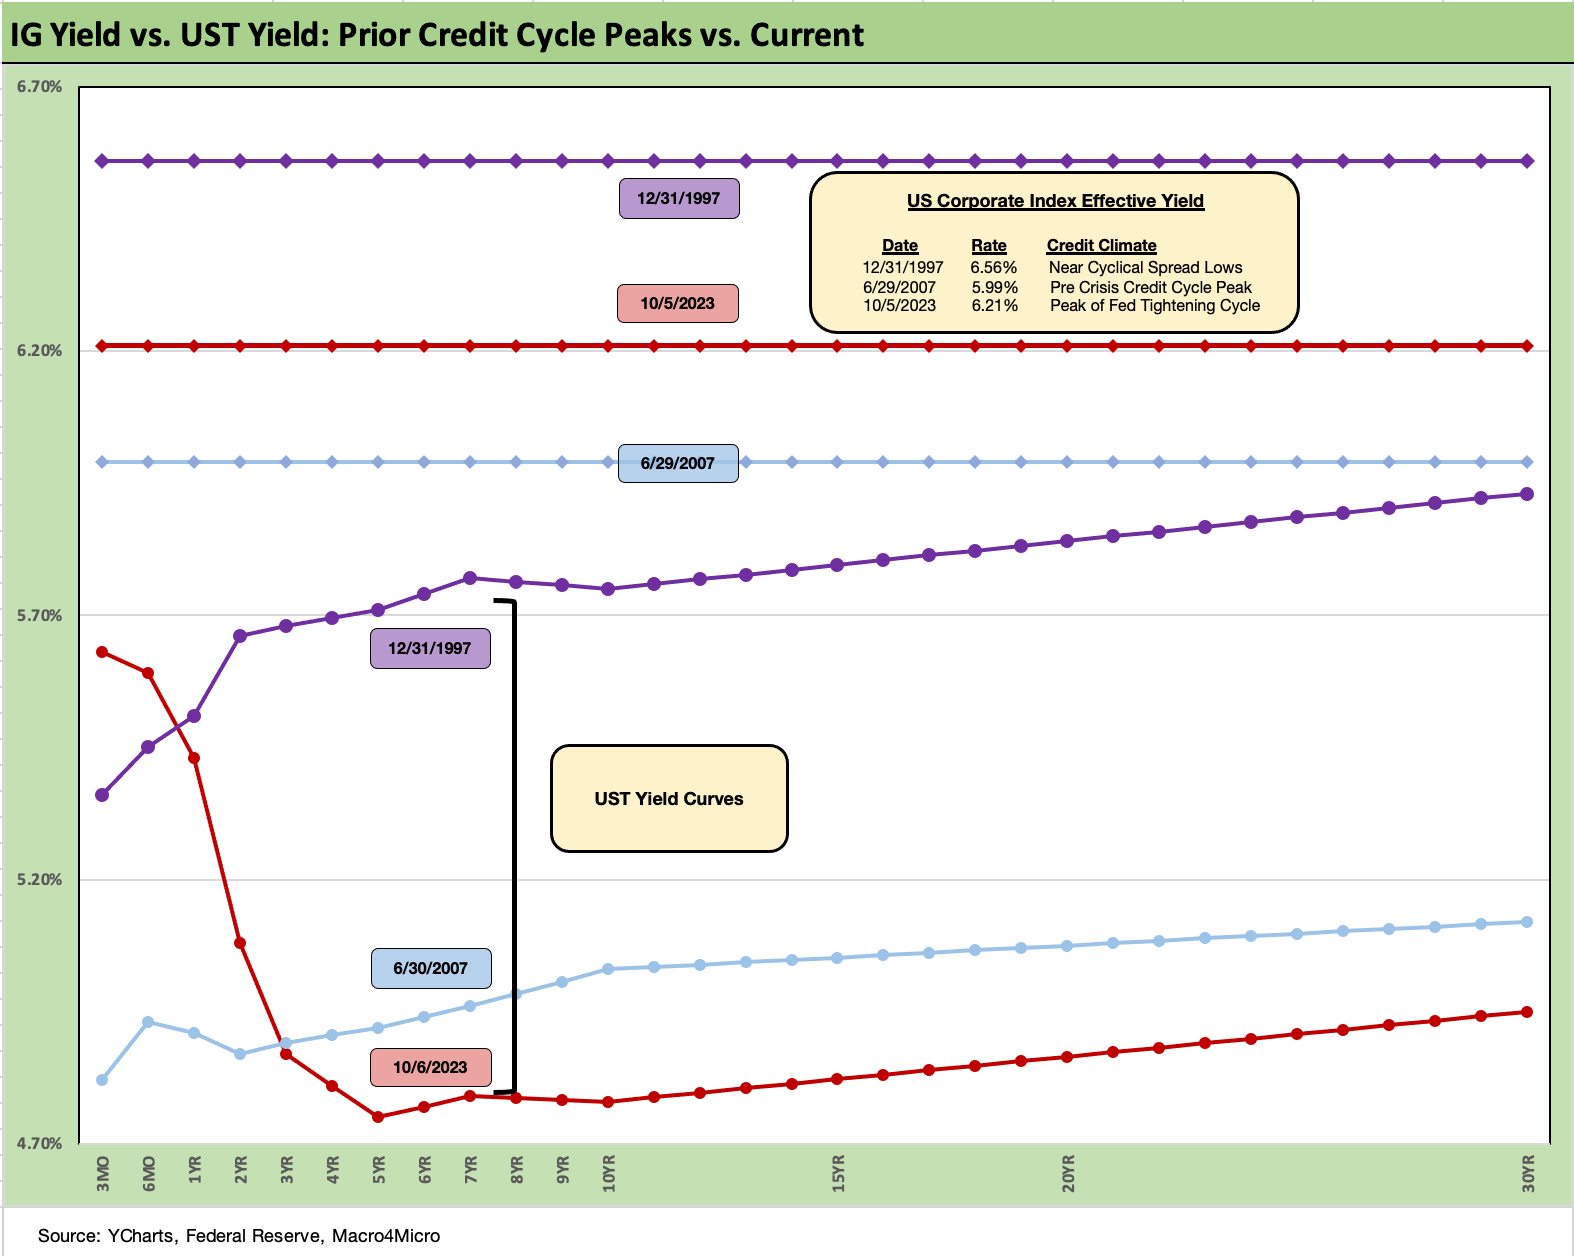
The above chart updates the similar exercise we just did for mortgages, but this time we look at the UST curve and IG index yield for periods around credit market peaks and tight spreads (end of 1997 and mid-2007).
IG spreads are tight now but not as tight as those other periods. The inversion of the current UST curve vs. 2007 and 1997 really stands out. Both 1997 and mid-2007 were upward sloping at those dates.
We have been expecting both IG and HY spreads to be vulnerable in the 4Q23 home stretch but especially US HY. Any noise in banks would undermine what has been extraordinary resilience in IG spreads. This week was a mild move wider in IG but weak return numbers more tied to duration. We look at asset returns in a separate “Footnotes” publication.
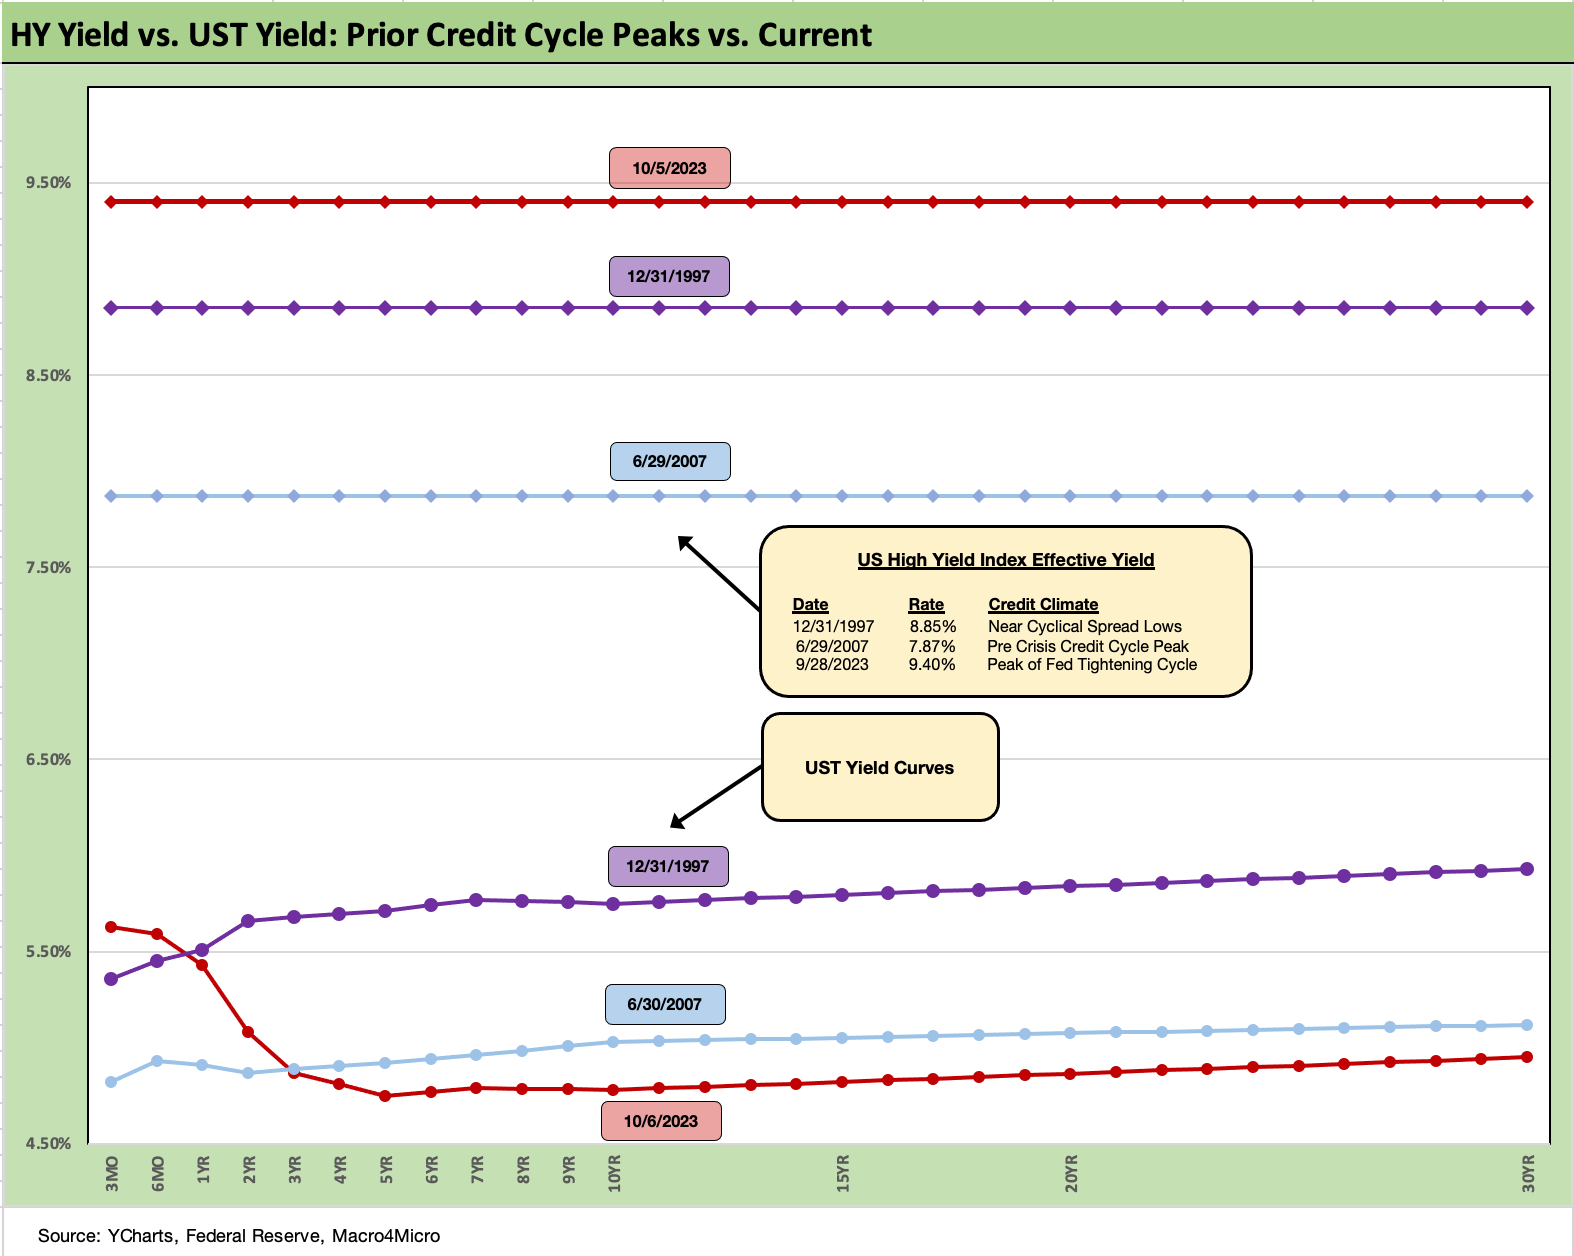
The above chart does the same drill as IG but for the US HY index and UST on the same dates. US HY spreads widened on the week even as the UST curve rose, so we now see an all-in yield for US HY at 9.4%. The US HY index yield is a small haircut to the long-term nominal return on equities. A double-digit bps UST move and another 30 bps in HY OAS has pushed the HY index yield (effective yield) up to that 9.4% level. The US HY index ended the week at just over +430 bps OAS.
That 9% handle all-in yield is above the 1997 and mid-2007 levels when spreads were extremely tight in those prior cyclical peaks. At year-end 1997, the HY Index OAS (source: ICE) was just under 300 bps after touching down in the +250 handle range in October 1997. At 6-30-07, HY OAS was also just under 300 bps after starting the month just over +240 bps.
Assessing the relative value of the asset class requires that you get back to framing overall index quality and industry mix, and where the market anticipates the trend line in forward defaults and recoveries. The rating tier mix and industry mix has better balance today than during the periods of TMT and LBO excess. The growing share of the BB tier in US HY is a well-known trend line at this point as is the deeper base of formerly IG and BBB investor demand and the rise of HY lite portfolios.
The current HY OAS is still inside the post-1996 long term median in the +470 bps area. Current spreads of +433 bps are below where 2022 ended (+481 bps), inside 3-31-23 levels (+458 bps) after a brief push out past +500 during the regional bank volatility. The HY market is wider than midyear (+405 bps 6-30-23).
Overall, we see this market as an above-median risk on the balance of factors and priced at below median spreads. This week is narrowing that gap with the median but still below it.
The bottom line is that the HY index all-in yields are rising on the UST push from below and not on generous risk premiums. Better risk pricing opportunities will come later for the move down the spectrum for IG investors or for those with asset class flexibility and looking to overweight HY as an asset class at some point.
Yield curve slope…
The next two charts update the cash vs. 5Y UST relationship and the curve extension trade from 2Y to 10Y after such a protracted period of inversion. We see the “What’s the right term premium?” debate picking up of late. It is hard to make the case that inversion is adequate compensation unless you are an extreme duration bull.
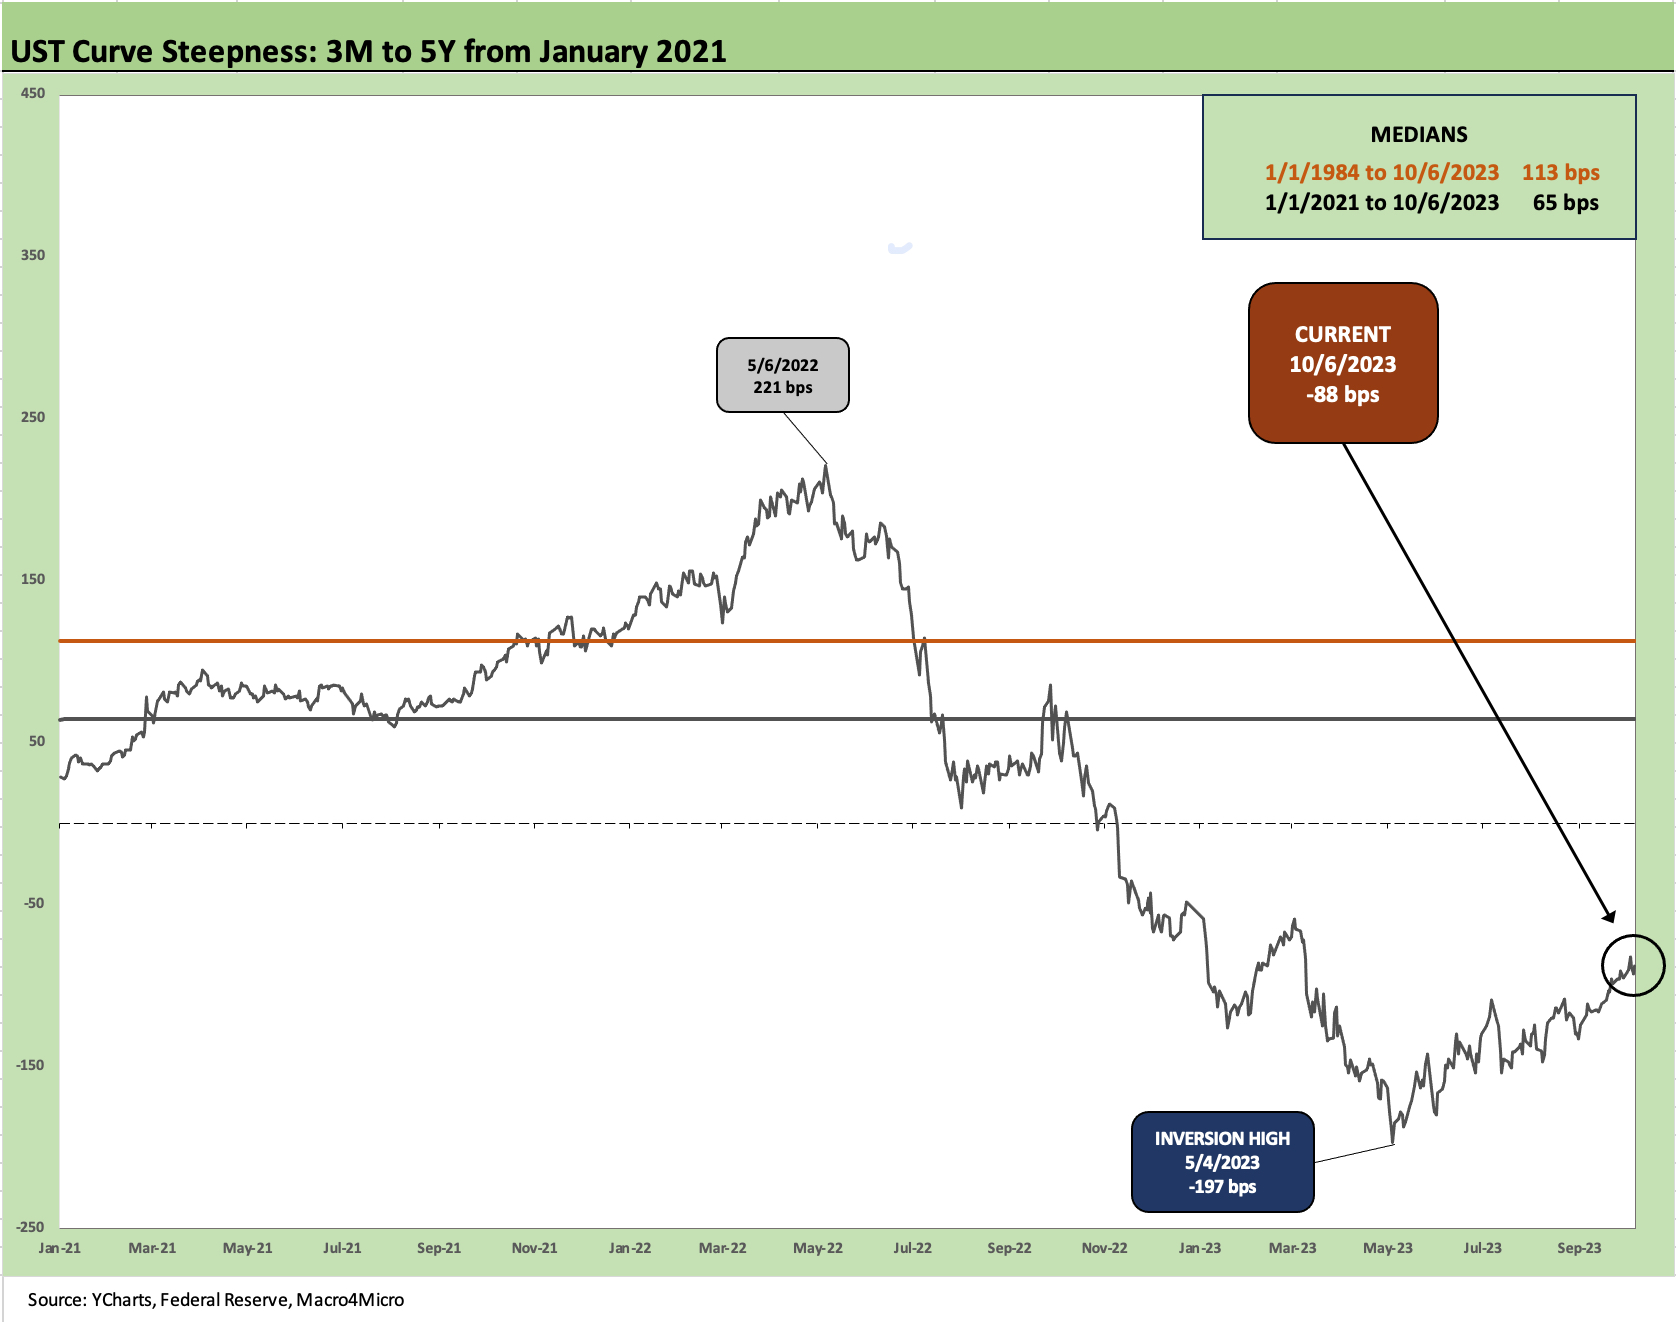
The above chart frames 3M to 5Y UST, and we still see an inversion of -88 bps, well in from the peak inversion of -197 bps in May, but still unusual in historical context. The peak slope over the short post-Jan 2022 timeline plotted above was +221 bps as the Fed was just getting warmed up in the spring of 2022. We have looked at the long term timelines in other pieces starting last fall (see The Cash Question: 3M-5Y Yield and Slope 10-29-22), and the reality is that cash has outperformed UST bonds. Cash also beat IG bonds and the Core Aggregate Bond asset class. Duration lost.
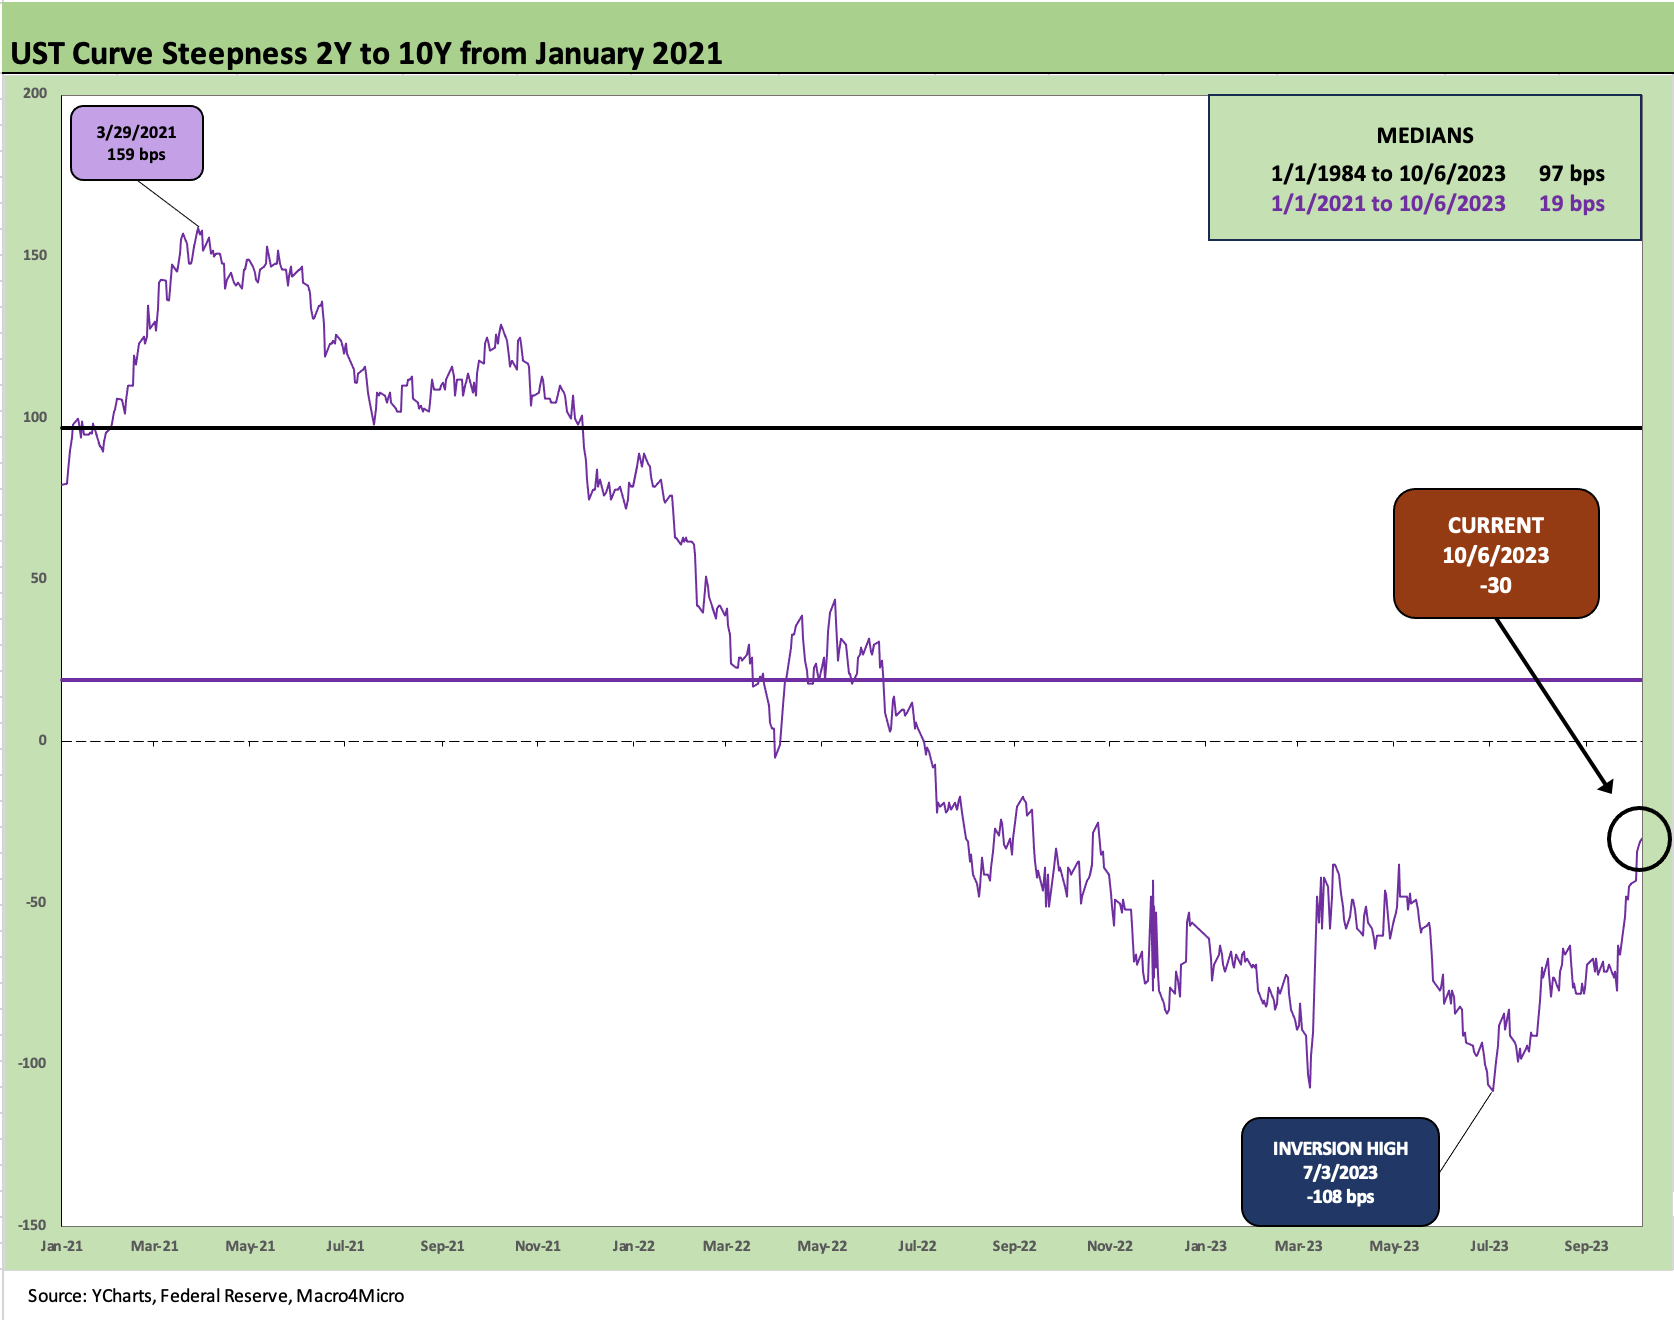
The above chart updates the 2Y to 10Y slope, which also cuts across the sweet spots of both IG bond and the US HY menu. The inversion is now down to -30 bps as the UST curve has shifted higher in a steepening pattern. The only way to get back to flat with the short end anchored is through steepening, and that means near term duration risk is still a threat if economic fundamentals hold up.
With the direction of jobs posted this past week (see Jobs ‘R’ Us: The Perils of Plenty by Occupation 10-6-23, JOLTs: Staying Alive 10-3-23) and with major economic subsectors such as construction going strong (see Construction: Project Economics Drive Nonresidential 10-2-23), relief in interest rates will need some good (as in bad!) news from risk markets or inflation. We have CPI coming out this coming week along with self-inflicted drama in Washington. CPI trends have been positive but Services sticky. Energy has been volatile again.
The geopolitical situation in Israel will get very serious in a hurry, so more than a few eyes will be on the behavior and rhetoric of other nations. In the “old days” this news would have tacked on serious risk premiums in oil markets, but that was before a few decades of Mideast wars and the shale boom and oil sands growth.
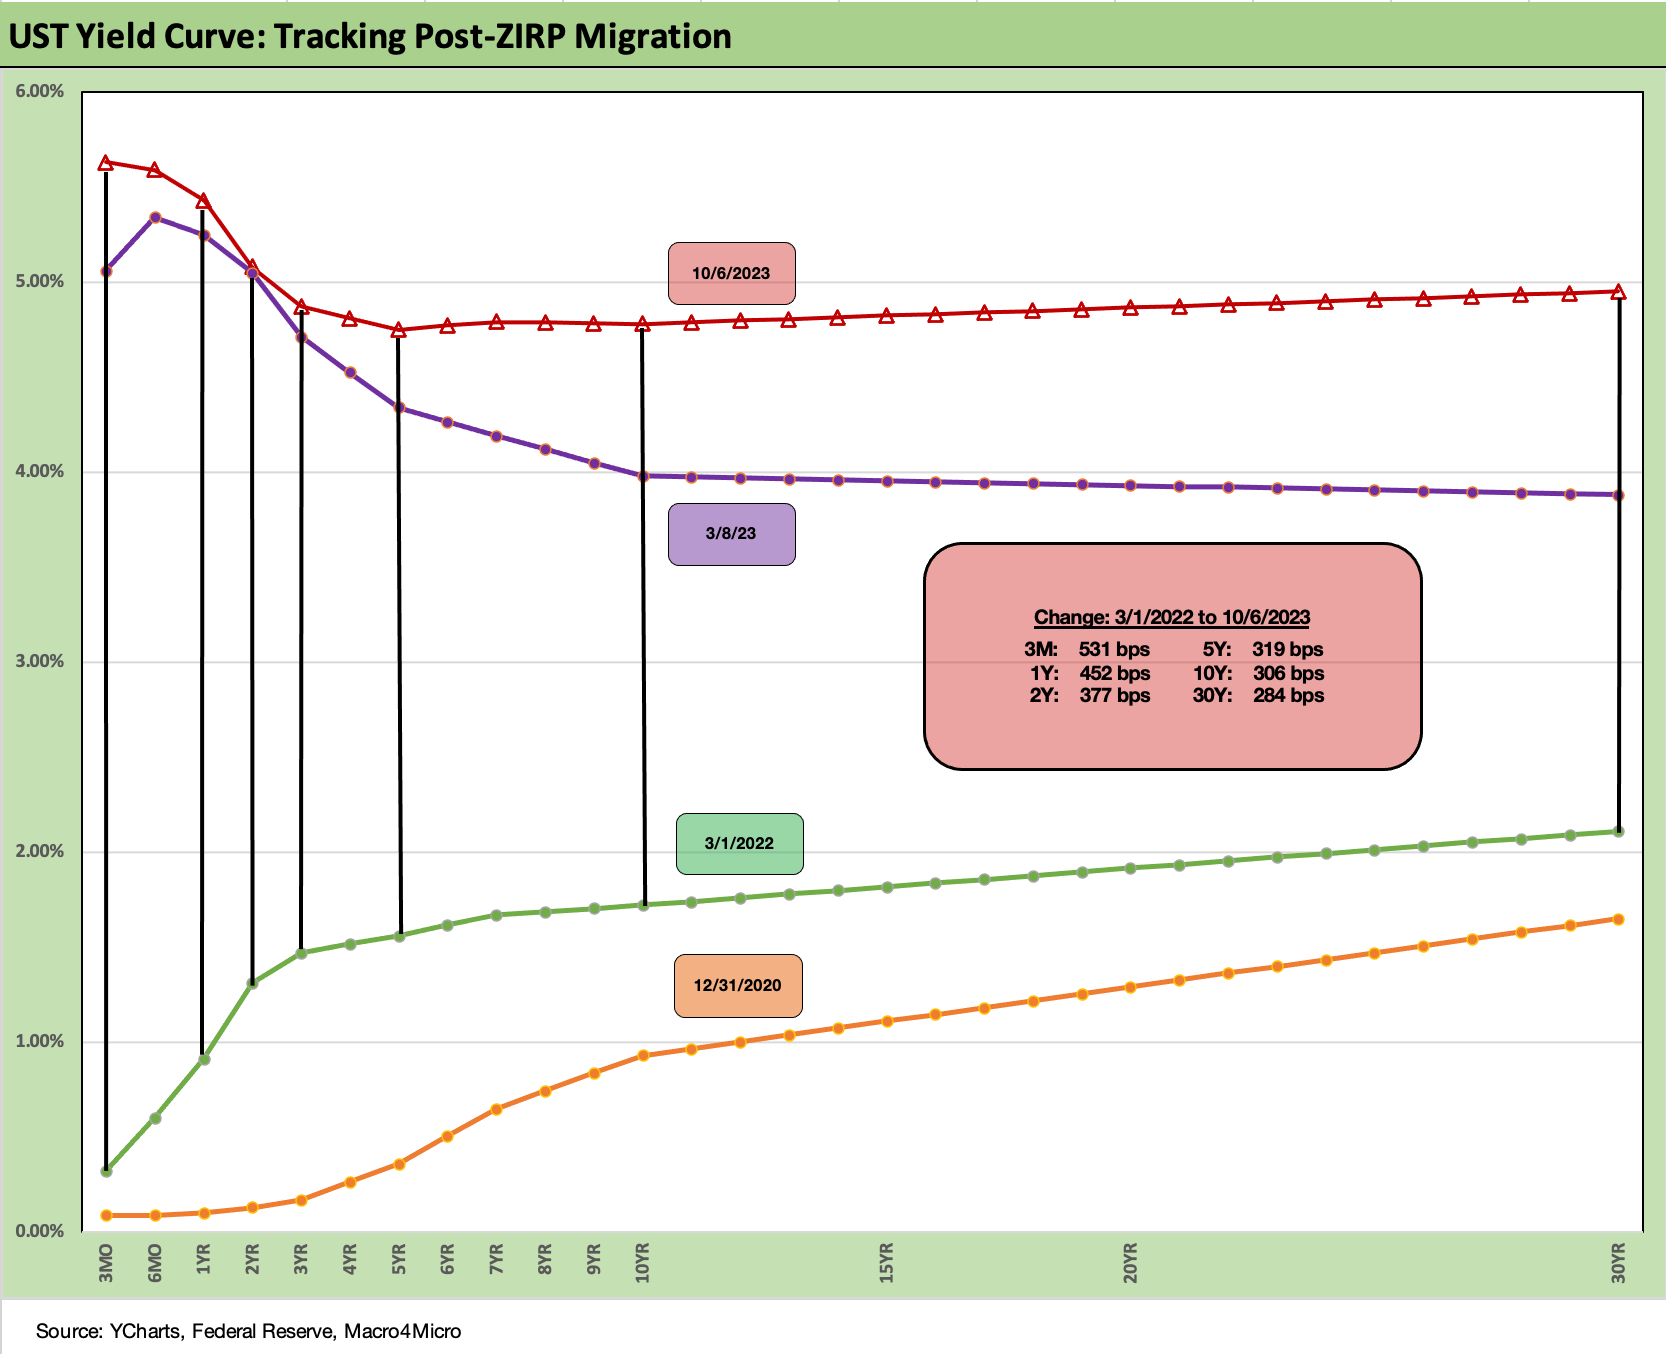
We end the commentary with our usual final chart that breaks out the running increase in the UST migration from March 1, 2022, or just ahead of that month’s move away from ZIRP and start of the Fed tightening cycle.
The bear inversion is still very much in evidence, but more eyes are on the steepening trend beyond 2Y UST out across the longer end of the UST curve. The move just from March 2023 through current times this year stands out after a protracted, deep inversion.
The crosscurrents in the rates market were tricky enough without a new geopolitical shock. We hope the situation in Israel will shake some sanity into the Washington DC crowd to be responsible and bring some normalcy back into policy. Supporting Israel and being a leader globally requires getting outside narrow interests and rising to the challenge.