
JOLTs: Staying Alive
We look at the rebound in the job openings number with separations steady.


The job openings number ticked up materially by just under 700K while separations, layoffs/discharges, and quits were little changed.
For job openings, the biggest delta was in Professional and Business services with Leisure and Hospitality topping the hires rankings.
Layoffs/Discharges saw the needle barely move on a net basis with Health Care and Social Assistance slightly in the lead in the private sector with low net increases in layoffs.
State and Local Education was the net layoff/discharge leader on the Government side.
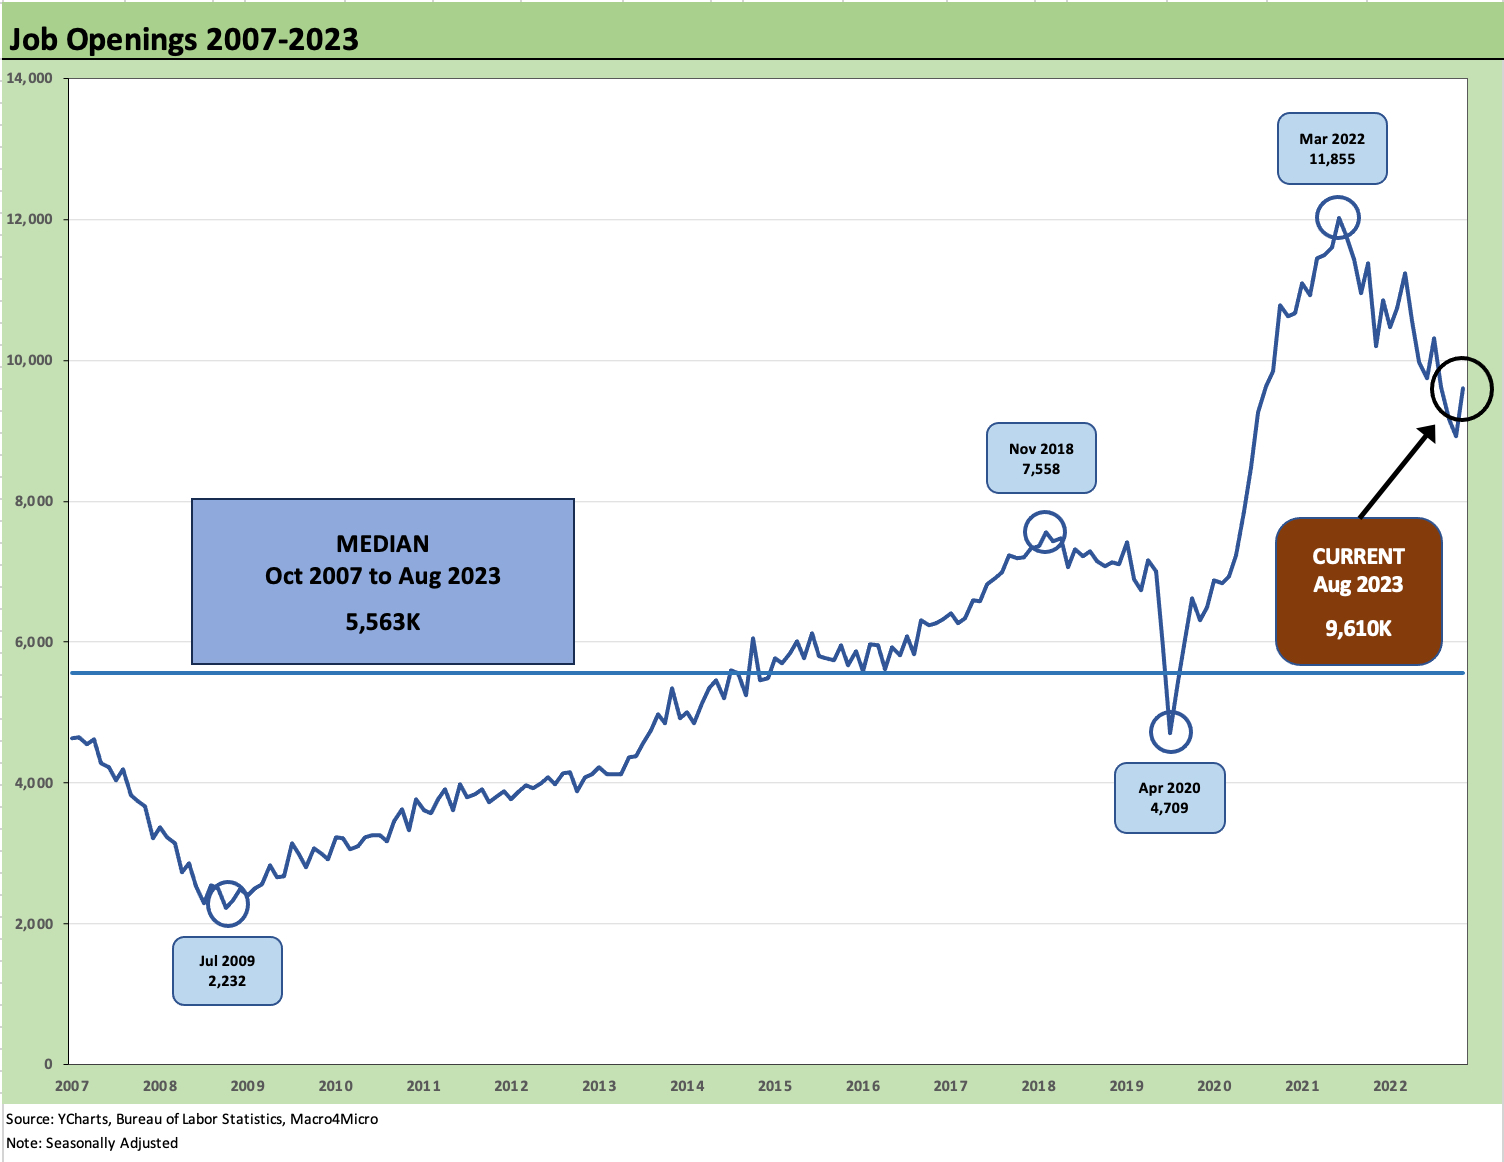
The above chart plots the time series for job openings as a sequential increase of +690K jobs is good news for those seeking work. The tally is down from the prior year August 2022 by 588K but still frames up respectably against the August unemployment ranks of 6.4 million. The new payroll numbers for September are out on Friday.
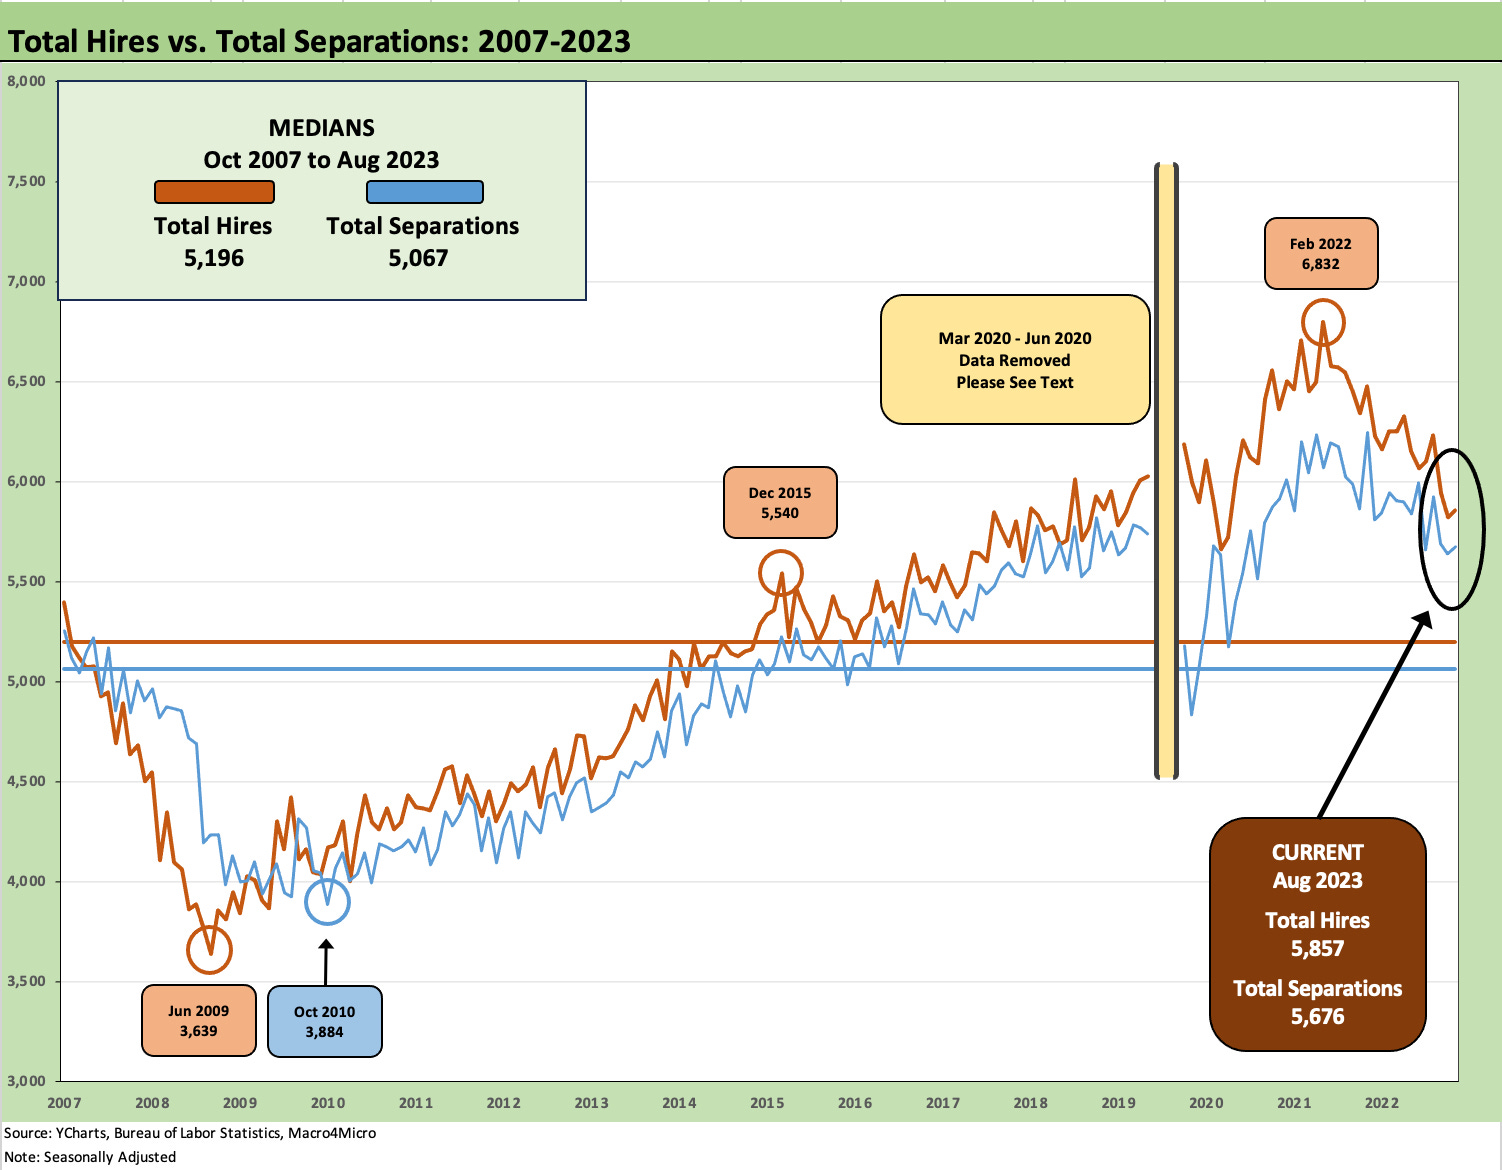
The above chart plots the timeline for Hires and Separations, and the Hires >Separations math is still in place. This chart removes the wild swings of the COVID period for better optics in the chart. We detail the swings during COVID in the graphic below.

We use the above box in each JOLTs commentary as a memory jogger for the strange and deadly times of the COVID period and the wild swings in employment. It is impossible to do a normal time series chart with these numbers included without blurring the month-to-month patterns in the JOLTs stats.
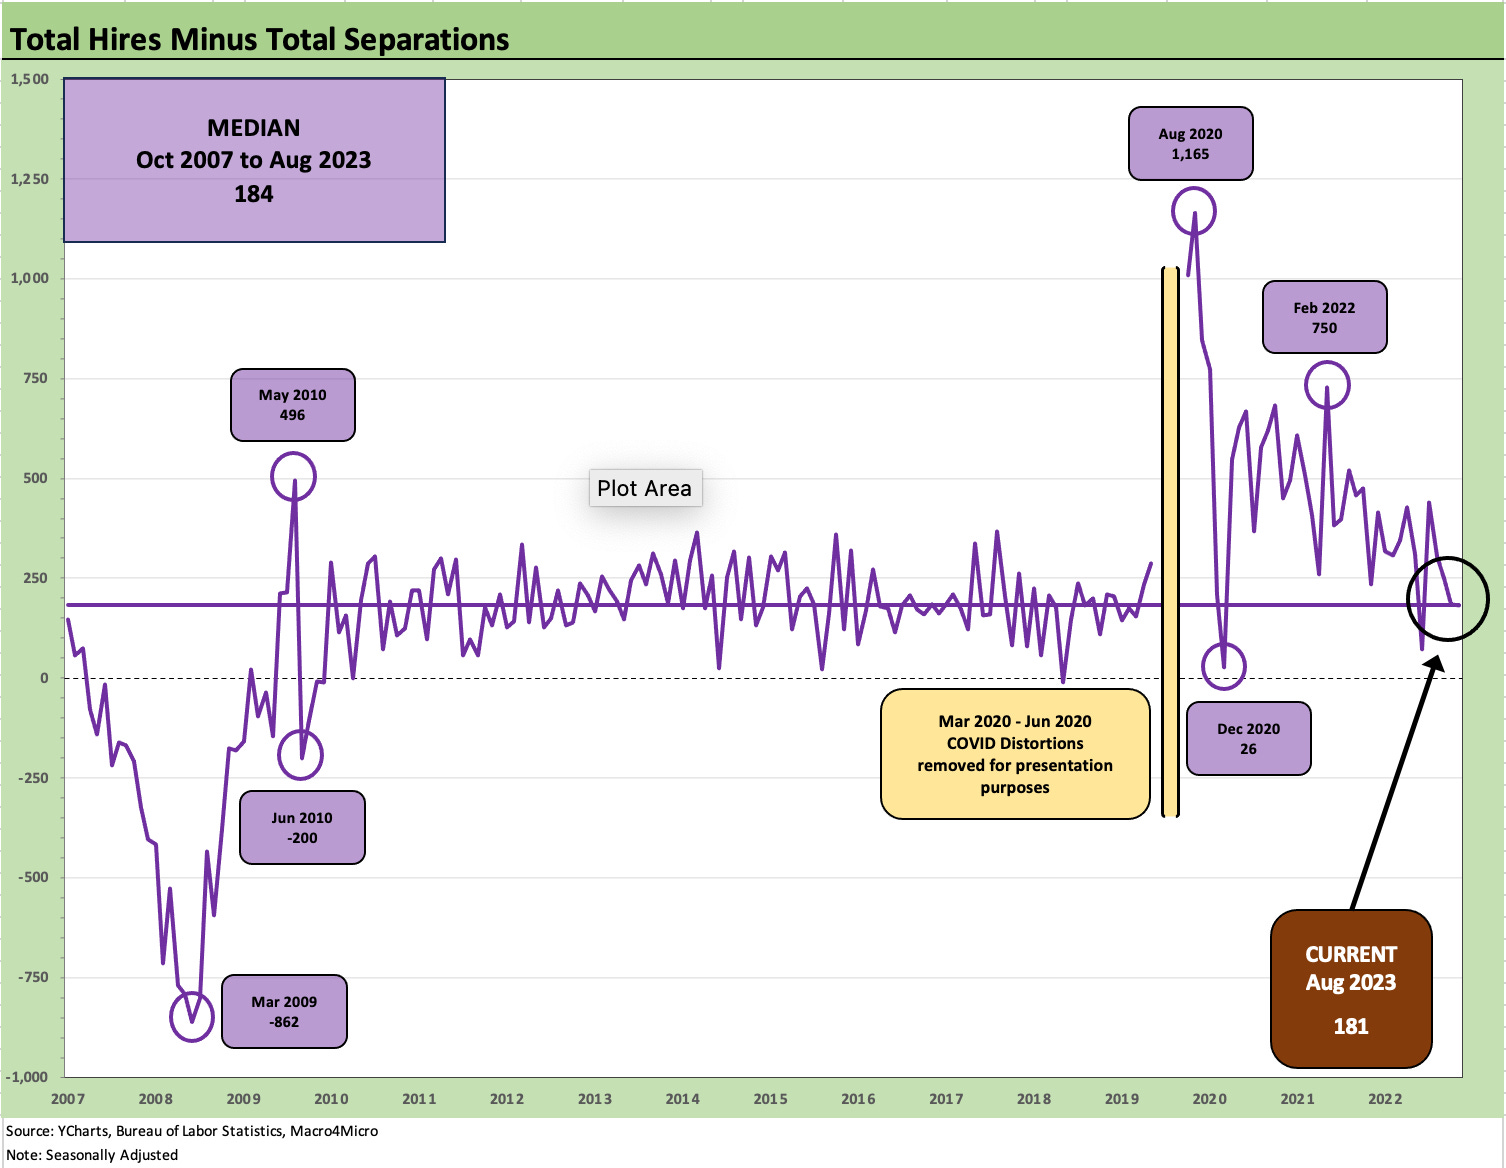
The above chart shows the Hires minus Separations differential across the cycles from 2007. We see a current differential of 181K, which is just below the long-term median of 184. We again remove the COVID period distortions from this chart and refer to the reader to the prior graphic that provides those details.
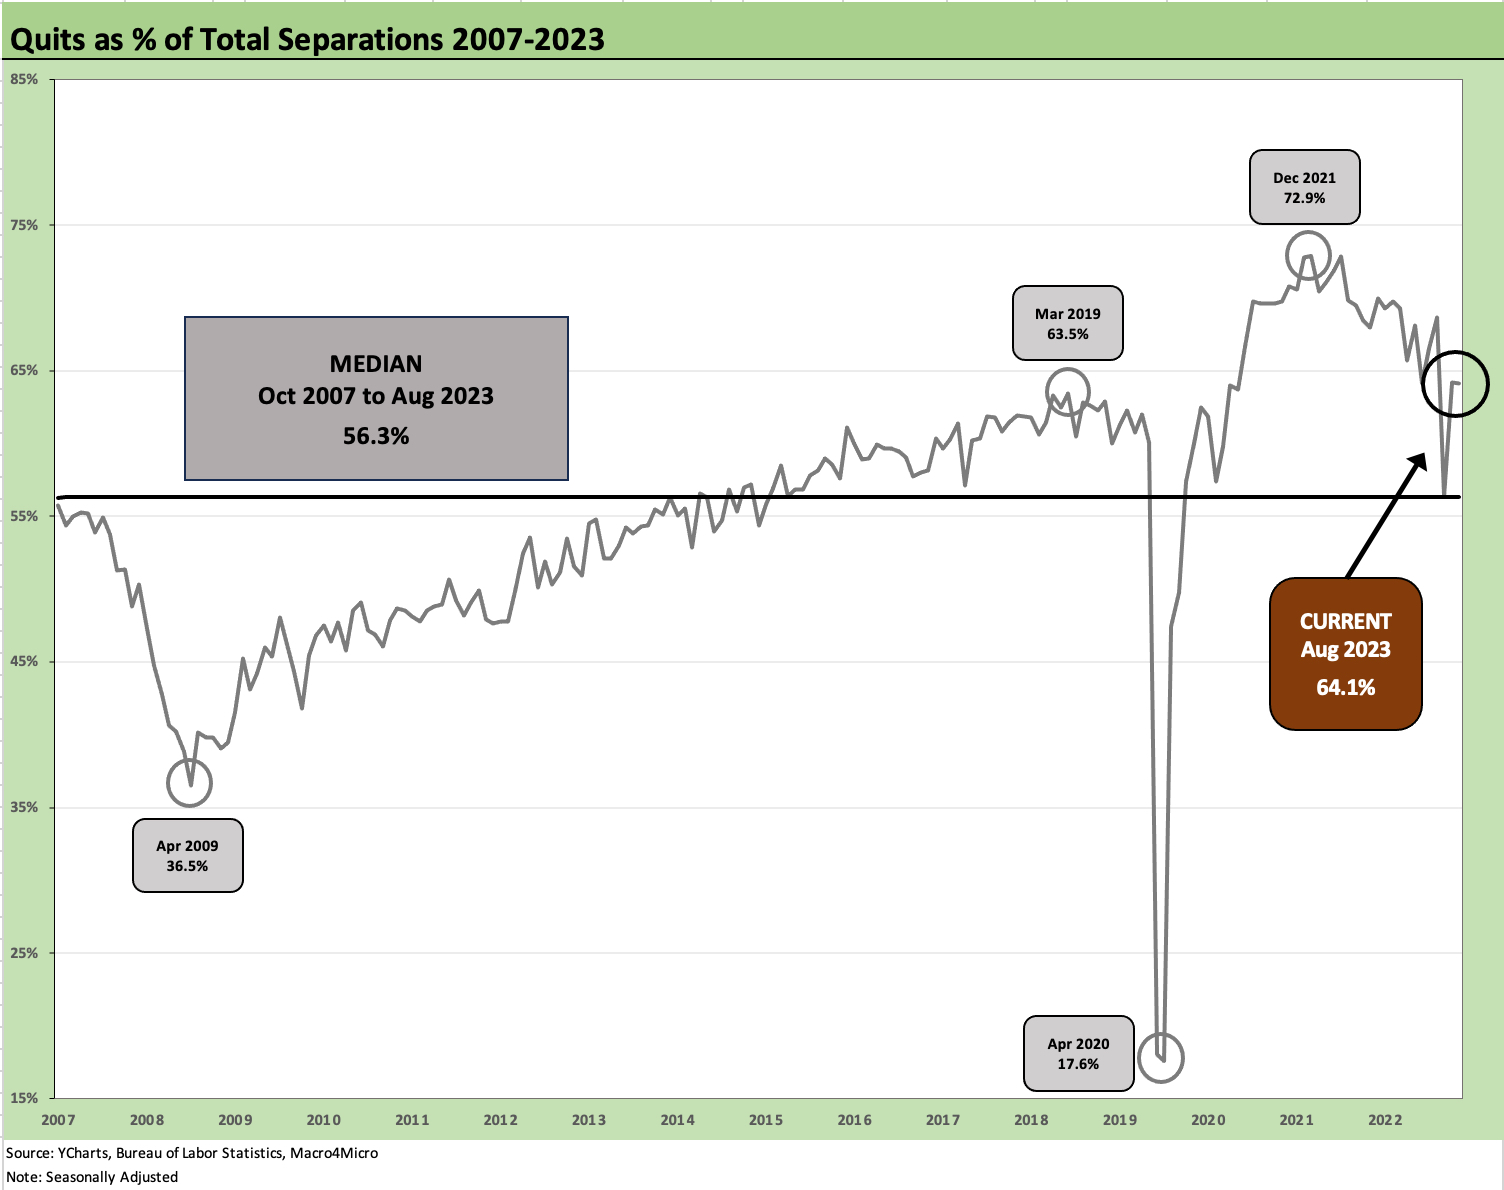
The above chart plots the quits ratio as a metric sometimes used to reflect worker confidence. The current quits ratio is still above median. The ability to find a new job can be tied to the expectation that a new job can be found in a timely manner. In some cases, the employee may simply loathe their employer or boss. That is a utility curve question that we do not cover herein.
BLS needs might need to add another few hundred openings!!
Sure do wish data that moves mkts was based upon more than a 35% response ratio and a 65% estimation effort by BLS