
Footnotes & Flashbacks: Asset Returns 7-2-23
We look at asset returns through the first half of 2023 as equity indexes sprinted and bonds jogged/walked.


We look at the mix of returns across a period that saw a monster tech rally, a near-miss on debt ceiling chaos, a shocking regional bank deposit run, sliding oil prices, and all that wrapped up in June with a “hawkish pause” by the Fed.
Russia-Ukraine generated milder economic fallout and energy effects than originally feared, but geopolitics remains a highly unpredictable and asymmetric risk for the US and Europe while the US-China-Taiwan scenarios loom behind the scenes as supplier chain risks.
The biggest news was the dazzling performance of housing equities despite high mortgage rates, the auto sector seeing solid volumes after recession-level numbers in 2022, and the growing conviction in the markets (even if not in a dysfunctional Washington) that the infrastructure bill, CHIPS Act, and fiscal EV support are driving massive investment programs.

As we cross the 2023 midpoint, the risky asset markets have turned in strong numbers in historical context with equities leading the way even in the face of a continued steep yield curve inversion and 5% handle short UST rates (see Footnotes & Flashbacks: State of Yields 7-2-23). The chart above lines up 26 ETFs and market benchmarks with 1H23 total returns, and we see 20 in a positive range for the first half of 2023 and 6 in the negative zone.
Only the Regional Bank ETF (KRE) is a double-digit negative in total returns at -29.3% as some regional banks that started the year have since disappeared after the onset of the deposit flight crisis after March 8 with the collapse of Silicon Valley Bank. SVB set off a dynamic that saw more panics, including the somewhat unrelated demise of CSFB. Credit Suisse was rolled into UBS as the last man standing in Switzerland (see Risk Appetites Get Bloodied 3-15-23, SVB Reprieve: Hail Powell the Merciful3-12-23). It’s a long way from the days of UBS, SBC, and Credit Suisse.
Among the major themes of the 1H23 was the dominant role played by the mix of mega-cap Tech or Tech-centric names that disproportionately drove the market performance of the market cap weighted indexes (see Reversal, Takedown, or Escape? Market Weighted vs. Equal Weighted 6-6-23). In the chart above, we added in an S&P 500 Equal Weighed ETF (RSP) and a NASDAQ 100 Equal Weighted ETF (QQEW) to highlight the differentials. The lower performance of equal-weighted benchmarks hit double-digits in both cases, but equal-weighted total returns were still solid in historical context and notably so for the equal weighted NASDAQ 100 ETF.
We look at the shorter time horizons (1 week, 1 month, 3 months) in more detail below.
A few other items worth highlighting in the mix above…
Homebuilders at #3 in 1H23: We give a lot of attention to the builders in our research and will continue to do so. The XHB ETF posted +33.8% in 1H23 and was the only ETF to make the Top 5 without a member of the Magnificent 7 (Apple, Microsoft, Alphabet, Amazon, NVIDIA, Tesla, and Meta in descending order of market caps).
Builders are being recognized for their financial resilience, strong cash flow fundamentals, inherent working capital flexibility, and the sustained secular shortfall of housing supply vs. demand (see KB Home: Credit Profile 6-24-23, D.R. Horton: Credit Profile 4-4-23). The stabilization of housing volumes and pricing is good news for consumer confidence in their positive home equity. The big swing factor from here will remain mortgage rates and the impact on existing home sales inventory getting freed up. For now, the builders win with the inventory tight and the “golden handcuffs” of so many 3% handle mortgages keeping potential sellers on the sidelines.
Transport at #6: The XTN ETF for Transportation weighed in at #6 at +25.1%, and those are impressive returns. An alternative ETF in the major Transport ETFs is IYT, which is less diversified and also turned in strong numbers. We chose XTN for our chart as a very well diversified ETF and not distorted by any handful of issuers with its broad mix of classic freight and aviation names. On a side note, IYT weighed in at over +16% returns, and that would have been in the Top 10 also.
When we see both builders and diversified transport names in the Top 10, there is a view on the cyclical industries not signaling high anxiety. We would add Industrials at #10 as another reassuring member in the mix with its heavy focus on manufacturing across defense, aerospace, and capital goods.
Business Development Companies: The BDC ETF (BIZD) made the Top 10 at 11.8% in total return, which is a strong set of numbers heavily tied to the high income and dividends associated with the underlying asset base of floating rates loans. Small cap and microcap secured loans are the primary asset, and the short end of the UST curve is either stable for now or heading higher. If you believe in the credit cycle’s ability to duck a hard landing and see the Blue Chip management teams as having the skills to navigate, there is a risk-reward decision to make for those seeking high income.
We are not making investment recommendations at this juncture, but in the interest of disclosure I have holdings in a number of BDC names. No single name is over 2% of my personal portfolio. I own BDC stocks and not the bonds, so that implies I am not too worried about the bonds of the major players. I opted for the higher income in the equities and expect this sector to keep growing. Private credit will remain a massive topic in the period ahead well beyond the BDC sector. The disintermediation of the banks is back on the front burner.
Regional Banks still in the cellar: As detailed above, the Regional Bank ETF (KRE) is far and away the worst performer in 1H23. It is easy enough intellectually to get very comfortable with regional bank fundamentals, underwriting, and capital, etc. That is name by name analysis. It is far more challenging after SVB to get comfortable with the depositor confidence wildcard after such a harrowing reaction to the recent regional bank crisis.
While the regulators came through, the usual reactions in Congress were mixed and the sustained high interest rates on short UST is going to keep the heat on interest margins at the regionals. That interest margin pressure will remain even as the market will still be fairly neurotic on a subset of existing exposures to commercial real estate. We assume the Q&A will be very demanding on 2Q23 earnings calls, and we will see how the management teams deal with the issues.
Bonds and duration as third quartile performers: When equities are running and the fed is tightening, bonds usually lose, but that is not the case in 1H23. Bonds in 1H23 did much better than in 2022 on the indecision of the yield curve, and that supported duration on balance with mixed performances from week to week. The UST curve and equities and the Fed all held very distinct views on the cycle, and that makes for a challenging backdrop.
As we cover in our credit spread commentaries and yield curve work weekly, the fixed income market is holding in remarkably well in 2023 with so much market to-and-fro in reaction to FOMC policy. There is also the question of whether a wave of defaults will beckon in 2024, but the ability to remain around average default rates in 2024 is favorable. As covered in other commentaries, we still expect IG bonds to beat HY for calendar 2023. The HYG vs. LQD compression above is closer in the ETF chart returns than when the HY and IG index benchmarks are compared since HY ETFs take less risk and are more exposed to large, liquid issuers.

The above chart updates our regular mix of debt and equity asset classes. We line the total returns up in descending order of YTD returns. We see equities winning handily on the market rally after an abysmal 2022. In 1H23, we saw a major rebound in bellwether tech names. The winners of 1H23 saw performances that were less than Magnificent in 2022. Last year, duration absolutely pummeled the bond benchmarks (see The 2022 Multi-Asset Beatdown 12-31-22). 1H23 has been a good period for risk, but years such as 2018, 2014, 2011, and 2007 keep you on edge in the 1H vs. 2H dynamics.
For debt, US HY came out on top YTD through the first 6 months of 2023 on fundamental trends, income (coupon), resilient below median spreads, and a tolerant, confused yield curve that helped drive solid HY returns above 5% YTD. For spreads, the ICE index (Bloomberg returns are posted above) shows a material contraction in HY spreads from the start of the year until now with a few spread whipsaws along the way after the Dec 2022 widening rolled into a big January rally. Material spread contraction of ~76 bps over 6 months drove excess returns of over 4% for US HY.
The widening after SVB did not get close to the peaks seen in early July 2022 of almost +600 bps (see HY Spreads: Proportions and Risk Compensation 6-28-23). With all-in UST yields materially higher on average in 2023, the hardier types that buy into US HY need more to get scared away into material redemption waves. The fundamentals have hung tough, notably after the bank stress. A BB-heavy HY index with decent cyclical signals from numerous subsectors keeps the battle going.
Over the past 1-month and 3-month time horizon, the recent pressures on UST benchmarks are evident in the negative returns as the UST curve has been migrating higher again after all the good news in employment, housing, and balanced guidance out of earnings season. The FOMC commentary has not helped confidence on where the Fed might go, but the overall mix of variables has started to build on the scenario that the inversion may simply be early.
There is also a growing view that there could be a period ahead of a flattening direction in the curve (aka a bear steepening direction). We look at the UST curve action in a separate commentary. This is a tough call on the UST curve. We expect more tightening and some adverse moves against duration coming out of 2Q23 earnings season.

The above chart updates the “1500 and 3000” equity index series. We see a very strong month to close out the 2Q23 and 1H23 period. Some of the benchmarks see the trailing 1-month ahead of the YTD return numbers. Industrials posted a 10% handle month that beats the trailing 3-month period and comprises most of the YTD returns. Russell 3000 Value put up a 1-month performance that exceeds its 3-month and YTD returns.
Meanwhile, Real Estate is mounting a comeback along with Financials and Energy. REIT equities have been getting some street research support of late. Energy is having a rough time after a banner year in 2022. Financials and Energy are two benchmarks that remain in the red YTD while XLRE broke back into the black for YTD on a very strong week. REITs and real estate broadly are very diverse in fundamentals and the underlying asset risks. Financials are still feeling the regional bank pain and some worries around consumer credit quality and troubled real estate lending that will need to be showing up in future quarterly provision numbers.
In Energy, upstream lives and dies by oil and gas prices. For the midstream sector, the next move around midstream/pipeline permitting is still more speculative than on the docket after the MVP victory in the debt ceiling deal. As we cover in the 6-month ETF returns at the top of the piece, midstream (AMLP ETF) is less volatile and turned in much better numbers than XLE or XOP. The color from the construction outlooks cites the massive spending on LNG that will continue on these multiyear projects.
Comparative asset returns….
In our final three asset return charts, we cover 1-week, 1-month and 3-month time horizons. We look at 26 different benchmarks and ETFs that capture the performance flavor across a wide range of industry groups and asset class proxies as well as the usual major equity benchmarks. As mentioned earlier, we added equal-weighed ETFs for the S&P 500 and NASDAQ 100 given the market cap weighted distortions in the total returns for those benchmarks driven by the mega-names.
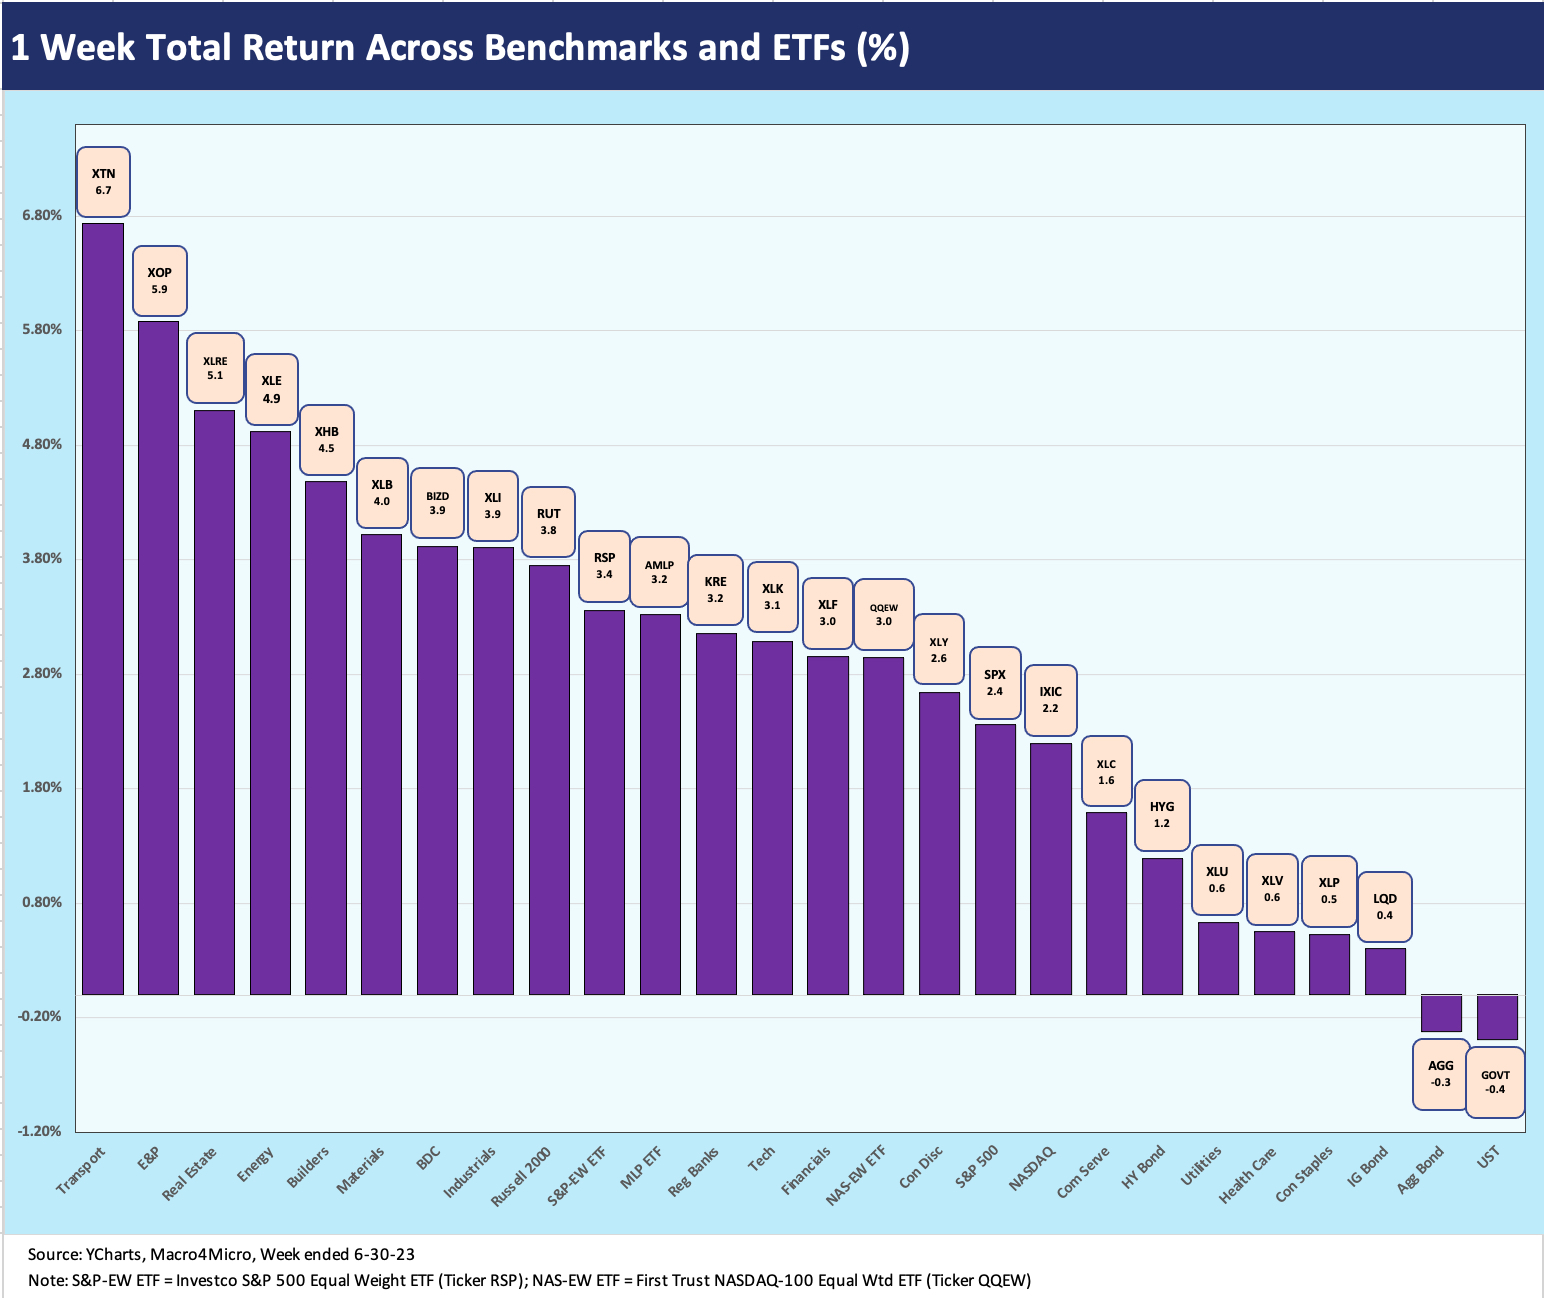
The above chart shows a great week that ended with a strong day after a strong month in a strong quarter and a strong first half (there is a pattern forming here). Considering the threat of a debt ceiling catastrophe to start June and the chaos of regional bank depositor panics and the exit from the month on a hawkish FOMC note, the timeline is one that mixed surprises good and bad.
“The good” surprises in the chart above included rebounds in ETFs for E&P (XOP), REITs (XLRE), and diversified energy (XLE). The “buy’em when they are beaten down” theory has worked well with energy in the past. AMLP came in just below the Top 10. The bookend of the Top 5 shows more strength out of Transportation (XTN) at #1 and Homebuilders/Suppliers (XHB) at #5 as builders wrap up a stellar month and quarter that saw them near the top of the ranks for all the measurement periods in this commentary.
The chart above for the week shows 24 positive and 2 minor negatives. The negatives were two high quality fixed income ETFs that reflect the backup in yields. The bottom 3 were bond ETFs with US HY managing to move up the ranking to straddle the top of the bottom quartile. Duration is still an uncertain risk in this market as the cyclical wrestling match continues and the FOMC rattles its saber to shape inflation expectations.

The 1-month time horizon weighed in at 24 positive and 2 negative. The negatives came from high quality fixed income ETFs (AGG, GOVT). One of the negatives (AGG) rounded to zero on the red side of zero with GOVT a toss-up between 0 and -1.
Builders and transportation at #1 and #2 show how some of the broader market is playing catch-up and making statements on cyclical expectations. On a positive note, we see the Russell 2000 continuing its comeback while the S&P 500 Equal Weight ETF (RSP) beat the S&P 500 broad market cap weighted index on the month. In contrast, the NASDAQ continued its charge ahead of the NASDAQ 100 Equal Weight Index (QQEW).

The 2Q23 3-month period shows 21 positive and 5 negatives. The Regional Banks (KRE) are still on the bottom but with a manageable negative of -5.1%. The Homebuilder/Supplier ETF (XHB) at #1 was part of a major turn in the markets on builder prospects as the industry macro data and micro level performance and guidance came in strong (in context) as the spring selling season got underway.
Transport took the #2 slot ahead of the next four spots that were held by the usual tech and tech-heavy ETF names. Those categories have the Magnificent 7 in their mix that can somewhat wag the overall ETF performance. Industrials (XLI) and BDCs (BIZD) rounded out the bottom of the Top 10, and that performance was positive news for how the cycle and small cap credit cycle was perceived.
In the bottom of the ranks, we see high quality fixed income ETFs holding 3 of the lowest 6 returns. The high-quality bond ETFs (GOVT, AGG, LQD) are essentially half of the bottom quartile. Diversified Energy (XLE) and the defensive Utilities ETF (XLU) round out the laggards with the KRE and the bond ETFs. When equity prices are running in such broad-based rallies during a cyclical peak backdrop, it is hard for bond ETFs to score much higher.