Existing Homes Sales: Feeling a Bit Flat
A tiny tick in existing home sales brings a minute move in the inventory count.
We run through the existing homes sales trend line as inventory stays tight and keeps on helping the builders with their share of total home sales in historical context.
Existing home inventory at around 1.08 million ticked up sequentially to 3.0 months at the current low sales rate from 2.9 in April, but a low absolute number framed against a low sales rate leaves the world at status quo.
The supply-demand dynamics in housing has been picked over for months, and the above chart hammers home the historically low context for inventory even if we are well above the bottom tick of Feb 2022, when supply was scarce for very different reasons. Going from the ZIRP period of “not available” to the post-tightening condition of “not affordable” keeps the same basic effects in place of “supply-demand imbalance” all set against a housing shortfall. This time we also add tighter credit.
The golden handcuff barriers (low mortgage rate for current homeowners that will likely more than double at current rates) and affordability barriers are still having the headwind effects even as some buyers adjusted to the concept to mid-to-high 6% handle mortgage rates. Even the slight improvement in sentiment on mortgage rates does not change the economics and the self-fulfilling prophecy of “low inventory, resilient prices.”
The overall inventory vs. price relationship has done wonders for homebuilder equities and has helped fortify confidence levels of homeowners in the resilience of their home equity. Even if they expect to see some modest erosion, a confident homeowner reduces the impulse to “take the positive equity and run.” Where the circle started almost doesn’t matter anymore. The builders have built a lot of spec inventory and the high completions are up for a peak season selling test that is underway (see Housing Starts: Slow and Steady Sequential Moves 6-20-23).
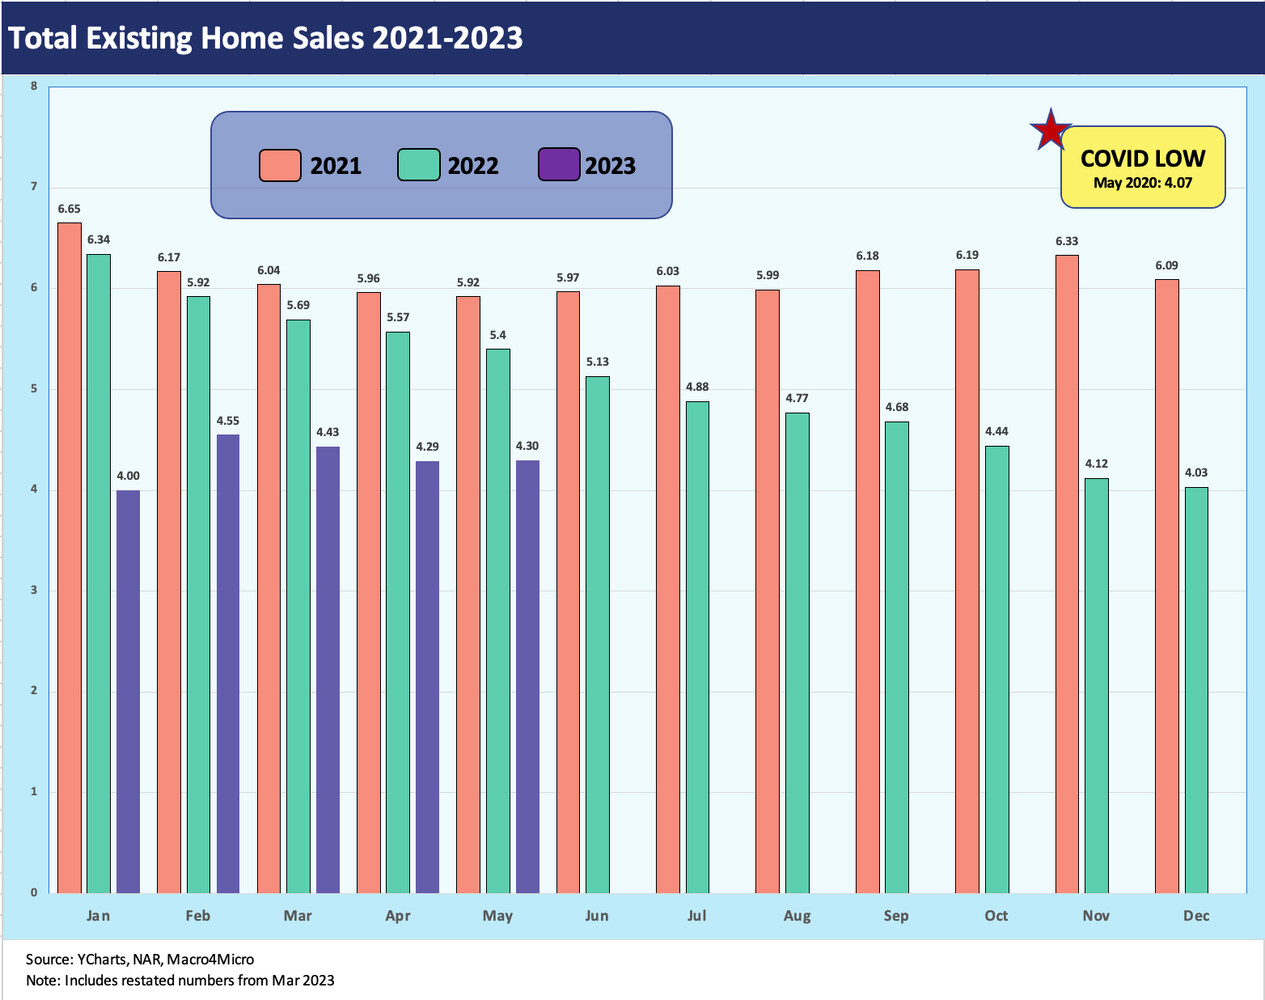
The above chart highlights the monthly numbers across 2021-2023 (May). We are off the Jan 2023 lows in 2023, but the struggle continues in the low 4-handles. May 2020 was under 4.1 at the COVID lows, and we saw that again in Dec 2022. So we are not too far away from that point.
The above chart frames the time series for total existing home sales (including single family, townhouses, condos, and coops) vs. “new” single family homes. The timeline draws a useful history of the “menu” for those shopping to buy. What is not shown is rental alternatives, and that figures into the choice list as well. We looked at the single family rental topic in some recent commentaries on D.R. Horton (see Single Family Rental: A Major D.R. Horton Asset Sale 6-6-23, Signals & Soundbites: D.R. Horton 2Q23 4-21-23). Multifamily supply is also rising as we covered in our “starts” piece earlier this week.
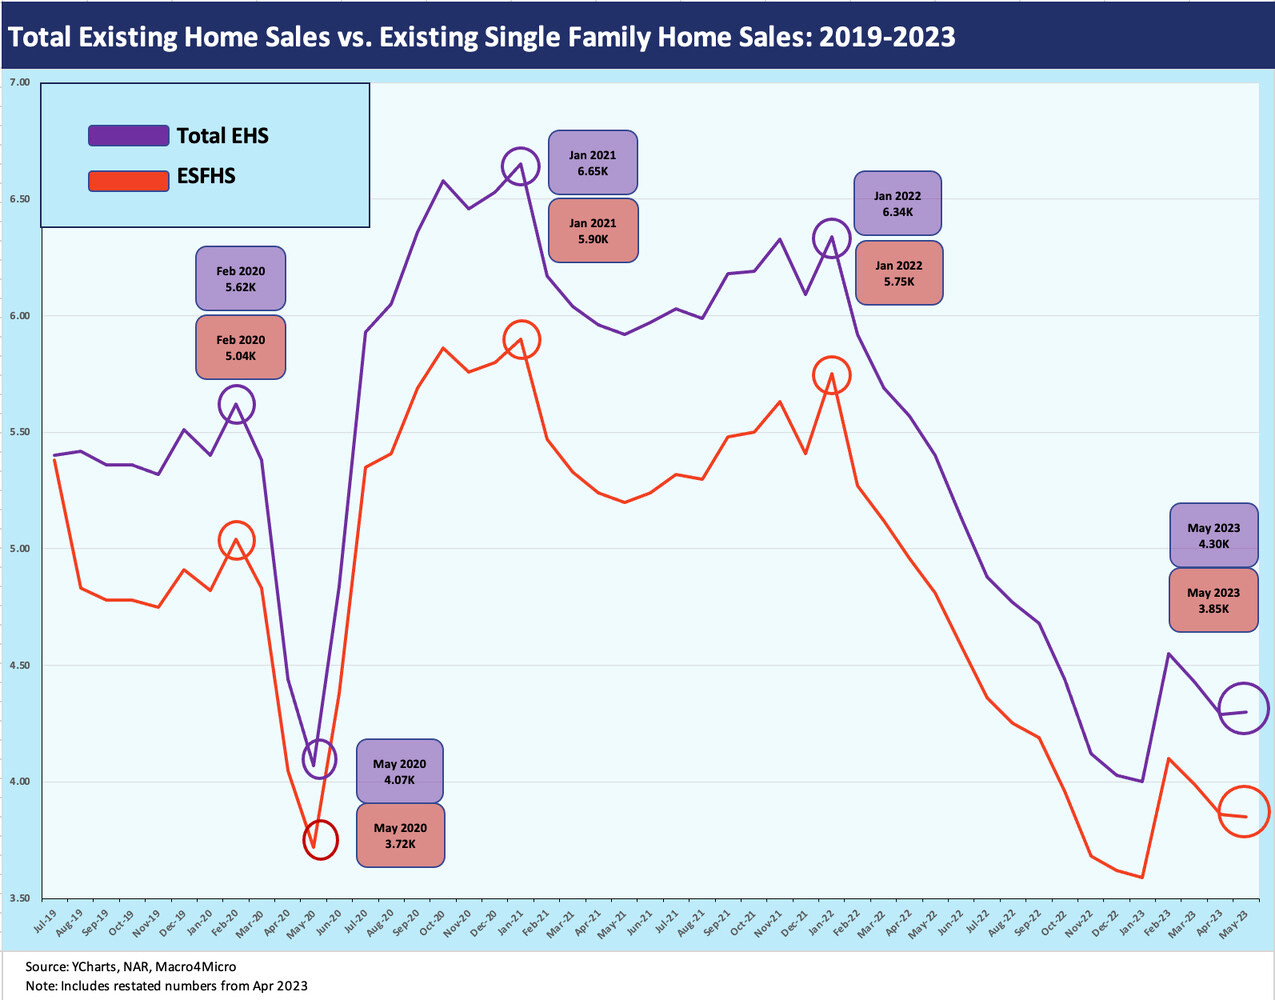
The above chart updates the total existing home sales numbers vs. the narrower metric of existing single family home sales. Both are struggling and therefore keeping a lid on inventory.
The last chart in the mix breaks out the declines by price tier while also highlighting the relative share of each price tier in the existing home sales basket. The biggest unit declines are on the higher price side of the mix. The $250K to $500K bucket is 45% of the market and is doing better than the overall decline and the price tiers above it. The chart highlights that it is not a great market for brokers.
See also:
Housing Starts: Slow and Steady Sequential Moves 6-20-23
New Home Sales: Volumes Up, Median Prices Down 5-23-23


