Jobs: Mild JOLT for May Trumped by June ADP Shock
We look at the May 2023 JOLTS data, which came in constructive but were trumped and bumped by the bullish ADP report.
The ADP numbers lit up the screen today with 497K crushing estimates by more than double with 6% handle wage increases for “job stayers” not helping sentiment.
The JOLTS numbers are reported at a 1-month lag in contrast to the timely June ADP stats, so the JOLTS lacked much impact this time around.
The May JOLTS did show a meaningful decline in job openings to 9.82 million, but that is still well above the 6.1 million unemployed.
Hires exceeded separations by 337K, which is well above median, and the Quits rate ticked up sequentially to 68.4% of Separations, also above the long-term median.
Before the ADP and JOLTS releases today, the “hawkish pause” had left the market on alert. The FOMC minutes upped the ante earlier this week. The view from many was that the minutes were counter to what Powell implied in his earlier statements in his post-FOMC comments. There appeared to be more division than his color signaled. Some felt they were consistent. Either way, the market stayed on edge and the ADP numbers sent stocks lower and the UST curve higher. The 2Y UST briefly went back to over 5.0%. That took the 2Y UST briefly back up to pre-Silicon Valley Bank levels.
The ADP numbers posted high nominal wage gains in broader context, but the data did signal some moderation of the increases in the “net wage gainers” in the overall mix of job changers. With the full June BLS employment numbers teed up for release on Friday morning, the individual line items by occupation will be worth a closer look. Away from the volatile low wage services sector, the pressure will be on the bears to point at major line items that are most vulnerable. The ADP numbers are not telling such a story.
The above chart plots Hires vs. Separations across the period from 2007. Both rise modestly in May 2023. Quits ticked up in Separations while Layoffs/Discharges ticked down, so the action was limited.
The above chart plots the Hires minus Separations Differentials, and the +337K number is comfortably in excess of the post-2007 median of +185K.
The COVID distortion factor….
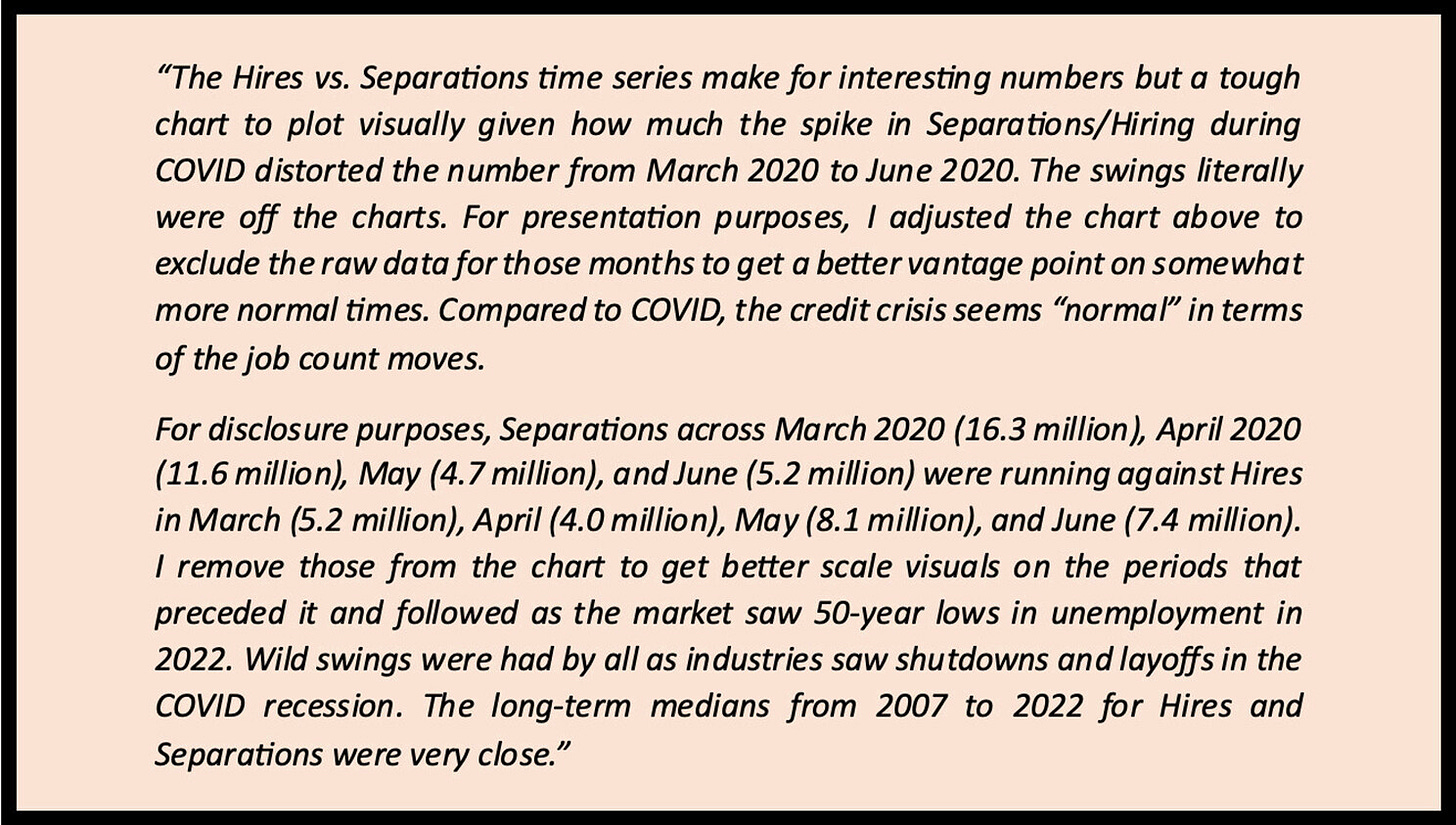
As we detail in the box below, we remove the COVID distortions from the time series for Hires and Separations. The scale of the COVID swings in these numbers badly impairs the visuals on the rest of the time series, so we isolate the effects.
The above chart plots the Quit rate as measured by Quits % Separations. It is often used as a signal of confidence of finding a new job (as opposed to loathing your employer so much you just don’t care).
All in all, the JOLTS numbers draw a bye this month for any market significance given how high the ADP number was. Friday’s employment report will be the pivotal decider on how anxious to get about the next round of Fed hikes.


