Employment April 2023: Post-COVID Deep Dive by Occupation
We look at April 2023 employment and do a deeper dive into the occupational breakdowns and deltas since January 2020.
"All time high in payroll...what could possibly go wrong?"
We look at the moving parts of April 2023 payroll as the Fed likely raised at least one eyebrow after the solid numbers and higher wage inflation.
We also add a deep dive into the raw numbers and job deltas across a range of occupational categories from the start of 2020, across COVID, and on an LTM basis.
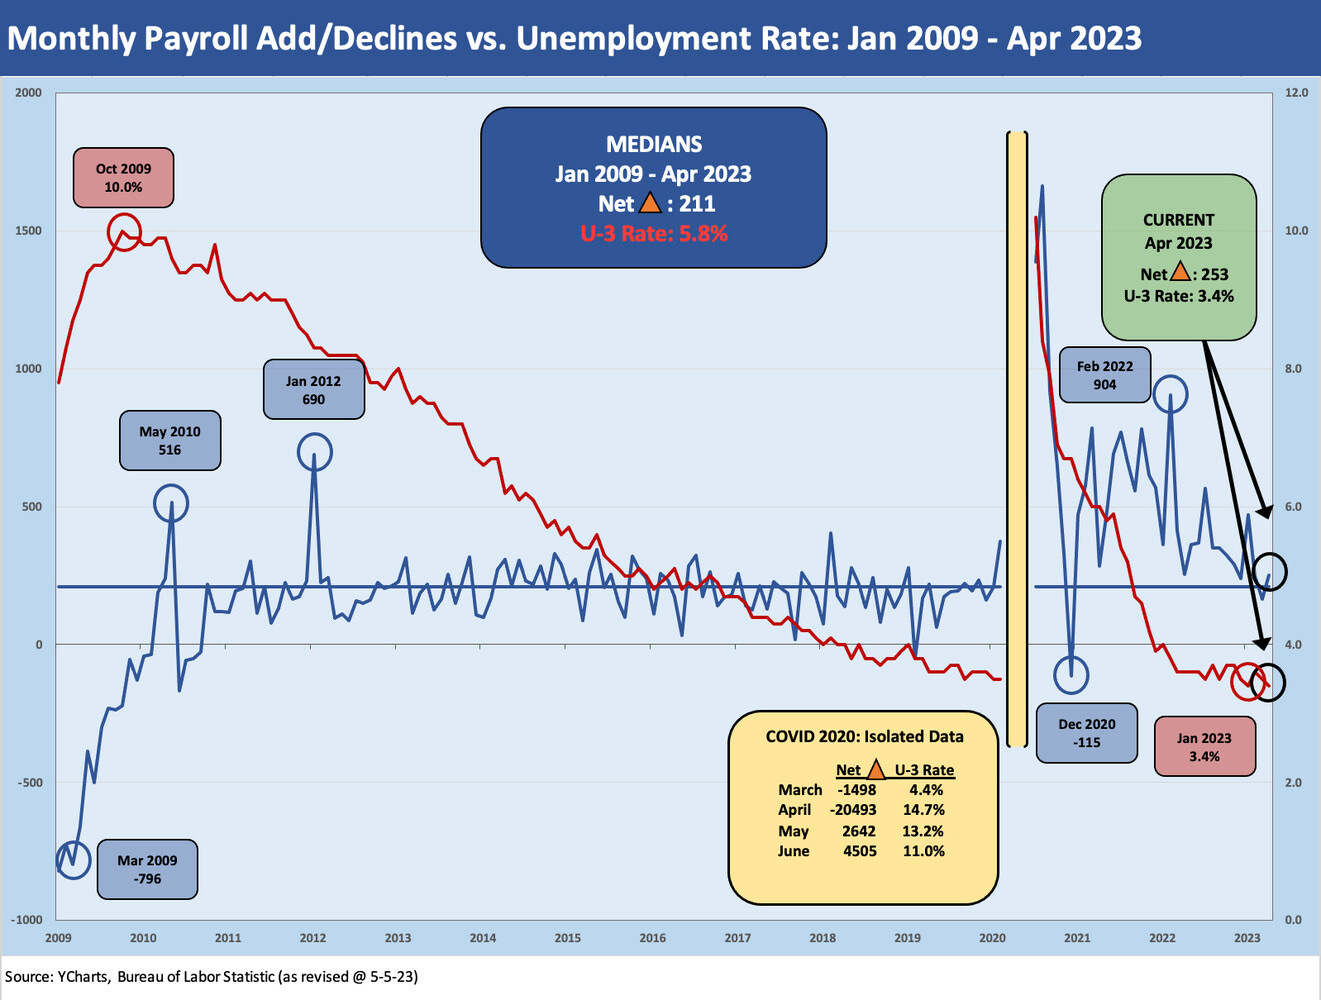
The above chart breaks out monthly job adds as the +253K job adds tally for April 2023 brings yet another new record payroll count. The job adds numbers were well above the consensus forecast around +180K, so life will stay interesting in the policy handicapping exercise.
The monthly jobs drill comes on the heels of the FOMC’s 25 bps hike and the ongoing “argument” between the Fed and the longer segments of the UST yield curve. Inversion says “recession” while tightening signals a hot labor market and solid demand in the real economy. The earnings reports were mixed in guidance but were very strong to stable across many bellwethers.
This jobs trade-off vs. inflation is not a new debate. Professors have been 100% convinced on both sides of the 180-degree opposites for years. We listened ringside to more than a few in the late 1970s and early 1980s. For now, the friendlier YoY CPI and PCE math during the 2Q23 period and into the summer will help. The better headline numbers will keep pressure on the Fed to pause, but the sticky services inflation has been a hard factor to control.
The recent services inflation doesn’t offer much support to those who keep screaming “stop before you break more things.” We will keep looking at employment’s FOMC overtones and the broader mix of market debates in other commentaries, but for this employment release today, we see no relief.
Besides the job count coming in well above consensus expectations, average hourly wages came in at +4.4%. That wage inflation factor is an uptick and is consistent with what we continue to see with Services jobs in the lead (see Employment Cost Index: Slow Motion 4-28-23). The unemployed ranks ticked down to 5.7 million and the unemployment rate went back to the lows of 3.4%. The simple story is still that more jobs mean more consumers with money in their pockets (even if week to week), and that feeds PCE under the “Mo Jobs, Mo Money, Mo Spending” theory. Economic growth goes beyond just PCE, but that is over 2/3 of GDP (see GDP 1Q23: Devils and Details 4-27-23).
The wage inflation factor reassures that there is less sequential erosion of purchasing power even if there has been a loss of purchasing power over the past year that will not be recovered. The fact that inflation has been a curse on so many economies for longer term prospects is hardwired into most economists. They see that it must be addressed.
The jobs numbers certainly do not make Powell or the balance of the FOMC players “feel wrong” on the latest move. The theory is that credit contraction will do the work from here, but April was the first full month of impact in the post-SVB world of regional banking anxiety. Jobs still came in strong.
The above chart plots monthly payroll adds/declines vs. the unemployment rate from the beginning of Jan 2009 when the credit crisis was in full swing. The period subsequent to June 2009 became the longest economic expansion in history but came crashing down with COVID. We break out the COVID job adds/declines in the box embedded in the chart. Including them in the time series would have seriously impaired the visuals of the chart.
We highlight the post-Jan-2009 median unemployment rate is 5.8%, and that is a long way off from 3.4%. To get back to the median area of that period, the market would need to see more than another 3 million in the unemployment ranks. That is only to reach the median! The employment tradeoff vs. inflation is never an easy debate in the context of monetary policy. The crippled fiscal machine at this point could change the dynamics very quickly with an UST default.
This policy crossroads is where the humanity of the job issues (therefore politics) comes into play in the battle with the economic models and theories. History books have been very kind to the success of Volcker inflation fighting, but things were very noisy at the time. This is how elections can get swayed. Reagan faced a 1982 midterm just as the double dip recession was winding down. The GOP was able to hold the Senate, and the Democrats kept the House (but added seats). In other words, the recession and tough monetary policies did not flip Washington. The economy was booming by 1984.
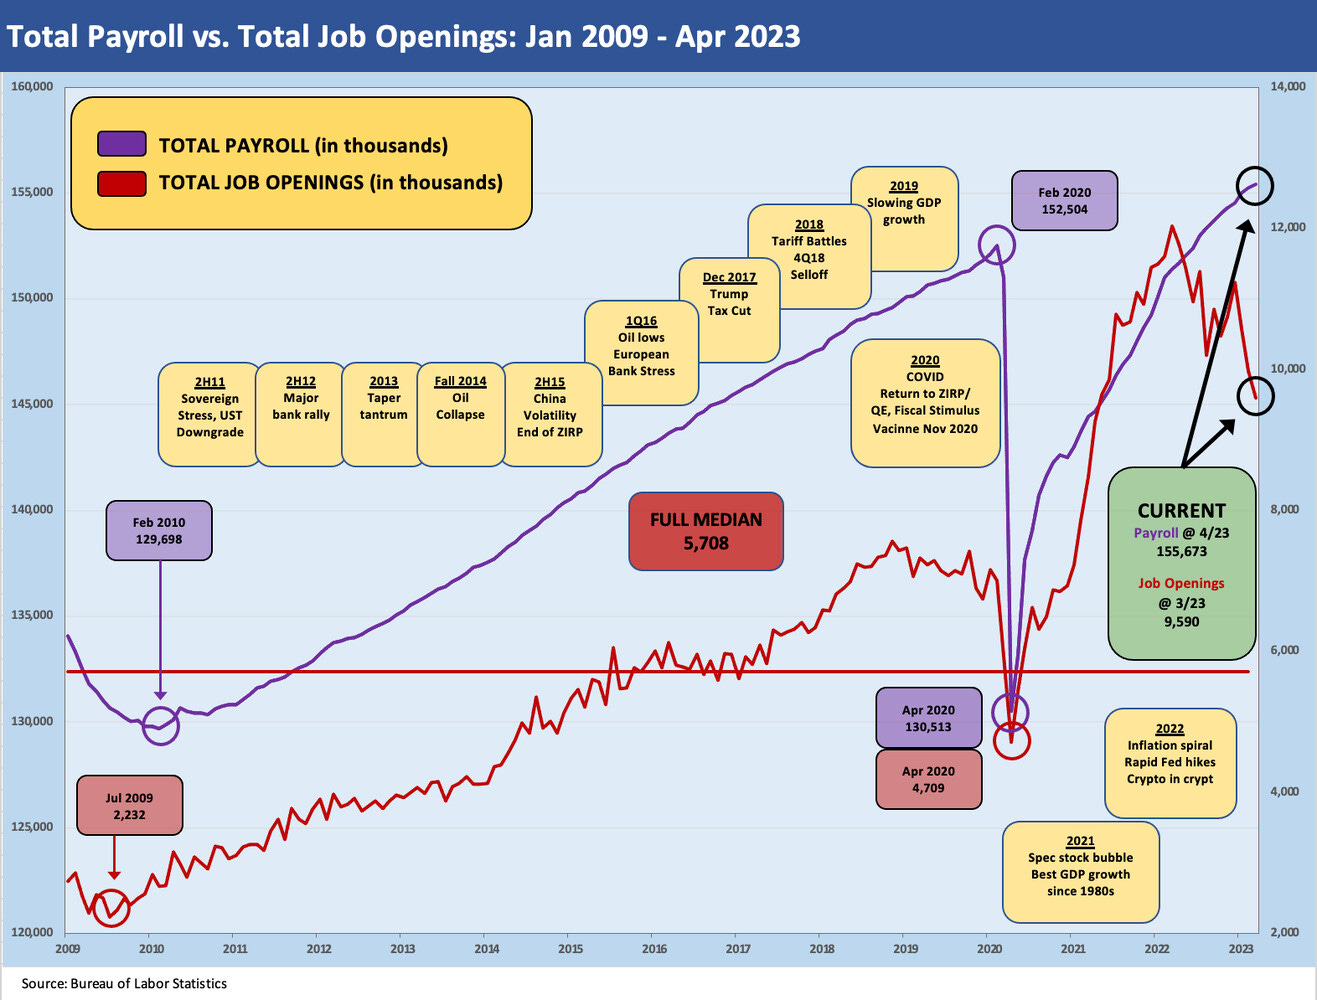
The above chart updates total payroll count vs. unemployment rates for another angle. Record high payroll is not a bad news item for voters, but too many voters are bathed in hate and disgust at this point from different sides of the spectrum to see employment as a differentiator in political views. It does not get the headlines.
The swing vote on jobs vs. inflation is left up to the growing ranks of the independents. At this point the debate can roll its own side of the issues whether “Inflation is too high and hurting consumers” or “Payrolls at record high, lowest unemployment in 50+ years, and rising wages.” The independents can add them up and divide by two. If we see 3 million more unemployed by summer 2024, that will not be a tough call if someone can be blamed in semi-articulate fashion.
The above chart just drops in the job openings data from the recent JOLTS report (see JOLTS March 2023: Inclement…but Surf’s Up 5-2-23). We frame JOLTS (which lags a month) against the total payroll count. It is hard to look at that many job openings and expect a jobs decline without a major shock (House of Representatives on Line 2).
Digging into the occupational line items…
In the next series of charts, we are looking to get more granular by occupation and frame payroll trends by major job lines in Manufacturing and Services. The monthly BLS release has a lot of pages and lines, and this exercise is meant to streamline the data down to payroll headcount by major categories.
We slice the data in a few ways:
We look at the January 2020 start date: We start just ahead of the COVID turmoil. In the “delta column” we derive cumulative changes in payroll from Jan 2020 to April 2023.
We look at the April 2022 details: We use this for an LTM change in payroll and a year that featured inflation and aggressive monetary policy action.
We break out the April 2023 line items.: This is the measuring stick for up and down as the job market hit an all-time high in payroll with today’s release.
In prior lives, we would frame the changes in headcount back to Dec 2007 to look for secular decliners, aka “jobs that are never coming back.” We will get back to that in coming pieces, but the world stage and the geopolitical stress points may be revising the longer-term view of which jobs may return sooner rather than later. This opens up a lot of theories and topics around trade and industrial policy. That is for another day.
Employment from the top down…
The above table essentially summarizes the mix and trends across Public and Private Sector employment, Goods-producing and Services, and the main lines under Goods (Manufacturing, Construction, Mining/Logging).
Since Jan 2020, we see over 3.5 million jobs added in the private sector and just under 500K in Government jobs. That totals just under 4 million jobs representing a 2.6% increase. As the market data has hammered home for years, the prime driver of employment growth and the total of jobs is heavily tied to private service-producing jobs. We see an additional 3.1 million jobs added in Services LTM from April 2022 for a big share of the total 3.3 million Services jobs added since Jan 2020.
The total LTM Goods-producing jobs added 472K. We look at the occupational mix of those changes in the following charts. Manufacturing and Construction have both done well on an LTM basis by growing even in the face of rising rates and high inflation. As an aside, Mining/Logging includes the E&P sector as well. The potential for increased E&P and Metals/Mining payroll in part will come back to government policy actions. Mining/Logging payroll is lower since Jan 2020 with E&P essentially flat on an LTM basis.
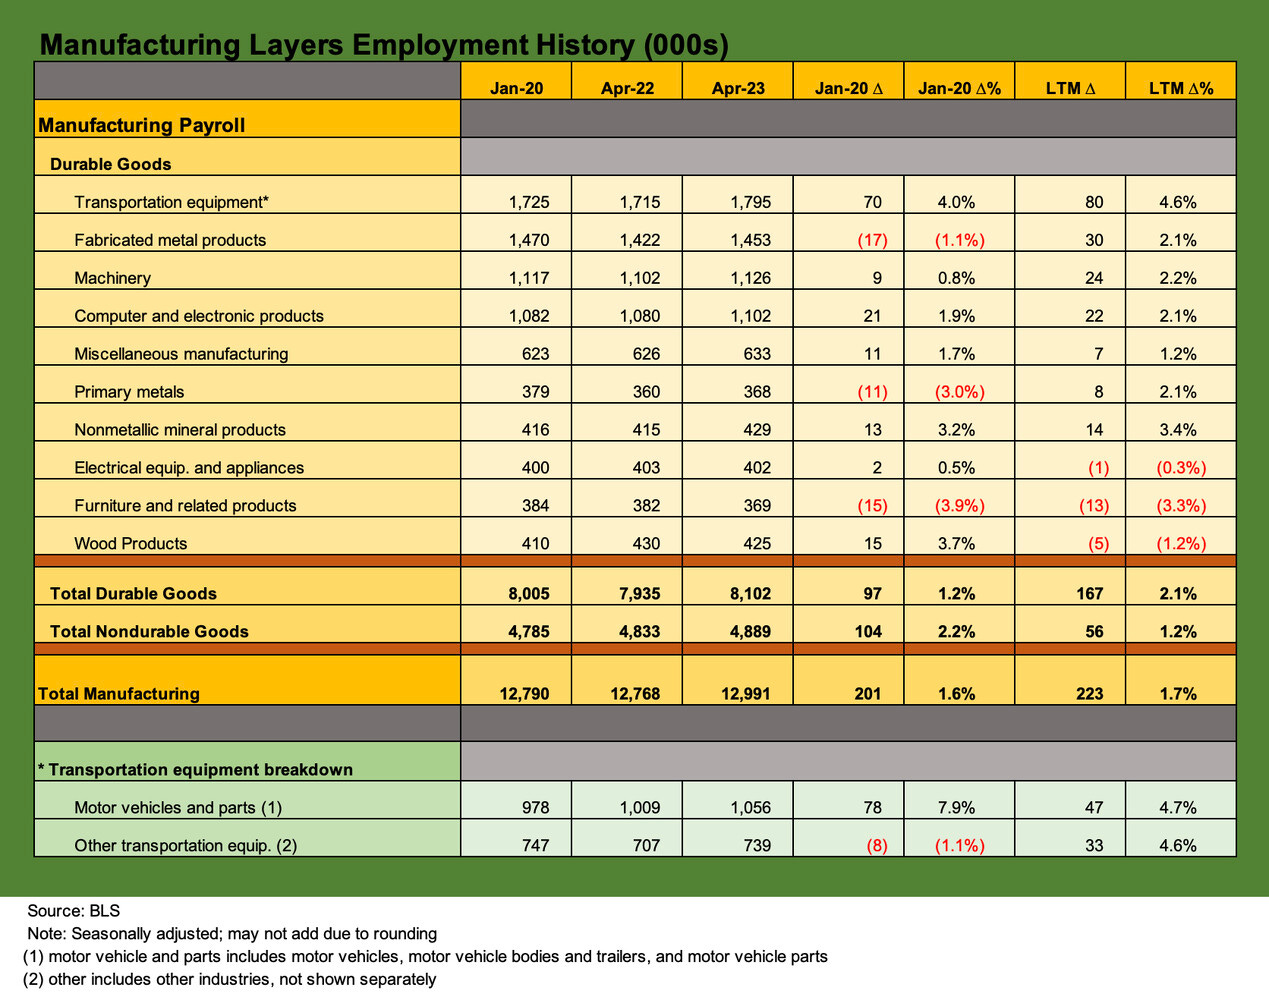
The above table details the Durable Goods line in the BLS payroll count. Durables total 8.1 million vs. 4.9 million for Nondurables. The needle has not moved much at all since Jan 2020 on Durables at only +97K or +1.2% while on an LTM basis we have seen more strength at +167K or +2.1%. Since Jan 2020 the only material move has been in transportation equipment at +70K or +4.0% with 80K of that in the LTM period. Motor vehicles and parts comprised the bigger factor in that move as detailed at the bottom of the chart. Overall, the move in manufacturing is not much of a renaissance.
The above chart breaks out the Nondurables categories, and the news is also unimpressive in terms of job adds. Exceptions include Food manufacturing (rising population, more mouths to feed, more health codes, etc.) and the Processing industries (chemical and the downstream petrochemical derivatives). The 2.2% increase since Jan 2020 and 1.2% LTM is a small factor in the overall employment picture.
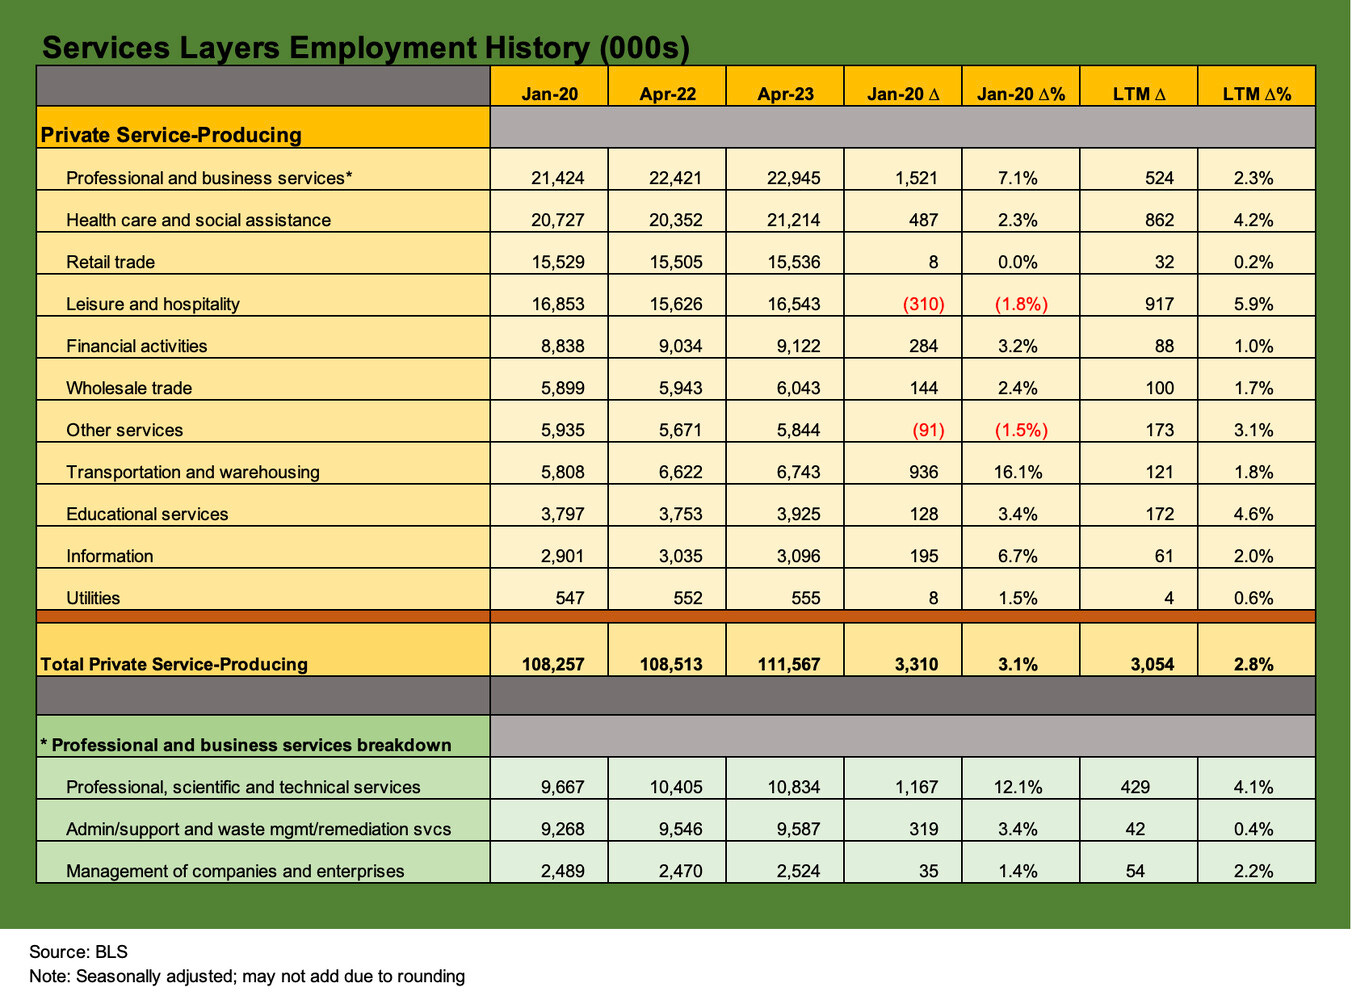
The above chart confirms what we all know in that the payroll leadership is all about Services. We see over 3 million jobs added on an LTM basis in Services and 3.3 million since Jan 2020, so the LTM period was very busy even with inflation (and helping to cause more) and despite adverse UST curve shifts.
On an LTM basis, the leadership of Leisure and Hospitality and Health Care and Social Assistance combine for almost 1.8 million of the 3.0 million Service jobs added. Professional and Business Services is a distant third.
We will be looking into some of the subcomponents of these categories in future pieces. This series of charts offers food for thought. The role of Leisure and Hospitality and Health Care is not exactly in the multiplier effect categories.
The reshoring and supplier chain risk mitigation themes will be hot topics for both investment and payroll in coming quarters and years. Too many changes in global politics and risk management will make that a necessity. Some of the trends are about demographics (health care/social assistance) and some are about top-down priorities and trade law conflicts ahead and cartel risks and quite a few sanctions (manufacturing, mining). Expansion in manufacturing will flow back into construction and energy sectors.
Many moving parts remain to be sorted out in what will be an event driven market with a lot of domestic politics and geopolitics.


