Footnotes & Flashbacks: State of Yields 6-18-23
We look at the latest move in yields after this past week’s CPI and FOMC release.
“Hawks can get moody fast.”
We update a cross-section of our yield charts to frame some “morning after” visuals following a very unusual set of inputs from the FOMC.
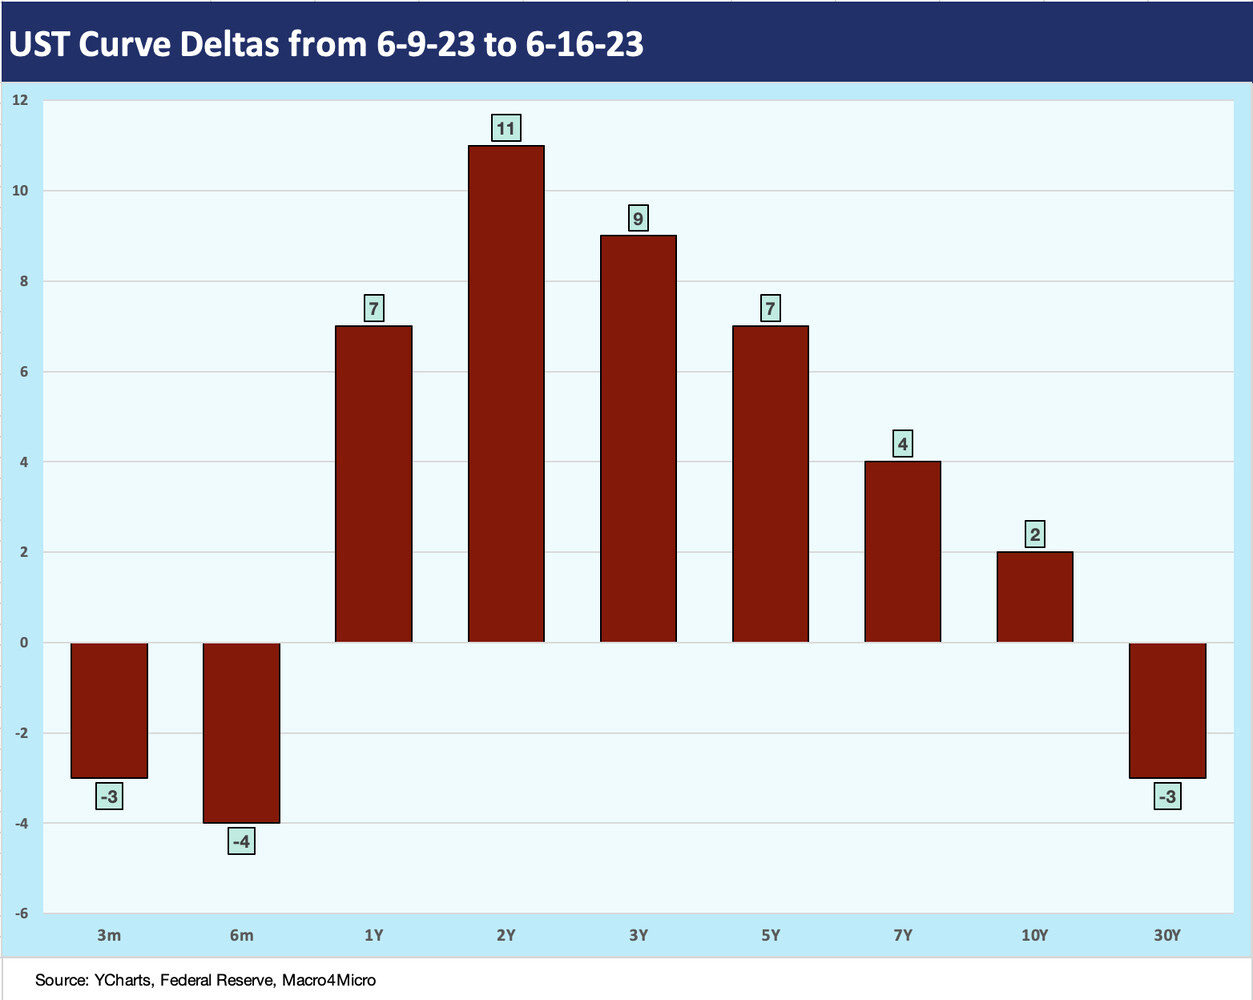
The UST deltas the past week had a bear flattener flavor from 1Y to 10Y UST even as the 3M UST yawned.
The inversion from 3M to 10Y UST to end the week still trumps earlier inversion peaks from 1984 through 2022 even if below some earlier 2023 peaks.
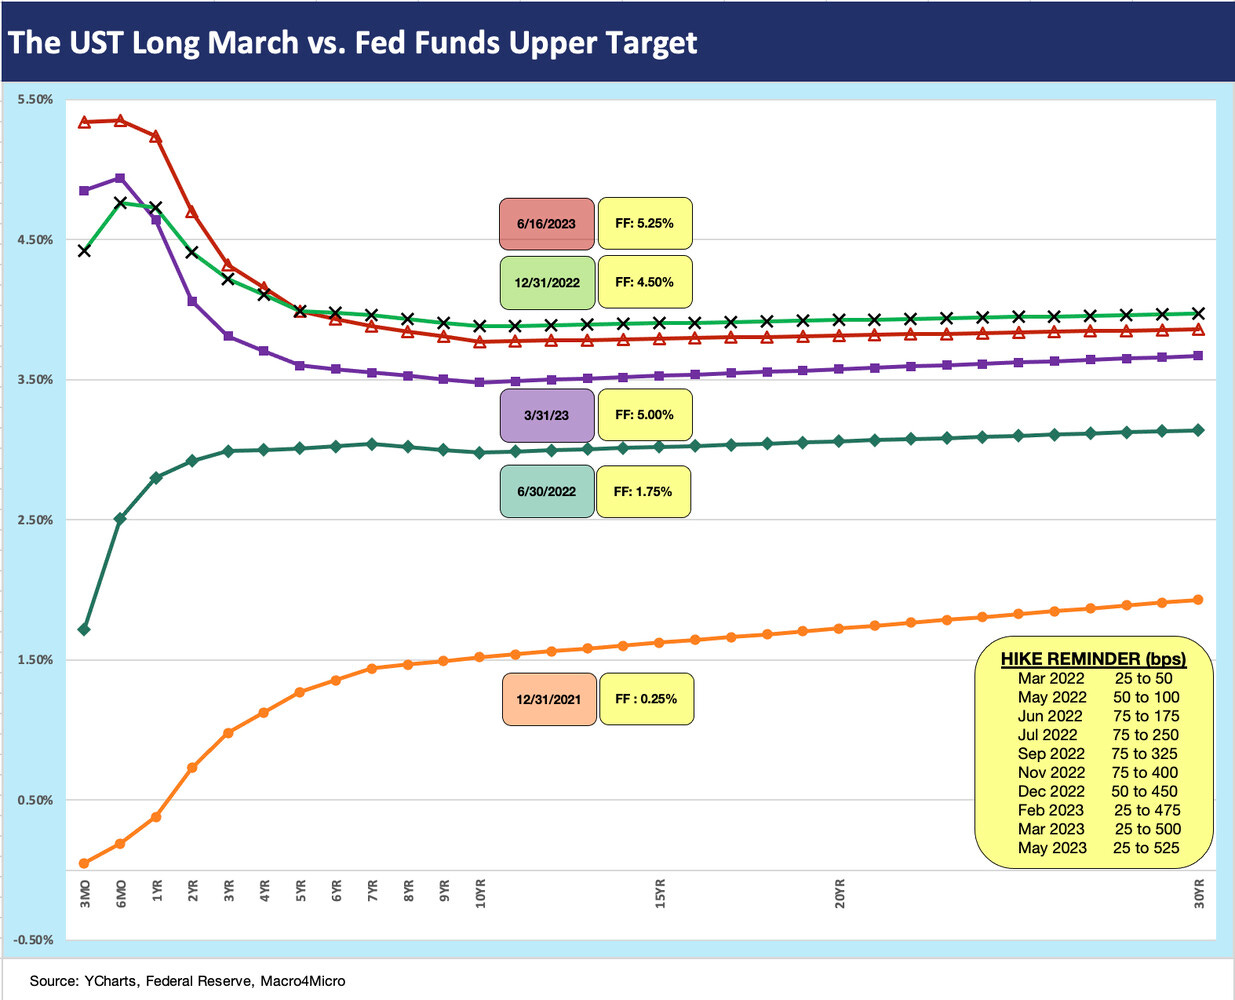
The chart above plots the upward migration of the UST curve since the end of 2021 as the inflation trend line was already getting ugly. The year 2020 ended with a 1% handle on CPI and then hit 7% by Dec 2021. Then the yield curve fun began in 2022 when the Fed decided to finally get moving. War in Europe raised the stakes for pricing stability.
We include a “hike reminder” box in the lower right with the dates. The hawkish pause of this week (see FOMC: Hit Squad or Suicide Squad 6-14-23) after a mixed CPI report earlier in the week (see May CPI: The Big 5 Buckets and Add-Ons 6-13-23) has the market paying attention to the risks of a negative surprise after so many were expecting easing in 2H23.
The chart highlights the pace and magnitude of the upward migration as the duration price impact was punishing on asset returns in 2022 (see The 2022 Multi-Asset Beatdown 12-31-22). The LQD IG bond ETF was getting treated like a bad stock at -17% for the full year.
The UST inversions grew in a hurry with tightening still the order of the day and the cyclical doubts of the UST market flashing recession risk. With the equity rally and Fed tightening of 2023, the market constituencies (Fed, UST, equities, credit spreads) are now more in conflict than we have seen for quite a while. The recent end of the bear market for the S&P 500 and leadership of tech equities has kept the stock market debate alive, but there is a decided mix of pros and cons.
There is no hiding from the reality that working capital funding and refinancing costs are materially higher, the consumer is leveraged, and credit market default rates are getting revised steadily higher for 2023 and 2024. Banks need to tighten credit and are staring at squeezed interest margins and provisioning pressures.
In the rebuttal camp, record high payrolls, labor shortages, and a number of secular real economy project demands with both legislative and private sector support growth across semis, infrastructure, EV multiplier effects (batteries, assembly plans, suppliers), and key areas of Energy such as LNG. These are not theories (like the bear scenarios) and are in the construction numbers and the supplier chain multiplier effects (materials to goods and services).
Those who need an excuse to be negative don’t have as many major items on the list now. The debt ceiling default risk (which was a major worry to us) can’t be kicked around anymore. While a government shutdown could loom on a budget impasse in the fall, that is not a systemic event even if it offers a reminder of policy dysfunction.
The above chart details the UST curve deltas by maturity, and we see another upward move in the 1Y to 10Y between the small move the other way on the short end and long end. The economic news has been sequentially constructive in some key areas (jobs, construction, housing), the stock market has been favorable even if lacking breadth underneath such good headline numbers, and the consumer buzz has been consistently strong. Inflation is well under the peak, and some easy arguments can be made that it is overstated due to the quirks of how “Shelter” is measured.
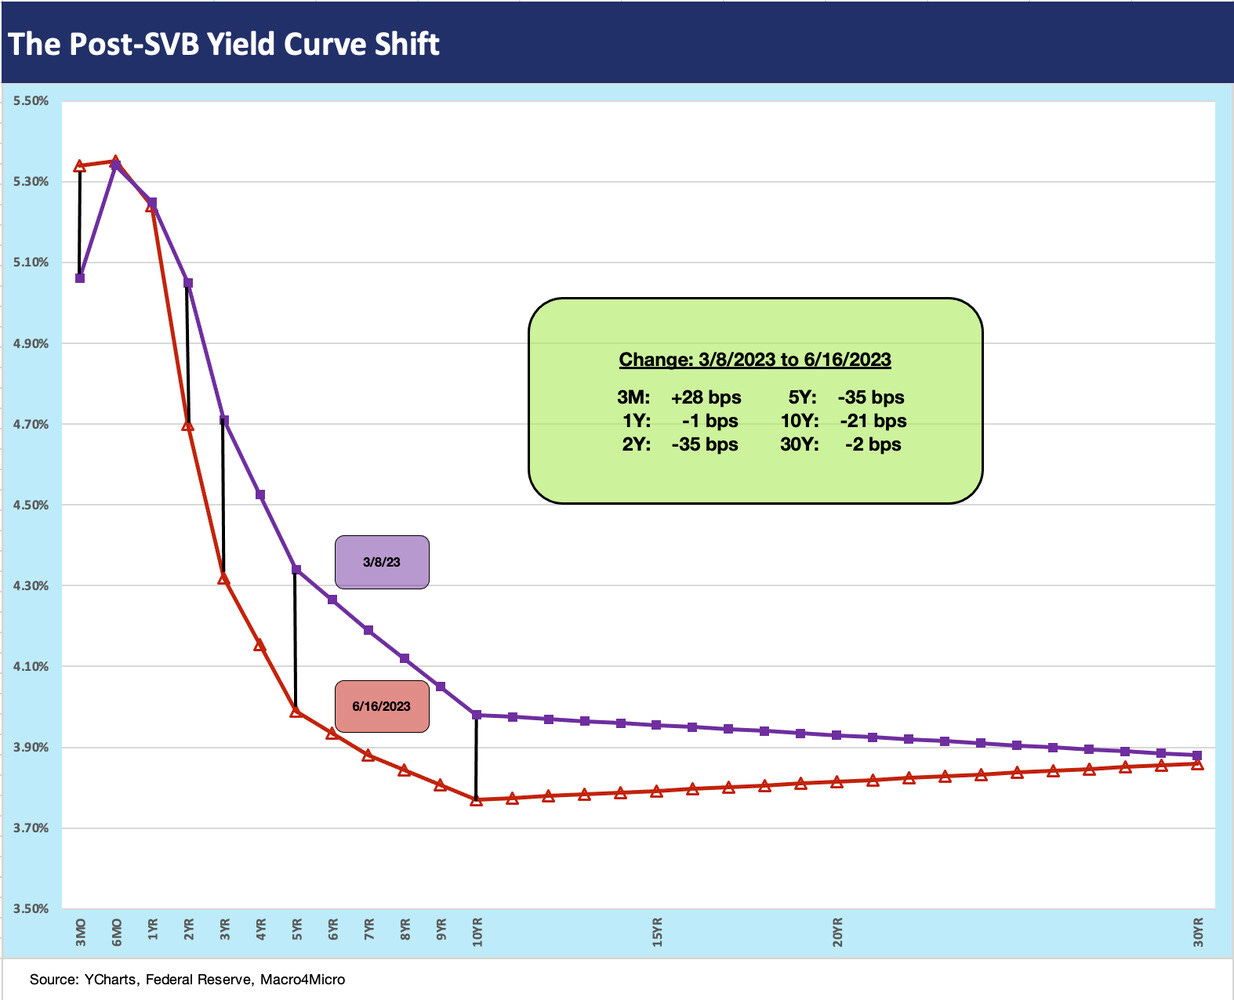
The above chart shows the running UST deltas since the Silicon Valley Bank collapse. The regional banks deposit panic has generated a curve effect since March that is still in evidence and supports returns. The hawkish threats of last week on tightening is still a risk factor for regional banks even if just on deposit costs.
One of the worries in the market for those with higher quality bond positioning and more duration exposure is about the sustainability of an inversion if fundamentals remain favorable. That is when the bear steepener risk could pick up. That supports HY > IG in total return if that unfolds. There is plenty of thinking on the other side that HY OAS is more vulnerable than duration. That has been my view with below median HY spreads in a precarious market. We still vote with IG over HY and/or higher quality HY through 2H23 over risk maximization for the more asset class constrained (i.e., HY mandates).
The patterns got more complicated after the Silicon Valley spiral effect, and the chart above plots the UST curve shift from March 8 just before the regional bank nerves generated some shapeshifting. The regional bank effect could be called a bull steepening as 2Y to 5Y UST declined more than the long end. Meanwhile, the short end pressed higher on the Fed effects.
The old rule is the Fed controls the front end and the market the longer end, and the disagreements across asset classes and UST term structure are there to debate. The equity markets just went in another direction but with a concentrated mix of equities and the “Magnificent 7” effect (see Reversal, Takedown, or Escape? Market Weighted vs. Equal Weighted 6-6-23).
The above chart updates the 3M to 10Y inversion with a -153 bps inversion to end last week. That is more inverted than the peak inversions of 1989, 2001, 2007, and 2019. The peak in May 2023 was -189 bps. Whether you see recession lurking on the other side of the inversion (recessions are always lurking eventually) or see better value in parking in cash for 5% handle UST rates on the short end, there is no getting past the fact that this is a very strange and protracted period of inversion looking back four decades. If we go back more than four decades, we see -373 bps for 3M-10Y in Dec 1980 (not shown), but that Volcker inflation war is a separate topic better handled in a separate note.
The 2Y to 10Y slope is the heart of the corporate credit market given its relevance to both the IG and HY corporate bond markets. We are again at an inversion high relative to the early 1984 to early 2023 timeline. The peak inversion was seen in March 2023 just ahead of the SVB meltdown at -107 bps. The regional bank panic then had the effect of pulling the 2Y lower as noted earlier.
The above chart updates the running UST migration since ZIRP ended back in March 2022. We also plot the end of 2020 as a frame of reference when 1% handle CPI gave way to a sharp rise in inflation in 2021 into a peak in mid-2022. The boxes detail the UST deltas to Friday close, and we also keep a box framing the UST deltas to the March 8 date that marked somewhat of a peak for the curve.


