Housing: Starts, Permits, Construction, and Cyclical Moving Parts
We put the most recent residential stats in the context of the recent banking turmoil and sector asset performance.
"Rates are down. Time for a Master Planned Community.”
Solid sequential increases in permits take some of the edge off a bad week of news flow in the bank system and economy, but low cyclical single family volumes remain the reality.
Multifamily drove the sequential starts number while single family was up slightly with construction, completions, closings and inventory liquidation will be the main story line for builders into the spring and summer selling season.
The slowdown in starts activity YoY means steady inventory liquidation and free cash flow generation for the builders on the cash flow statement set against a backdrop of shrinking gross margins on the income statement.
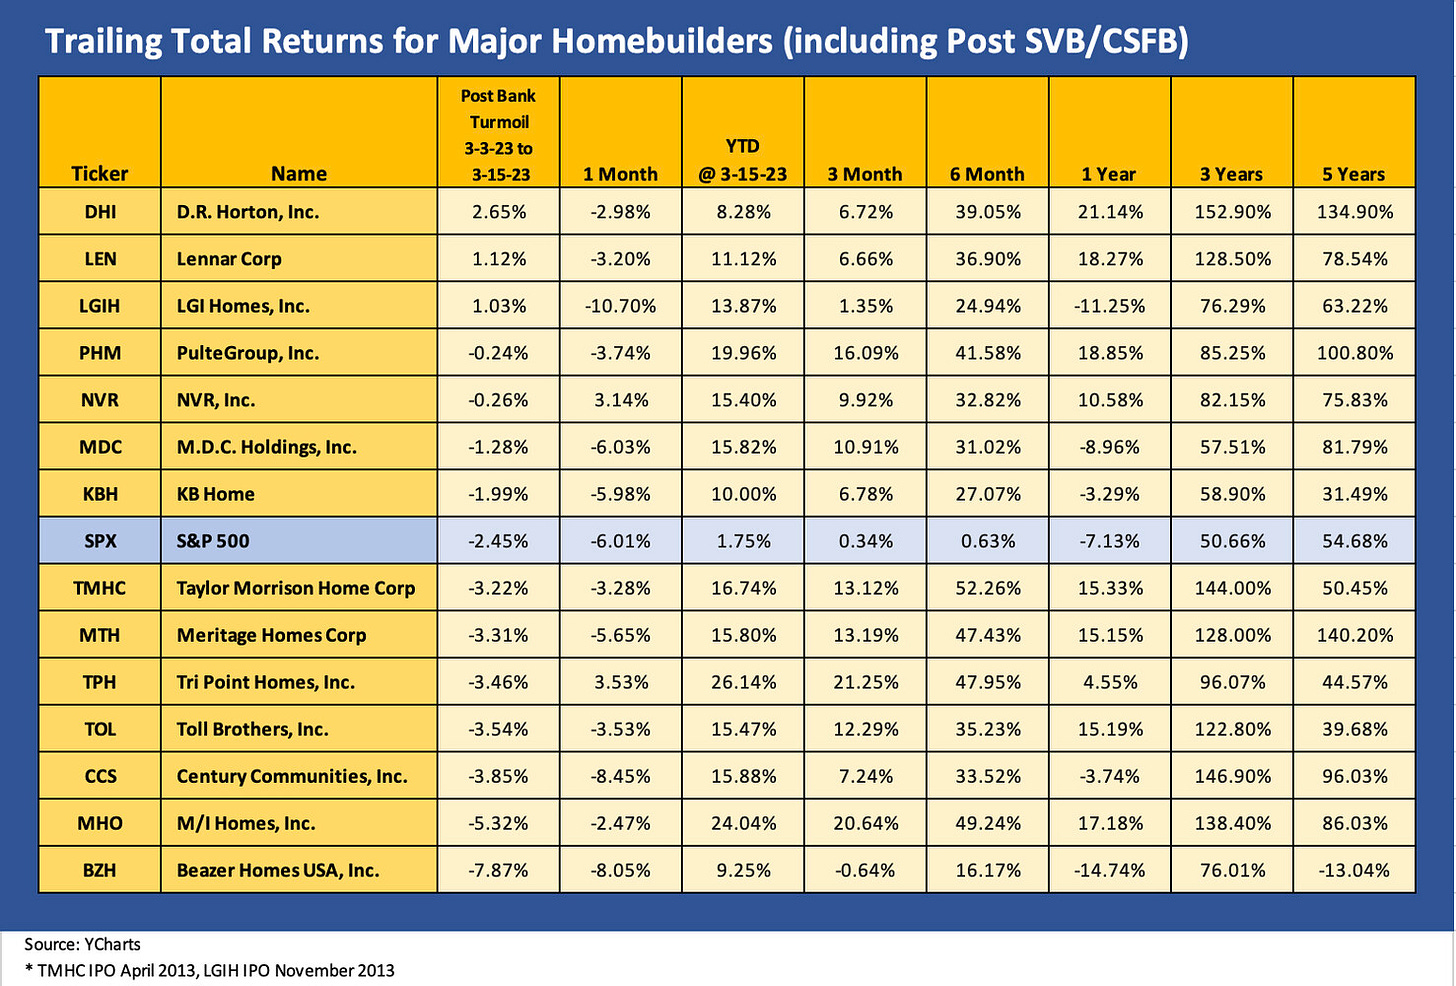
We look across some trailing stock returns in the mix and update for the price action since the new start date of “Banks Nervosa” symptoms (we date that March 8).
In this commentary, we frame the significance of the monthly starts and permits trends from the “New Residential Construction” release from the Census for February. We also give some asset performance context. The headline story is consistent with the stabilization theme and increases the sense that the market is coming off the bottom. We saw that starting last month (see Housing Starts: Pressure On But Holding Together 2-16-22) while Dec 2022 was more about the stabilization story as well as the crucial role in the current market of the Multifamily sector (see Market Menagerie: Home Starts, Permits, Construction - Dec 2022 1-19-23).
The chart above provides some history across the cycles and includes some median numbers for key time segments along the way. There is little question we are operating in an especially and almost unnaturally low volume environment given the demographic trends and supply-demand imbalances in housing. The starts number at 830K for Feb 2023 is well below the long-term median despite a record population and record numbers of workers on payroll. The Jan 2009 to Feb 2023 median line for starts is well below the historical median despite the supply-demand dynamics.
Even with mortgage rates bouncing between 6% and 7% in recent months (around 6.5% area as we go to print in the aftermath of the UST rally), there is supposed to be a level of natural demand that sets a floor for builders. That helps you sleep at night owning the bonds or the stocks.
For builders, the question is about price and mix and how that all dovetails with supplier chain costs for a gross margin that will be lower but “gets the job done” across this period of monetary and cyclical turmoil. As we detail below, builder securities have done well, but the direction of the overall market and economy just moved from a healthy bull-bear debate to what is now a consensus of trouble ahead. The bank system and credit markets are now showing some signs of structural problems and growing defensiveness in risk appetites (see Risk Appetites Get Bloodied 3-15-23). We expect housing to hold up from here.
Supply vs. demand debates continue as does the question of “Supply and demand for what?”
The interplay of new vs. existing home sales is always interesting, and the exercise of “solving for X” will be tricky with “X” being the supply of homes to buy or rent. The trade-offs of single family construction, single family rentals, and waves of multifamily building coming online in the market are more important than ever in a market where affordability was so rapidly impaired by the spike in mortgage rates (the same yield curve move that crushed SVB).
A world of inflation fixation is now joined by a return of bank risk fixation. The inflation numbers remain a major driver of monetary policy as the ECB just demonstrated with its hike in a market with CSFB blasting across the headlines. Will the Fed go European with hike envy? We will find out next week.
The supply of housing options and what consumer preference will look like in a nervous market is a big variable. We see the growth of REITs in the rental space (public and private). We see major builders targeting the rentals space with bulk orders (e.g., LGI Homes) and industry leaders (e.g., D. R. Horton) directly entering the single-family rental space while being opportunistic on bulk sales from that business line.
Multifamily and single-family rentals overlap in the supply estimates with existing home sales potential. The latter has been plunging (see Existing Home Sales: Still in Freefall 2-21-23). Supply and demand still will meet at a market clearing price, and the regional variances and price tiers will get more important again with the South region such a major factor in residential construction (Note: in the Census numbers, the South includes Florida and Texas even if homebuilders often frame their geographic segments quite differently).
What is the stock market saying?
Stockholders need to be forward looking, and that has been in evidence since the 1Q22 beatdown on homebuilder equities. Below we frame total returns across the major public homebuilders. We add a few more builders this time below the Top 10 names. The YTD and 6-month periods are not signaling much worry even if the recent return to 7% before the SVB and CSFB “cyclical head slap” shifted the curve dynamics again. Credit contraction is never a good thing for housing even if rates do go down.
Below we do the same stock return exercise for a range of issuers from the Real Estate Services subsector. We have looked at some of these in recent weeklies and in a recent credit profile on Anywhere Real Estate (formerly known as Realogy, see Credit Profile: Anywhere Real Estate 3-1-23). Most of these companies march into battle on volumes and commissions, and the news in housing for both new and existing remain a bad story for volume.
The list above is dominated by online business models and agent-related commissions revenues. The fact that the curve shifted lower has given a boost to long-duration equities. That is an ironic twist on the reality that long duration assets in fixed income is what got this problem rolling along in the first place.
Business models that need existing home sales volumes to be much stronger are in deep trouble right now. They tend to be minimally profitable or outright bleeding at the EBITDA line. Those business lines that need bank support and a “long duration” view of their business might see lenders being less inclined to extend as much credit as before. The chances are high that a need for cash will not be as easy as saying “SVB is on Line 2 with terms.”
The move in mortgages rates is intrinsically positive for existing home sales in theory, but anxiety can have very different effects on sentiment and confidence (e.g., “I better sell now with mortgages ticking lower but before the recession” or “I better sell now and save my cash in treasuries before my home equity starts to decline more.”). As with depositor confidence, the willingness to pull the trigger on a major home buy/sell can be about more than pure economics. There is emotion and sometimes fear in the decision.
The expectation is that natural demand and readily evident need for housing will rule over the next few years. Some of the builders have been saying they are closing sales later in the construction cycle and doing more spec homes to have move-in ready home when the peak season sets in the mortgage rates may very well be lower again. They have a higher mix of lot options now to hedge the risk of being wrong.
Starts and permits showing some positive moves off the bottom…
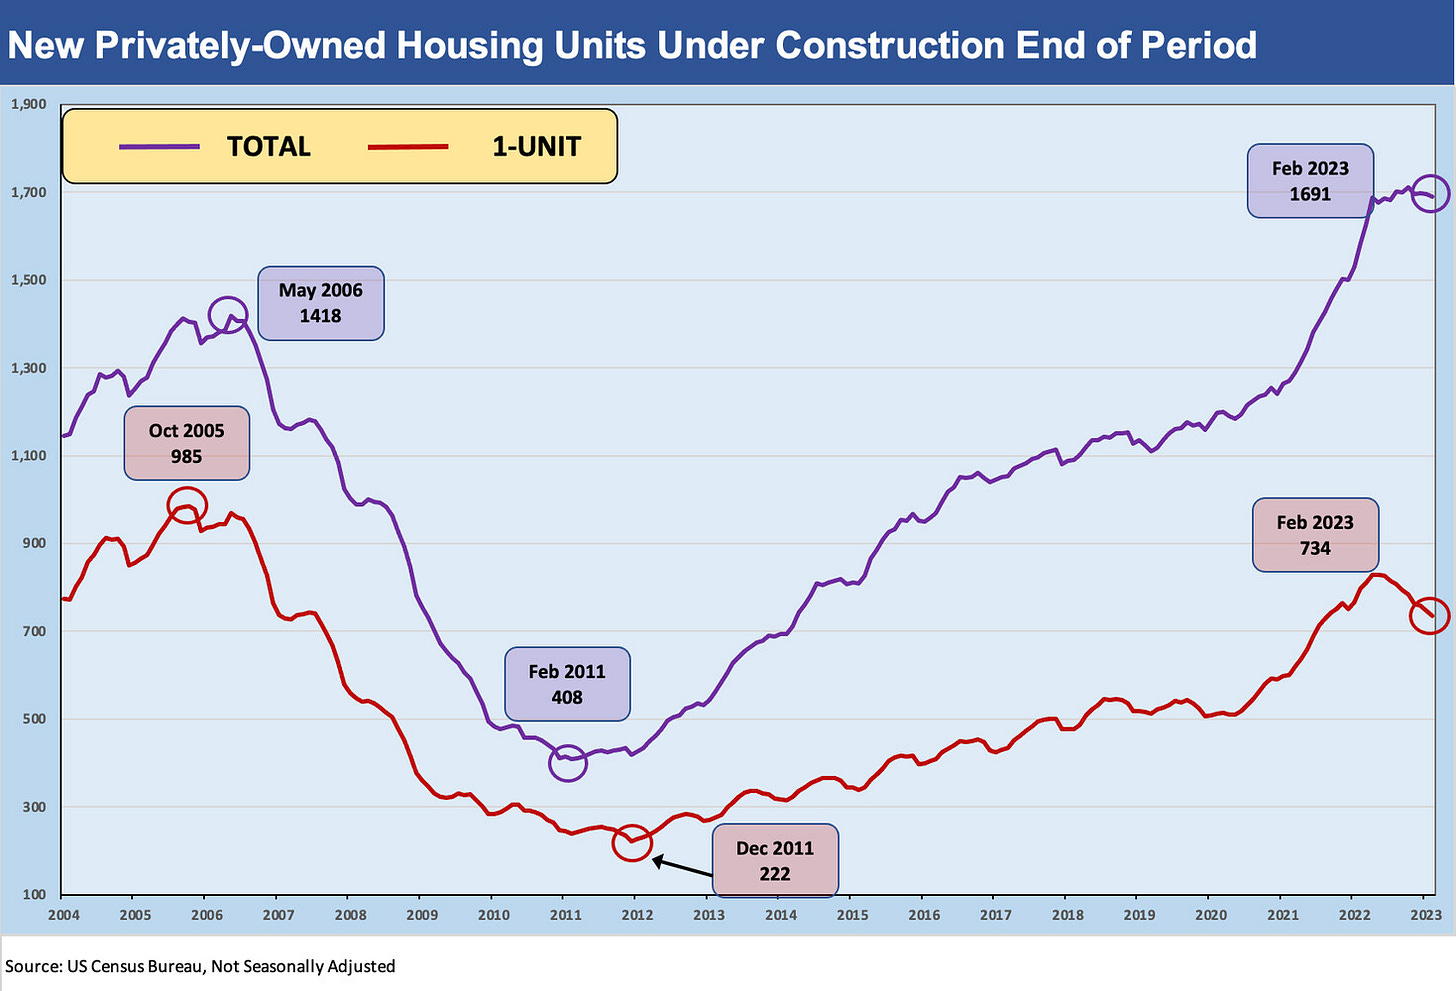
Permits are a leading indicator and always get a lot of attention in the monthly report even though we tend to focus more on the new shovels in the ground and the construction in progress on the way to closings. That is when it all flows into the P&Ls of builders. As we detail further below, the construction in progress numbers are very strong in the context of “economic activity.”
The recent starts numbers were at least favorable in the midst of all the noise. Seasonally adjusted levels in total permits were up +13.8% sequentially and down -17.9% YoY while single family was up +7.6% sequentially on a seasonally adjusted basis (down -35.5% YoY).
As a reminder, Feb 2022 saw the Fed still in ZIRP mode. The South, as the largest of the regions, was +9.8% for single family (-32.2% YoY) while the West was up +7.6% in single family sequentially (-45.6% YoY), Midwest +10.9% single family (-30.1% YoY), and the small Northeast market was at -14.5% sequentially (-37.3% YoY)
As framed below, total permits hit a low “not seasonally adjusted” for total permits in Jan 2023 after an earlier low in Nov 2022. On a seasonally adjusted basis (not shown), lows were hit in Dec 2022. For single family not seasonally adjusted, we saw lows in Dec 2022 with the South and West regions driving that story.
The above chart frames the uptick in permits vs. the relatively tepid starts numbers on a “not seasonally adjusted” basis. The “not seasonally adjusted” basis is to show the sea level activity that the builders see.
The Starts side of the ledger was off the bottom in Feb 2023 at +9.8% for total starts sequentially on a seasonally adjusted basis but off -18.4% YoY. The South was muted in single family starts as well as total starts. On a seasonally adjusted basis, total starts in the South was +2.2% (-20.3% YoY) while South single family was -4.7% sequentially (-25.3% YoY). The West came in strong at +16.8% sequentially for total starts (-15.4% YoY) with single family +28.5% sequentially (-45.1% YoY)
Construction levels stay high and more closings are later in the building cycle…
The above chart updates the construction in progress time series that still shows waves of activity starting to gradually slow down. Completions were up over 12% in total sequentially and +44.5% nationally for Multifamily. That is where the rent debates come in, but that topic is for a different day. Overall, Housing Units under Construction at the end of period were down in total slightly sequentially at -0.2 but still up by +6.9% YoY. Single family was -1.7% sequentially and -8.0% YoY. Multifamily was barely positive sequentially at +1.0% but up by 22.4% YoY.


