
Footnotes and Flashbacks: Week Ending Feb 10, 2023
Curve inversion, SAAR rates, trade flows, auto SAAR in macro. Auto suppliers, Cap Goods, and Auto Retail in micro.


This Week’s Macro: Broad index returns, ETF benchmarks, Updated 3M-5Y inversion, HY/IG yields ratio, US global trade deficit trends, Auto SAAR and auto industry events across the decades.
This Weeks’s Micro: Capital Goods: Signals from bellwether Cummins; Auto Parts: BWA and MGA; Auto Retail: Penske Automotive.
MACRO
In our Macro section, we look for notable economic releases or trends across bellwether industries from the top down. “Macro” is one of those flexible terms, and that led me in past lives to use terms like “Macro from 10,000 feet” (like SAAR) or “Macro from 30,000 feet” (like inflation). We would use terms like “Micro Macro” to refer to areas such as oil prices and commodities cycles or housing sector demand. In this publication, we will stick with one word: Macro.
Comparative Asset Returns

The above chart updates the trailing total returns for the main equity and debt benchmarks. As we detail below, the fixed income asset classes saw a little pressure from the macro story around employment and Fed commentary. Meanwhile, the 4Q22 earnings season is not exactly flashing recession.
We had looked at the jobs color in the JOLTs report (see JOLTS: More Bodies for More Jobs, Demand is Strong 2-1-23) and monthly employment updates (see Jobs: The Human Wave Continues 2-3-23). As bad as the tech layoffs might be in the headlines, the weekly claims numbers also are staying low. There are a lot of job openings, and Quits rates % Separations show the average worker is confident in finding the next paycheck.
The guidance that has been rolling out of earnings season has been mixed but on balance constructive. The debate is more around peak valuations for some major sectors and handicapping where some industries are positioned in terms of secular shifts such as the climate initiatives in capital goods, autos, energy, mining, the chemical supplier chain (petrochemical or otherwise) and others. High capex is the norm for many and steady or rising revenues for many of the bellwethers we have been watching.
For equities, valuation debates revolve around growth and multiples. For the yield curve, constructive revenue and earnings can wave off some of the most bearish, but the stickiness of services inflation and investment demands are tough to balance. A healthy consumer sector at 50-year lows in unemployment is an inescapable reality for the Fed and bond market alike.
ETF subsector returns show some differentiation…
The next two charts highlight returns for a range of ETF subsectors by industry group. We update these each week for trailing 1-month and the 3-month periods to smooth out the short-term volatility. We also mix in some broad index benchmarks with the ETFs.
For this month, we are dropping bitcoin from our list of assets vs. the ETFs. The main reason is that BTC’s recent dazzling rebound YTD distorts the chart scale. That was also the case for 2022 with its negative -65% return (see The 2022 Multiasset Beatdown 12-31-22). Now it is on the left side of the charts. Bitcoin has rebounded dramatically this past month (+22%) following a YTD trend.
The other reason that we are dropping BTC is that we have little interest in crypto other than its behavioral science aspects. So far, the banks have not highlighted any issues on their books that we are aware of. We are more in line with Jamie Dimon on the crypto topic (“It’s a pet rock”) and Charlie Munger of Berkshire Hathaway fame (in a recent WSJ Op-Ed he wrote: “A cryptocurrency is not a currency, not a commodity, and not a security…it’s a gambling contract with a nearly 100% edge for the house). We will leave it to Matt Damon to cover Crypto’s virtues as an asset class.
Crypto will keep facing calls for regulation, and the market will be watching that unfold in 2023. Some in Congress demand the SEC cover it now, but then promise no additional resources to be able to do that effectively. Covering crypto at the SEC will require a scale and experience of personnel that cannot be satisfied by a fresh crop of lawyers. Regulating crypto would likely require disclosure laws be changed to reflect the needs of a “currency” that is used in the ways it is used (often shady or just speculative). The same is true in enforcement. The SEC is a mix of functional silos and had a hard enough time with derivatives and structured credit products since they don’t regulate loans. With the issues cited by Mr. Munger (i.e., “not a currency, not a commodity, and not a security”), the whole process will fall prey to Washington turf wars.
The 1-month time horizon….
The 1-month sector ETF mix below shows more of the 2022 losers as winners and the 2022 winners as losers in a solid YTD rally. Energy, Consumer Staples, Utilities and Healthcare were in the upper quartile or just below for calendar 2022 and now sit closer to the bottom for the past month.

Among more notable trends in the asset class category of ETFs (fixed income ETF vs. industry equities) is the swing lower in AGG, GOVT, LQD, and HYG for the 1-month period. Each of those debt ETFs underperformed the S&P 500 this past week also. The yield curve still rules the total return math even if the view of less downside in fundamentals near term had been helping spreads before this week. The UST curve started working against duration again this past week. We did see a big swing back into positive territory by XOP and XLE this past week after a rough stretch that we frame in the 3-month chart below.
The 3-month time horizon…

The 3-month ETF returns still reflect the “worst shall be first” pattern. XOP fell behind its strong 2022 performance as the winter crisis fears and various energy panics (oil, natural gas, LNG, refined products) subsided somewhat vs. the worst case scenarios spinning around through much of 2022. Winter was the reality check. We see XOP at -8.1% for 3 months with XLE and AMLP (midstream) just hovering above the breakeven line. The AMLP names and some in XLE have healthy dividend payouts that add more onto the price return into total return.
Yield Curve Migration
The chart below is one we update weekly as a reminder of how far the bear flattener and upward shift has moved. We saw more action in the upward shift this past week since our last edition as the differentials vs. March 2022 (the month ZIRP ended) went higher across the UST curve with 5Y-10Y-30Y all moving higher from our last version by around 20 bps in the differentials.
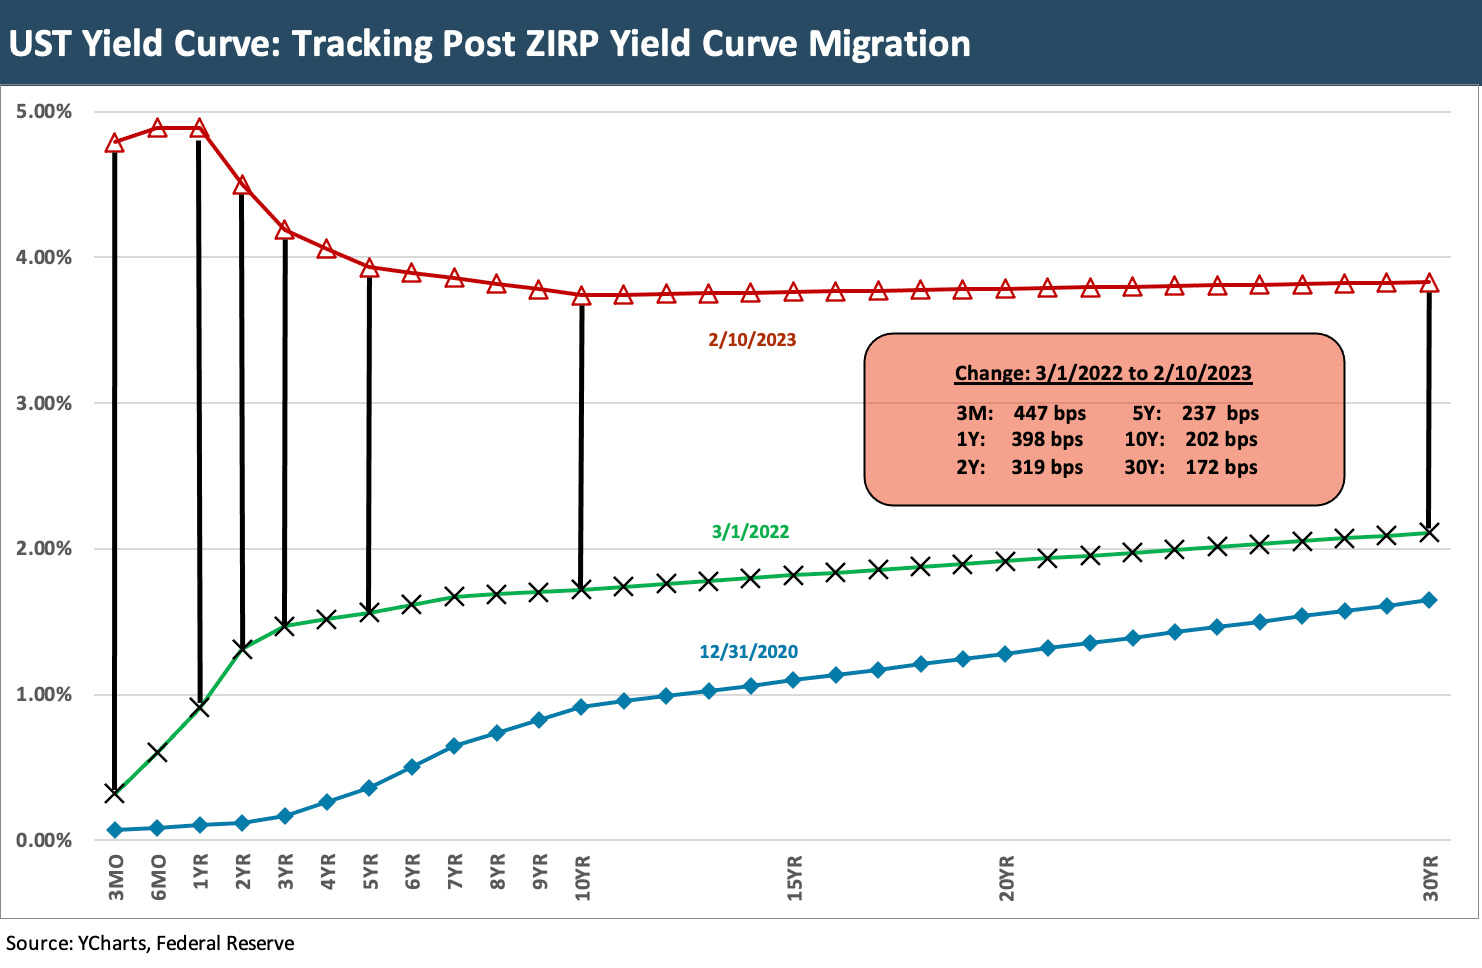
With the Fed moving on the front end, the inversion of the 3M-5Y is still very high in historical context but easing from the highs. We frame that in the next section.
The 3M-5Y slope means cash is an income producing asset on the menu…
As we have cited in numerous commentaries, cash as an asset class alternative during a period of shifting cyclical tides is a legitimate recommendation even if it does not fit with the mandate for the asset class constrained investors. We looked at the slope histories in the past, so we will skip the replay here (see UST Slope Update: Some New Inversion Highs 12-8-22, UST Curve: Slope Matters 10-25-22, The Cash Question: 3M-5Y Yield and Slope 10-19-22, HY-IG Spread Compression 2-8-23).
The reach for yield and the foregone coupon income that had inspired risk appetites and yield curve extension so much in the ZIRP days is not the decision input it was. Getting a 4% handle on a deposit than can be accessed the same day or next day gives a lot of flexibility in timing the evolving asset class allocation strategies. Cash returns allow for less need to rush as the market and the investor sorts through the variables.

The reality of the Fed hiking and inflation fears holding hands with recession fears on the way into 2023 led to a peak 3M-5Y inversion in Jan 2023 of -126 bps (1-18-23) as noted in the chart. The recent moves of the UST curve reflect a stronger than expected set of signals from the job market. There are also increasing signs from a lot of industrials and services companies that they are not planning for material contraction in their core business lines.
With a wide range of the largest manufacturing, freight and logistics, and energy companies weighed in at this point, the average theme is more a debate around slow growth or minor declines. The equity market can debate valuation and even cyclical plateaus or soft declines for many companies, but it is really tough to declare a recession is coming from the consensus numbers. Some industries are contracting (tech problems galore) but many are not. Investment programs for the future show robust capex in many industries, and replacement cycles have to be considered apart from growth initiatives. The revenue lines and capex planning are shaping up well enough so far.
The lead variables in growth are always tied to the consumer sector just on the scale of the numbers in GDP line items. We appreciate the reality that many investors have depleted savings and tapped their credit cards, but the PCE lines go hand in hand with employment. The new 50-year low at 3.4% is not about speculation or theories on what lies ahead. It is a “now thing” that means more spending in total. Less per capita spending still has to “count up the capitas.” Pricing power attaches itself to demand, and the supply question for many industries is still a work in process.
US High Yield vs. US Investment Grade Yields…
We updated some of the IG corporate and US high yield relationships this past week including framing credit vs. the UST market (see Those Were the Days: HY Relative Yields, HY Relative Risk Premiums 2-9-23). In this chart, we update the relationship of the HY Index yield with the IG Corporate Bond Index yields. The history just frames the basic relationship of what incremental yield the investor would get for taking more risk in the high yield basket for the additional risk taking.

The medians tell a story across time as do the highs and lows across various market environments. The spikes in the HY vs. IG relationship come with default cycles but also during expansions on market events or headline macro fears. We see the effect of crises (e.g. post-Lehman), bouts of risk version (early fall 1998, summer of 2011 into early fall), secondary liquidity panics on redemption fears (early 2016), and the clear expectation for default cycles dead ahead (2001). We skip the post-1980s cycle in most of these charts since good daily OAS data across the benchmarks and the tiers really started in 1997.
The current ratio of 1.54 is modestly below the long-term median and around the median levels seen in the 1997 to 2001 time frame ahead of the default spikes in late 2001 and 2002. We are also now around the median for the 2001 to 2007 time horizon when HY demand was very robust in 2005-2007. In other words, the ratio is not signaling cheap. The 1.2 handle low ticks noted in May 1997 and June 2007 are in the very rich zone of late credit cycle stages. The early Oct 2018 1.48 marked the cyclical low at that point in US HY spreads.
Record high trade deficits for a calendar year…
We looked at the main trade themes for the immediate future (“immediate” in Washington means the next election cycle) in a recent commentary (see State of Trade: The Big Picture Flows 12-18-22). We still see trade as a major economic risk factor that can easily overlap with geopolitics, inflation, and domestic investment.
As we detail in the charts below, the idea that the trade deficits can be easily dealt with often reflects the utter ignorance of basic trade flows that are in evidence that Washington spews from both sides of the aisle. There are ways to just shift the country on the other side of the deficit for any given product category (we note the soaring trade with Vietnam in our last commentary on trade) but unwinding a supplier chain with a frictionless set of adjustments just can’t happen without a role played by economic incentives or disincentives. The incentives and disincentives are code for tariffs, quotas, or taxes. Then the clash with the WTO begins.

The pattern above in the trade deficit history is not a mysterious one. We plan to look into the line items and frame the shifts in 2023 as we did in prior research lives. This is a topic that runs from ideological to economic to geopolitical, so it brings a lot of subjective elements. Tariffs are – by definition— either inflationary to the customer or dilutive to someone’s earnings. The expense line gets hurt if the buyer of the imported good cannot past the price increase along. To watch and hear Washington say otherwise (whether Bernie Sanders or Donald Trump) is just strange, cynical, or ignorant of the facts. Some economists spin strong dollar theories on their think tank white boards that say tariffs will bring a strong dollar and cheaper imports that offset the tariff. That is why Professors do not have P&Ls.
The inside voice for legislators say, “I want to get elected. I want to help American investment and jobs and bring the onshore realities into the GDP growth trends of America. The world be damned. I am taking care of the home team.” That may resonate with voters, and most of us can understand the instinct there. A lot of jobs have been lost (I grew up in an old manufacturing town). Flagging the risks of protectionism seldom happens while seeking to get voter support. There is a tendency to hide the realities since some major domestic economic interests have massive exposure to retaliation (agriculture and aerospace at the top of the list). Then the taxpayer funded bailouts come. There is no hiding from an economic cost.
The chart below plots the imports and exports that drive the record deficit. The record highs underscore the high level of economic activity. With each of those import/export lines come a lot of services and household revenues (freight and logistics, personnel, etc.) on the way to the customer destination.

The problem is not just about lying about the costs or the economic effects (Trump still says we collected billions from China when in fact the US customer pays the tariff. We did not collect any tariffs from China). There are four major trade partners that dominate the ranks of US trade. Two are in free trade deals (Canada and Mexico). One is a close ally (the EU) who now leads in imports and exports and is an ally during dangerous times.
The other member of the Big 4 trade partners is China, and the economic stakes there are often understated for corporate America and thus the equity and debt markets. China also holds a few dollars of UST bonds. There is a reason why tweaking the flows (with China tweaking is many billions) has been the approach rather than tearing up the trade playbook. We suspect the trade overhaul will come sooner rather than later. Trade topics are for other days, but we clearly are seeing challenges to address in election year policy angling on trade. China relations are only getting worse even this weekend.
LV SAAR run rates show low numbers in historical context until the Jan 2023 pop…
The focus on the consumer and industries with economic multiplier effects that service the consumer are always critical variables to keep an eye on. The chart below looks back to 1976 at monthly SAAR stats for US light vehicles. The month-to-month swings can be quite material on aggressive incentive programs, but the medians help smooth out the cyclical view for a fresh assessment on any given period. For example, the month of October 2001 hit 21.7 million after GM launched the “Keep America Rolling” campaign after 9/11. We saw 20.6 million after GM (others followed) launched an Employee discount plan in July 2005 and volume hit 20.6 million.
The SAAR levels of the past two years were quite low for a reason. The supplier chain problems that have generated so much publicity with chips extends to a range of other components and materials and that kept auto run rates looking more recession-like. That in turn fed inflation at both the new car and used car levels in 2021 as inventories and production rates slowly recovered.
We break out the post-COVID period median at 14.3 million. That is artificially low in a period where there are now record payroll numbers, record numbers of drivers, and all that rolled up in a record population from the last of the greatest generation and the boomers to the newbies. We see the 15 handles from the 1990s and the 16 handles from 2000s through 2023. The recent pop in January 2023 to 15.7 is thus not an anomaly but more an expectation of normal volume.

The above chart is a busy one, but I was trying to capture the simple volume story on light vehicle SAAR in the US. As a reminder, SAAR is tied to demand and what is flowing off dealer lots. We will cover the cyclical dynamics of the light vehicle cycles in other commentaries, but the combination of demographic demands and replacement cycles make for interesting twists as car ownership patterns change and theorists wonder when car-sharing and subscription business models will gain real traction (or not).
I broke out some of the events along the timeline to remind readers of the M&A headlines, the deep stress for some companies along the way, and the major turmoil seen at each of the legacy Big 3 at some point (or more than once). My own experience with autos goes back to the 1980s. I may be dating myself, but I was sitting in a roadshow analyst presentation listening to Lee Iacocca, who was wowing the crowd with his K Car evolution and this great new concept called the “minivan” (I bemoan losing my treasured Matchbox car from that meeting).
Working on the buyside for a company (Prudential) that was one of the lead creditors on multiple post-1979 bailout restructuring of debt, you were required to do some committee time and defend recommending Chrysler bonds (including Chrysler Financial) in the mid 1980s for a growing HY portfolio (they certainly owned worse).
The events indicated on the chart certainly showed Chrysler as a serial adventure across the 1990 sell-off ahead of its rebound to the most profitable major OEM on a per vehicle basis at one point in the 1990s. That was before Daimler merged with Chrysler and botched the deal. Then Cerberus did an LBO and was crushed. Chrysler (and Jeep and Ram) is now in the Stellantis garage after Chrysler’s earlier time in bankruptcy and then as a Fiat unit.
Meanwhile, GM was in a multidecade process of downsizing and losing share across this timeline. GM was restructuring its way down to a much smaller company before finally succumbing to the consumer meltdown in the credit crisis and Chapter 11. Ford is still Ford and ducked Chapter 11, but that does not change the reality that it has had some very tough times. Grading on the curve against Chrysler and GM, Ford has been a study in stability despite its problems in 2006.
Among the other names on the timeline, Nissan went from being a featured case study in contrast to Ford in Halberstam’s “The Reckoning” to being semi-bailed out by a former state-owned French automaker in the form of Renault (privatized in 1996). Stellantis (formerly known as PSA) has consolidated its way into being one of the largest and most diversified OEMs in the world (diversified geographically and by product segment). That will be a company that needs a lot of research to monitor and trace how they pull that off across the next cycle.
_____________________________
MICRO
In the Micro section, we try to select companies or narrow industries that reflect on the broader macro trends we like to focus on as well. Most of the micro topics have direct relevance to stock and bond holdings out there in the diverse world of portfolio holdings. We look across the risk spectrum from Investment Grade to High Yield to Distressed. Everyone fits in a micro picture somewhere. We have been involved in more than our share of all of those risk tiers from the buy side to the sell side, in due diligence, in risk committees, and trading desk activities.
Capital Goods
What we look for from the industry leaders in capital goods such as Cummins in this current note is some useful guidance from their very close ties into customers and especially the big buyers in fleets. CMI benefits from the color they get from dealers who are close to replacement cycles and parts demand. Their guidance starts at sea level.
As we covered in our commentary on Caterpillar and CNH Industrial in a prior edition (see Footnotes and Flashbacks: Week Ending Feb 3, 2023), the deep cyclicals in Machinery and Equipment have the usual sensitivity to shifts in volume in key end markets that evoke the word “tonnage.” The Cummins business mix we discuss below is more volatile than most since it has a heavy exposure to the Class 8 truck market that is notoriously cyclical.
Cummins delivers strong 4Q22 results and guidance was constructive…
Cummins (CMI) is a major player in the global engine markets. I first followed the company in the 1980s when CMI was going head-to-head with Caterpillar and was facing the challenges left over from the brutal 1980-1982 downturn and deregulation of the transportation sector that sent more than a few fleets (and major truck OEMs) to early graves.
Since then, the US commercial vehicle manufacturers have consolidated across a few major players including some who are more vertically integrated. The commercial truck market is a regional one, however, so CMI offers a very good vantage point on one of the most cyclical subsectors in the freight and transportation space.
After a brutal supplier chain experience over the last few years that saw disruptions from sea (shipping and ports) to air (air cargo) and land (rail and trucking), the importance of the commercial vehicle markets and its personnel is appreciated. The trends in new propulsion and how that impacts the freight process will be one for policy makers to monitor closely to assure the climate challenge does not blow trucking costs or capacity out of the water (or off the road). That will be on the ESG menu of research items to watch.
The North American Class 8 and medium duty diesel engine market is highly concentrated but also brand sensitive. Cummins is a key brand in that space. In other words, a trucker will request a Cummins engine. The business is also tech-intensive from engines to emission control components that are coming into play more than ever. The segments boast higher margins than in Auto OE suppliers, and the manufacturers such as CMI generally have more pricing power. The exposure to imports is not a major factor and the capital intensity is an old school barrier to entry.
The short version of the industry history after the various sector crises is that CMI won and CAT lost in a head-to-head battle that also featured Detroit Diesel in later years. Detroit Diesel was purchased from GM by Roger Penske and turned into a very profitable sale to the vertically integrated Daimler by around 2000. Cummins now stands alone as the last major player and as a heavy-duty diesel independent with a strong position in medium duty as well.
The industry is still evolving as the next stage of post-ICE battles unfold. CMI has a good story around its acquisitions and investment strategies there but that needs more space and dedicated commentary. The fact that the capex programs are high and will stay high speak to CMI’s ability to stay a leader in the space. It also calls into question the desire of the truck makers to stay as vertically integrated in the future, creating more opportunities for CMI. Some truck makers may not want to bear that R&D and capex burden.
Recent decades included regular draconian tightening of emissions standards that caused “cycles within cycles” as replacement and “pre-buying” of trucks soared ahead of deadlines. The emissions demands were such that CAT exited the on-highway engine business. Technology problems at Navistar on emissions compliance almost bankrupted the company (long story for a different time). Navistar is now owned by TRATON in what has been a globally consolidating commercial vehicles market. That background is for other days and other commentaries.
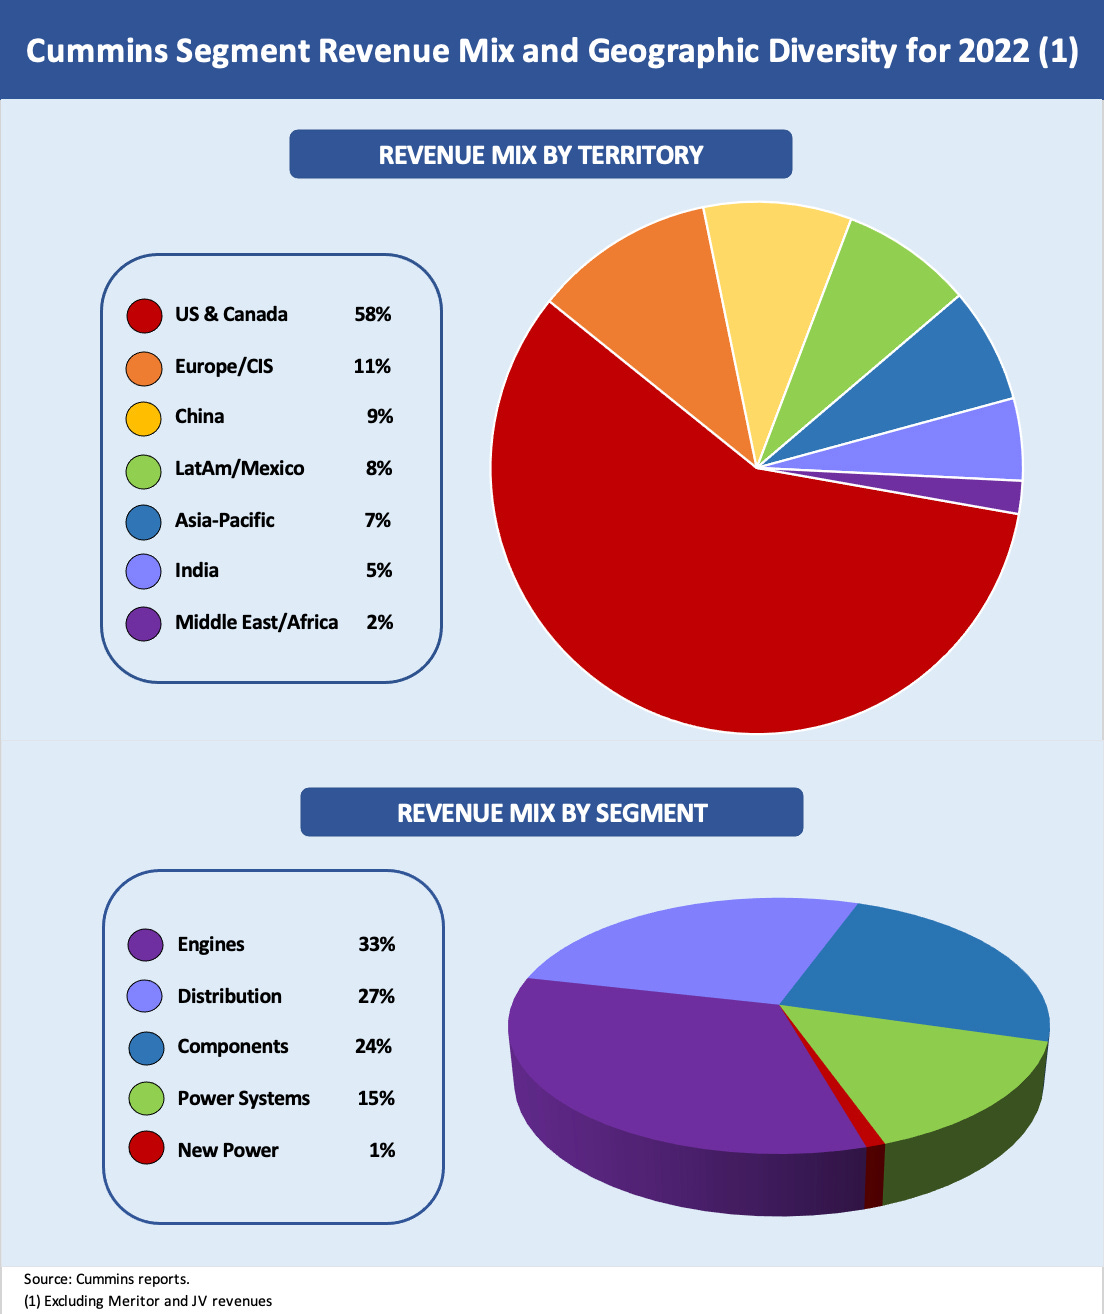
We include Cummins in this weekly version since it is as cyclical as a major company can be, is swept up in the evolution of engines away from ICE and/or toward zero emissions and is investing heavily in new technologies. CMI is using free cash flow to reel in more assets that will help the company accelerate its product development. CMI fits into a lot of different trends but the main issue is the simple reality of the cyclical nature of the commercial vehicle customer base and related replacement cycles. CMI helps tell a story on recession risk for the US. North America comprises 58% of CMI revenue.

The chart above on trailing equity returns tells a story of either a cyclical peak and questions on valuation or it signals above average risk of recession. CAT is more tied to construction and DE, CNHI, and AGCO more tied to the agricultural markets. PACCAR is one of the Class 8 truck leaders with Daimler and Volvo. The equity markets are not showing a case of nerves, but the ability to keep investing in the face of flat or rising revenues is worth something in the cyclical debate. CMI and CAT earnings and guidance left us with the sense that there was not much recession risk in their expectations.
For its part, Cummins is guiding to higher revenues, EBITDA growth, and steady margins. Capex will be rising and free cash flow bountiful. The segment guidance from Cummins was dominated by the word “up” with a small side order of “flat to up” in the engine business. If we exclude the investment initiatives in the small “new power” business, we see three of four of the main operating segments (Distribution, Components, Power Systems) highlighting higher revenue ahead. The Engine segment framed flat to up 5% guidance but with stable double digit margins in the low-to-mid teens. Despite the inherent cyclicality of commercial vehicles, the aftermarket components and servicing operations are steady and lucrative, and CMI is the leader.
CMI also competes with CAT in the global power generation business. The combination of high investment expected in energy and mining and the China reopening story are X-factors on the upside. As much as North America – where CMI’s majority of customer markets are located – faces potential recession risk, the investment side of the ledger has been getting solid color this earnings season and CMI echoed that sentiment. The infrastructure bill, the IRA, myriad climate transition projects, and high oil prices are keeping the spending cycle rolling. Nonresidential construction may be mixed across the category, but power gen plays a big role there. The tonnage factor for heavy duty trucks also ties into that when such cycles are holding up.
AUTOMOTIVE
Auto Suppliers, the volume wildcard, and capex demands…
With Magna (MGA) and BorgWarner (BWA) reporting this past week, we looked at their results for cyclical color. The guidance they offer on what lies ahead is balanced even if MGA has some earnings baggage right now. If we exclude Cummins from the OE supplier peer group as a somewhat distinct animal and truck market supplier (CMI has a market cap of almost $35 billion), MGA and BWA would rank #2 and #3 in market caps among the biggest US-centric auto suppliers we watch (see chart below). Aptiv would rank #1 in that group among US operators.
We break out the stock returns in the table below, and the recent trends are not showing much anxiety after the recession level production rates of the past two years on supplier chain issuers leaves production volumes biased to the upside. We had detailed the SAAR rates earlier in the Macro section above (note: SAAR is retail sales while production is the key driver of the supplier revenues).
The 14.3 median from Feb 2020 to Jan 2023 leaves ample room for higher production rates in 2023 even with a stall in the broader economy (if that in fact unfolds). The consensus estimates that we see for the US and North America are calling for higher production rates than the past two years as well as higher sales for the key US market. Production drives the OE suppliers, but SAAR and production are intertwined.

Interestingly, the stock performance results of Magna and BWA are very different even with each one of them making their way onto various top pick lists in recent years. We will need to look at the two in separate commentaries given the constraints in this weekly note, but both are investing heavily to expand their electric vehicle supplier offerings and offer emissions advances that can support the valuation of their equities.
BWA has guided to higher revenue and earnings and is a free cash flow generator, so that supports the theme of cyclical strength. MGA is calling for sales to grow in 2023 but preferred to talk about margins and 2025 rather than 2023. The equity markets reacted accordingly. MGA has an acquisition underway (Veoneer) that complicates guidance. Sales guidance from MGA calls for 6% to 8% growth per year and improving free cash flow, so the investment themes are intact. Significant investments are emphasized by MGA, who is clearly playing the long game on profitability and not the short-term margin pitch. That will likely catch on as more EV related investment gets made that are not accretive near term but will be to valuation in time.
In contrast to the cyclical indicators one can get from the major Capital Goods or Auto OEM, the suppliers are literally all “over the place” in their strategies, relative competitive advantages in product mix and technology positions, and certainty in their financial risk profiles and ability to sustain very high rates of investment required to meet the demands in the EV race.
Looking back to the 3 to 5 year time horizons one gets an idea of who is getting it done, but the recent years have made it tougher on some names such as Magna in holding onto the valuation excitement of their “EV buzz” and getting their earnings and cash flow to match their valuation parameters.
Both Magna and BorgWarner are considered stellar operators in the space who have fought through all the years of customer crises, financial systemic turmoil, and COVID to be well positioned for the intermediate term rise of EVs. In other words, they are good names to track for cyclical signals and how the EV vs. ICE war is playing out in investment planning.
Auto Retail
Auto retail not signaling consumer weakness and the market agrees…
As we wrap up a weekly note that had somewhat of a cap goods and auto theme, we look at what Penske Automotive Group had to say when they reported earnings. Penske is one of the better operators in a franchised dealer space that is growing, consolidating, diversifying and evolving business models. In degrees that vary by operator, that expansion includes Finance and Insurance Products (F&I), used cars, and digital retailing. The peer group is engaging in tactical M&A and bolt-on deals as more private dealers (which is the majority of dealers) monetize their franchises in a business that is growing more complex than ever and where scale will matter in areas such as digital retail and keeping up with OEM demands on EV planning.
Penske boasts the largest market cap of the major franchised dealers at $10 bn ahead of #2 Lithia and #3 AutoNation, #4 Asbury, #5 Group 1, and #6 Sonic. CarMax is in a world of its own as a dedicated used car dealer with the largest market cap in the retail group at $11 bn even after its 1/3 drop this past year. The used car business went from very lucrative to risky in earnings as well as presenting a strategic execution challenge. The franchised dealers are showing those headwinds in their 4Q22 earnings. In the case of Penske and some others, the disclosure is very granular by retail product lines across the full array of revenue and margin mixes. We will be doing more issuer level drill downs on these names separately soon enough.

In the above chart, we update the trailing stock returns for the peer group of franchised dealers and the two used car headliners in CarMax (KMX) and Carvana (CVNA). We looked at the used car dynamics in the fall as that subsector of retail sales heated up as a focal point (see Market Menagerie: The Used Car Microcosm 11-29-22). With used car inflation going through radical swings in 2021-2022, the operating strategies of the dealers were getting more scrutiny as they were going through radical change. That picked up further as CNVA went into a freefall from its perch with a stock price of $370 in Aug 2021. With its massive % rally in recent weeks, CNVA is back to $10.84 on Friday close (see Carvana: Wax Wheels 12-8-22)
We see very strong returns vs. the broader market for most all the Big 6 with the exception of Lithia (LAD) looking back one year. LAD ran past the peer group into 2021 with its strategic priorities on used cars and digital retailing. LAD had run ahead as CVNA was spiking off the charts and investors looked for other less speculative exposures with some of that flavor. LAD is back in action now but with the “normal” peer group and all are being treated optimistically by the market after two years of tight new car supply. As we covered in the Macro section above, available inventory and better supply chains (but still constrained by chips) got Jan 2023 SAAR into the high 15 mn handle. That was a good start.
The 2022 numbers bode well for the ability of Penske to pursue its operating strategy to acquire and invest and deploy free cash flow. The main drag on revenue and earnings growth will be used cars and cyclical questions in their truck business. Overall, in 4Q22, PAG weighed in with record results for the year and solid margins. The results highlighted sharp declines in used volumes and margin pressure there, but used cars are not what drive the Penske story despite expansion in used car retailing in recent years.
The company is very well diversified with a heavy mix of premium brands and luxury. Penske has historically kept very low exposure to US brands. The largest brand is BMW followed by Audi, Toyota, Mercedes, Jaguar, and Porsche for almost 3/4 of dealership revenue. If we toss in Honda/Acura, Lexus, Maserati, and Bentley we get to 85% (so much for pickup trucks, although it should be made clear that Roger Penske oversaw successful NASCAR teams in addition to his own Formula One background. He is not a snob).