Jobs: The Human Wave Continues
We frame the decline to a new 50-year low in unemployment rates as job adds blow past even high end estimates.
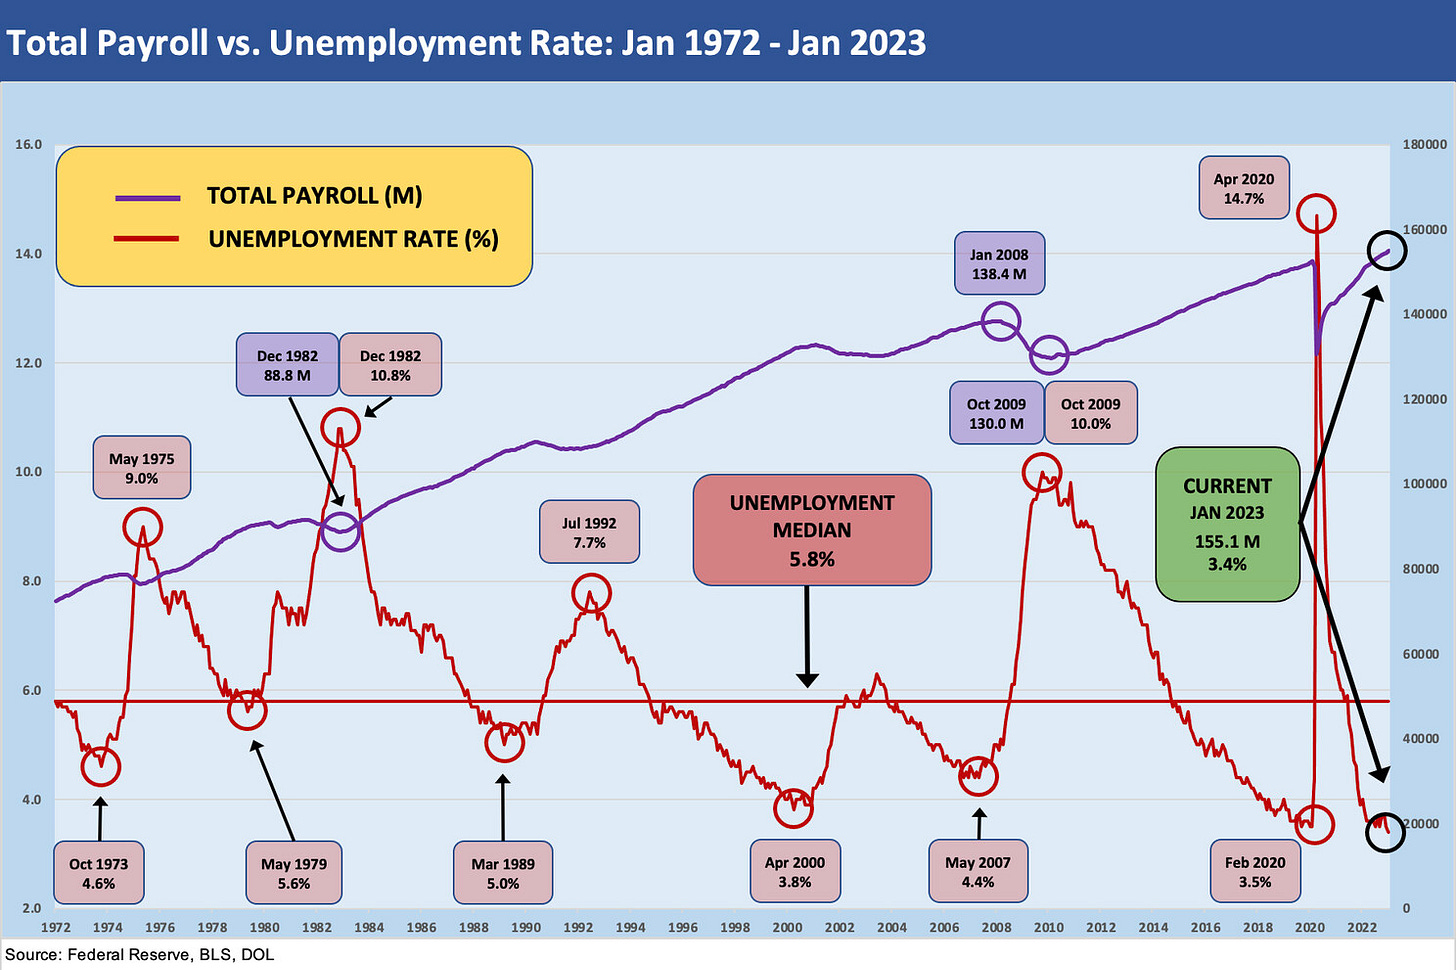
We take a quick look at the blowout jobs numbers in historical context as unemployment notches down below the 50-year low to 3.4%.
The consensus expectation was dwarfed by the actual tally, and the CNBC panel of econ dignitaries saw the high end of the group’s estimate get doubled.
The market reaction so far was muted as the wage inflation number did not alarm after a constructive Employment Cost Index release this week presented a mixed story when lined up alongside the JOLTS report.
The short form away from the unemployment headline number and payroll adds was that YoY wage inflation was down. The economists can make a case for a mixed set of inputs in the bigger inflation story. Anytime jobs surprise on the upside these days, the Fed X-factor is quickly the dominant part of the discussion (see Jobs Conundrum: Good is Bad, Bad is Good 12-2-22). With some PCE weakness of late and a converging number in the JOLTS report between Hires and Separations, there is always a debate to have. The Separations story still shows a disproportionately high Quits mix, however, and that is not a sign of low confidence (see JOLTS: More Bodies for More Jobs, Demand is Strong 2-1-23).
The job count posted today is better for the macro story (if not for those with recession market axes) as more jobs and more bodies means more consumption in total. We even saw some of the wonkier metrics (job participation rates, hours worked, etc.) get some positive color as being part of what is a clearly good month for most even if not for the Fed. When the smoke clears, the month of January will get its usual asterisk as a tough month to seasonally adjust. Then it is back to earnings and the countdown to the next CPI report.
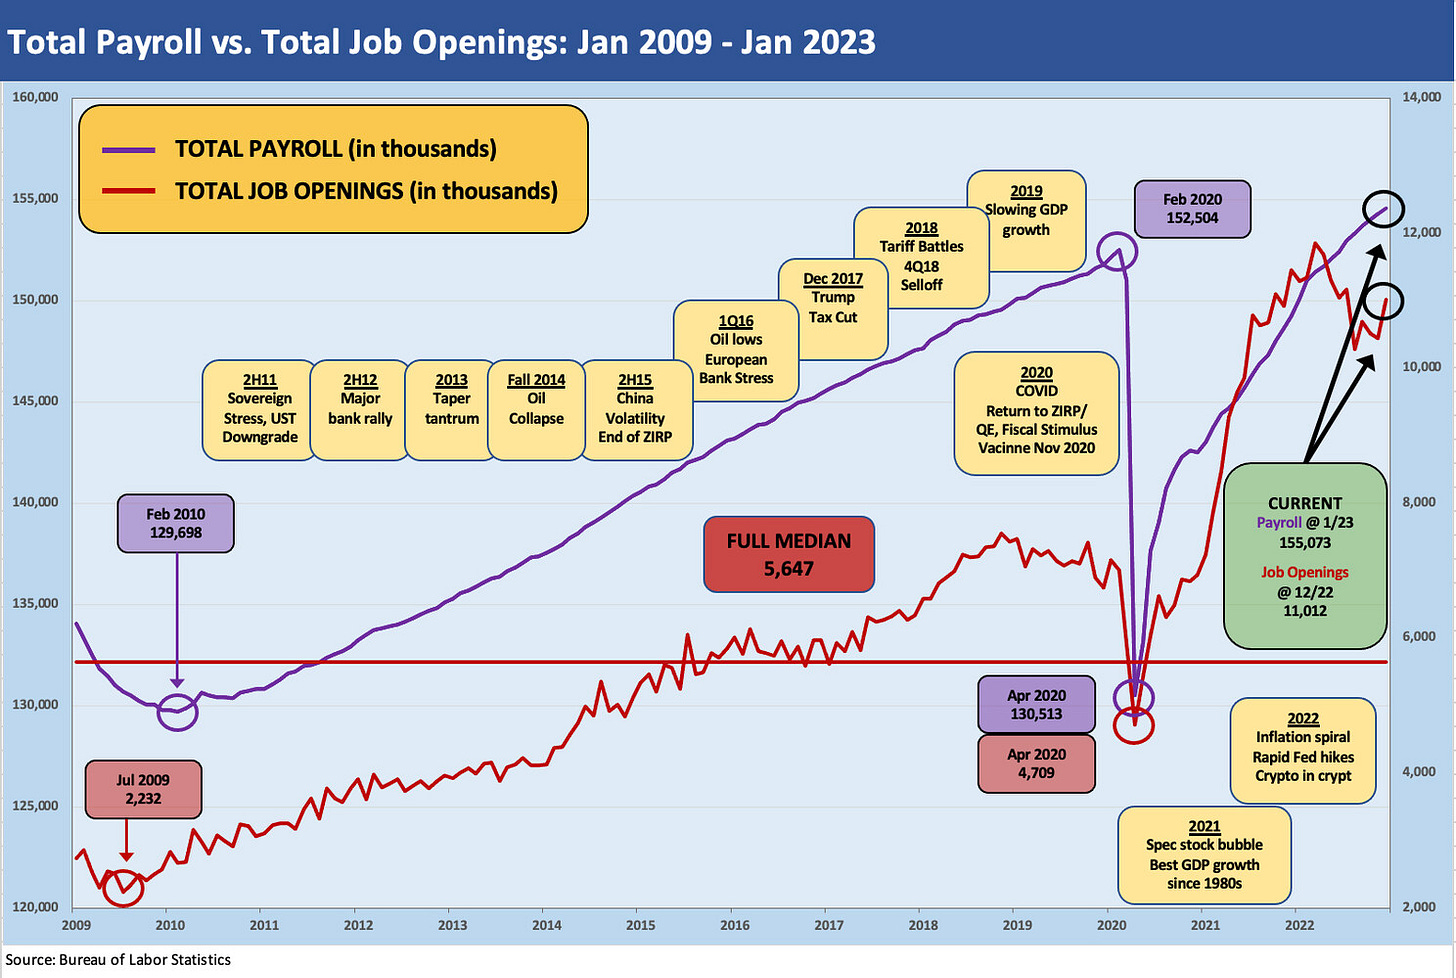
The above chart plots the Total Payroll and Job Opening time series (left-right axis format). Both clearly trended higher in the latest print. We need to highlight that the BLS January restatement derby was bigger than usual, so we rolled in revised numbers (all higher) for each month in 2022. We don’t need to dwell too much on the idea that more jobs is good for households. The challenge is that this likely reinforces Fed commitment to hold the line on a 5.0% terminal rate (or go higher). “Help Wanted” is good for workers and wages but might stay in the red zone for monetary policy.
The 155 million jobs tally is a function of demographics and strong hiring in the labor-intensive services sectors. A growing population falls under the “three Big Macs is better than two Big Macs theory” that we sometimes cite. The job count tailwinds still need to be qualified for the mix of wage levels in those jobs (two Big Macs + a steak?) and what the incremental earnings dollar means in purchasing power.
The breadth of the adds was solid with some asterisks attached to some such as Government Education on strike distortions. The high turnover and lower wage services lines such as Leisure and Hospitality (+128K) still have a major impact month-to-month, but that Leisure total payroll line number is still below the pre-pandemic level by almost half a million. Construction was strong (+25K) as we saw in the JOLTS report while Manufacturing was not a big mover (+19K) as that sector has seen an operating fade lately (see Capacity Utilization: The Fade Begins 1-18-23).
The above chart updates the unemployment rate history against the total payroll. It is literally a gross numbers game and that is a record payroll tally getting a paycheck. Despite the inflation warning label and impaired power of a 4.4% YoY gain relative to CPI or PCE inflation, it does not take advanced econometric modeling to conclude that more jobs bring more purchasing power in aggregate even if the per capita purchasing power remains under the thumb of inflation.


