
Footnotes & Flashbacks: State of Yields 12-10-23
We look at the latest curve moves as the jobs report tweaked what was a very quiet week.


With the CPI release and the FOMC meeting and dot plot teed up for this week, we assume this will be the last of the heavy action barring a geopolitical need for a market Heimlich maneuver over the holidays.
The running UST curve action has been wild but still understandable and will be sensitive to any hints of setbacks in inflation with PCE the next major ingredient after CPI on Friday Dec 22.
For now, the main events include a growing market conviction that plenty of easing lies ahead, and a belief that the FOMC at least has the inflation trend line on its side and a good case to make on sustained lower shelter inflation.
The oil market backdrop has direct side effects on the consumer sector as well as indirect effects across raw materials and the freight and logistics chain among other areas that roll up into producer and service provider pricing.
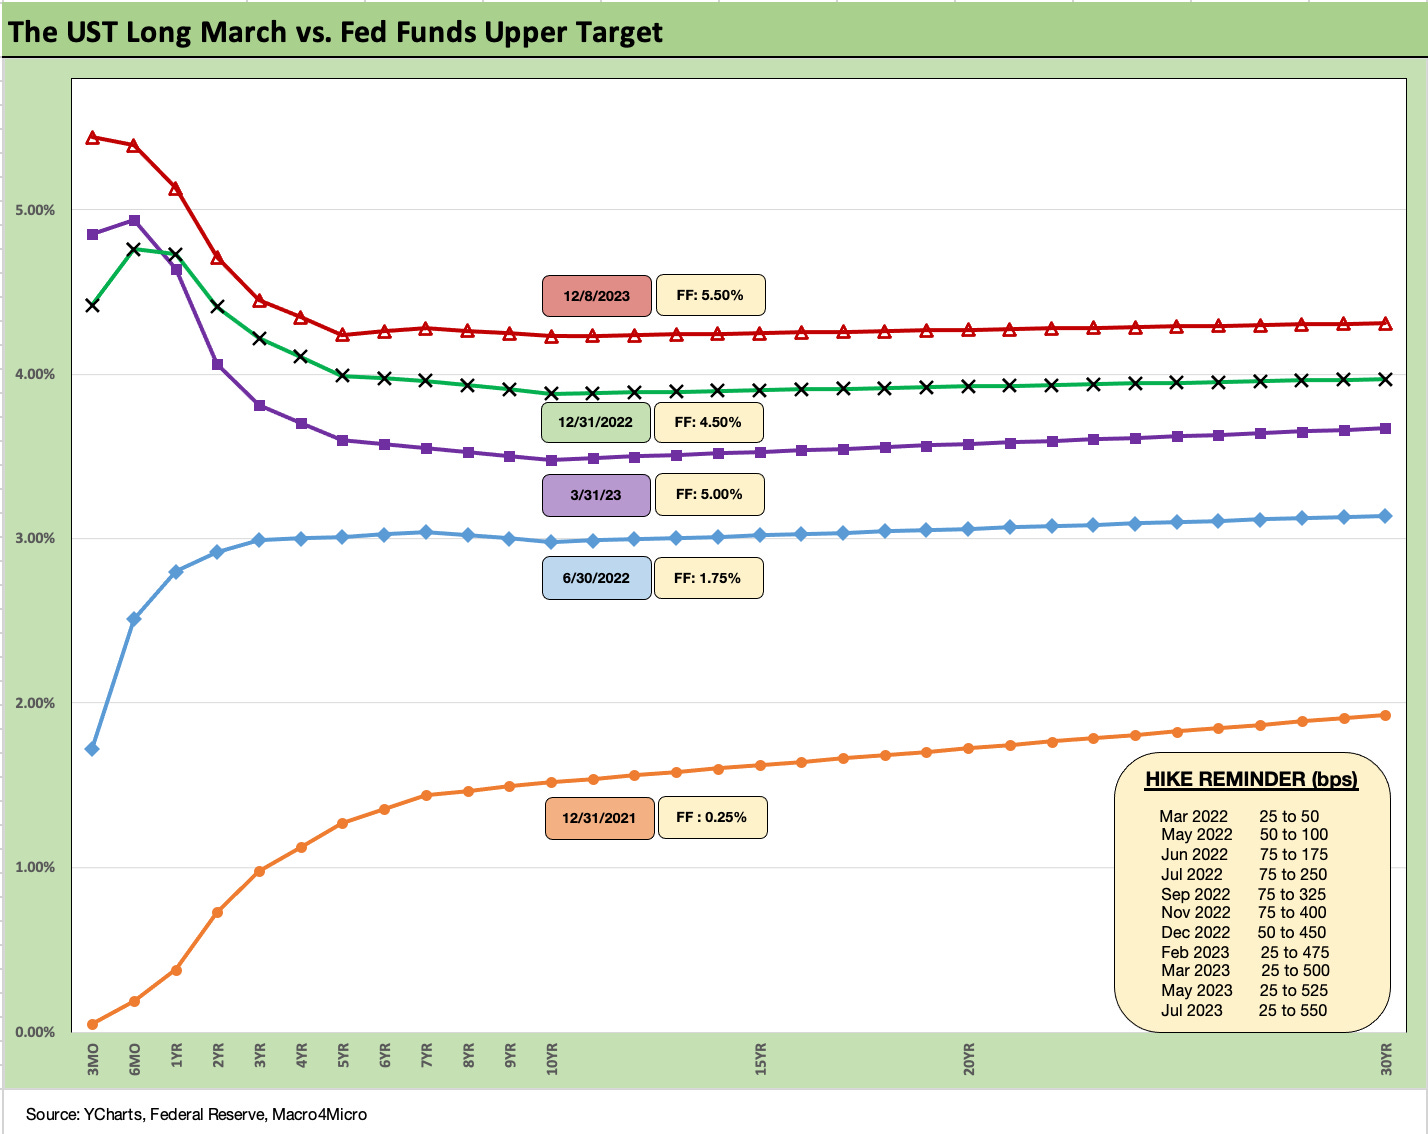
The above chart revisits the journey from the start of the tightening cycle with the running UST deltas from 3-1-22 broken out in the box. We include the usual memory jogger on the timing and magnitude of Fed hikes from mid-March 2022. The ride has been a long one and with varying speeds as we see in the next chart.
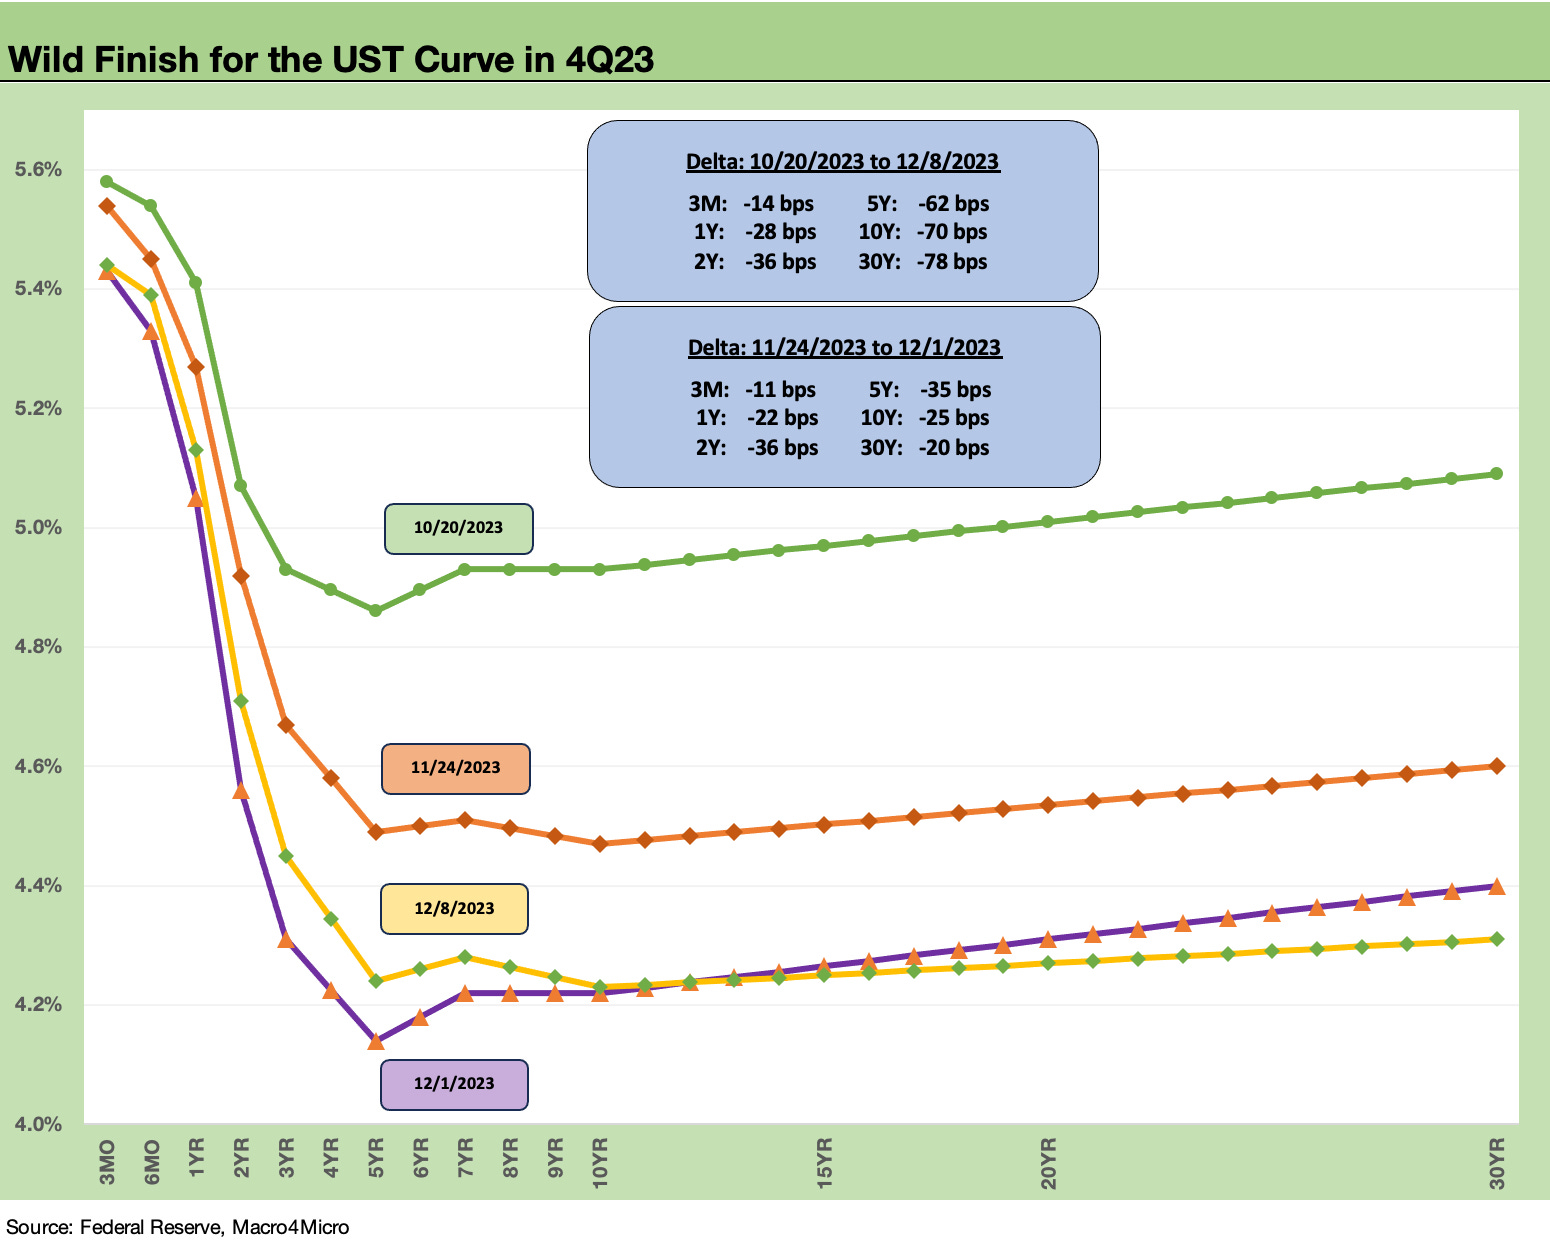
The above chart gives a good visual on the big rally in the UST curve since late Oct 2023 and then a fresh move lower from late Nov 2023. We include the deltas from late Oct 2023 (10-20-23 to 12-8-23) and the move from late Nov 2023 (11-24-23) to the date where we saw near lows on the 5Y UST (12-1-23). Late Oct 2023 saw a lot of negative running returns across bond asset classes as well as equities (see Footnotes & Flashbacks: State of Yields 10-29-23 , Footnotes & Flashbacks: Asset Returns 10-29-23), so these UST curve shifts drove a very impressive comeback.
The journey from 10-20-23 was a powerful bull flattener followed by a material downward shift on the 2Y to 5Y part of the UST curve. We look at the 2Y to 5Y and the 5Y to 10Y slope shifts further below in this commentary.
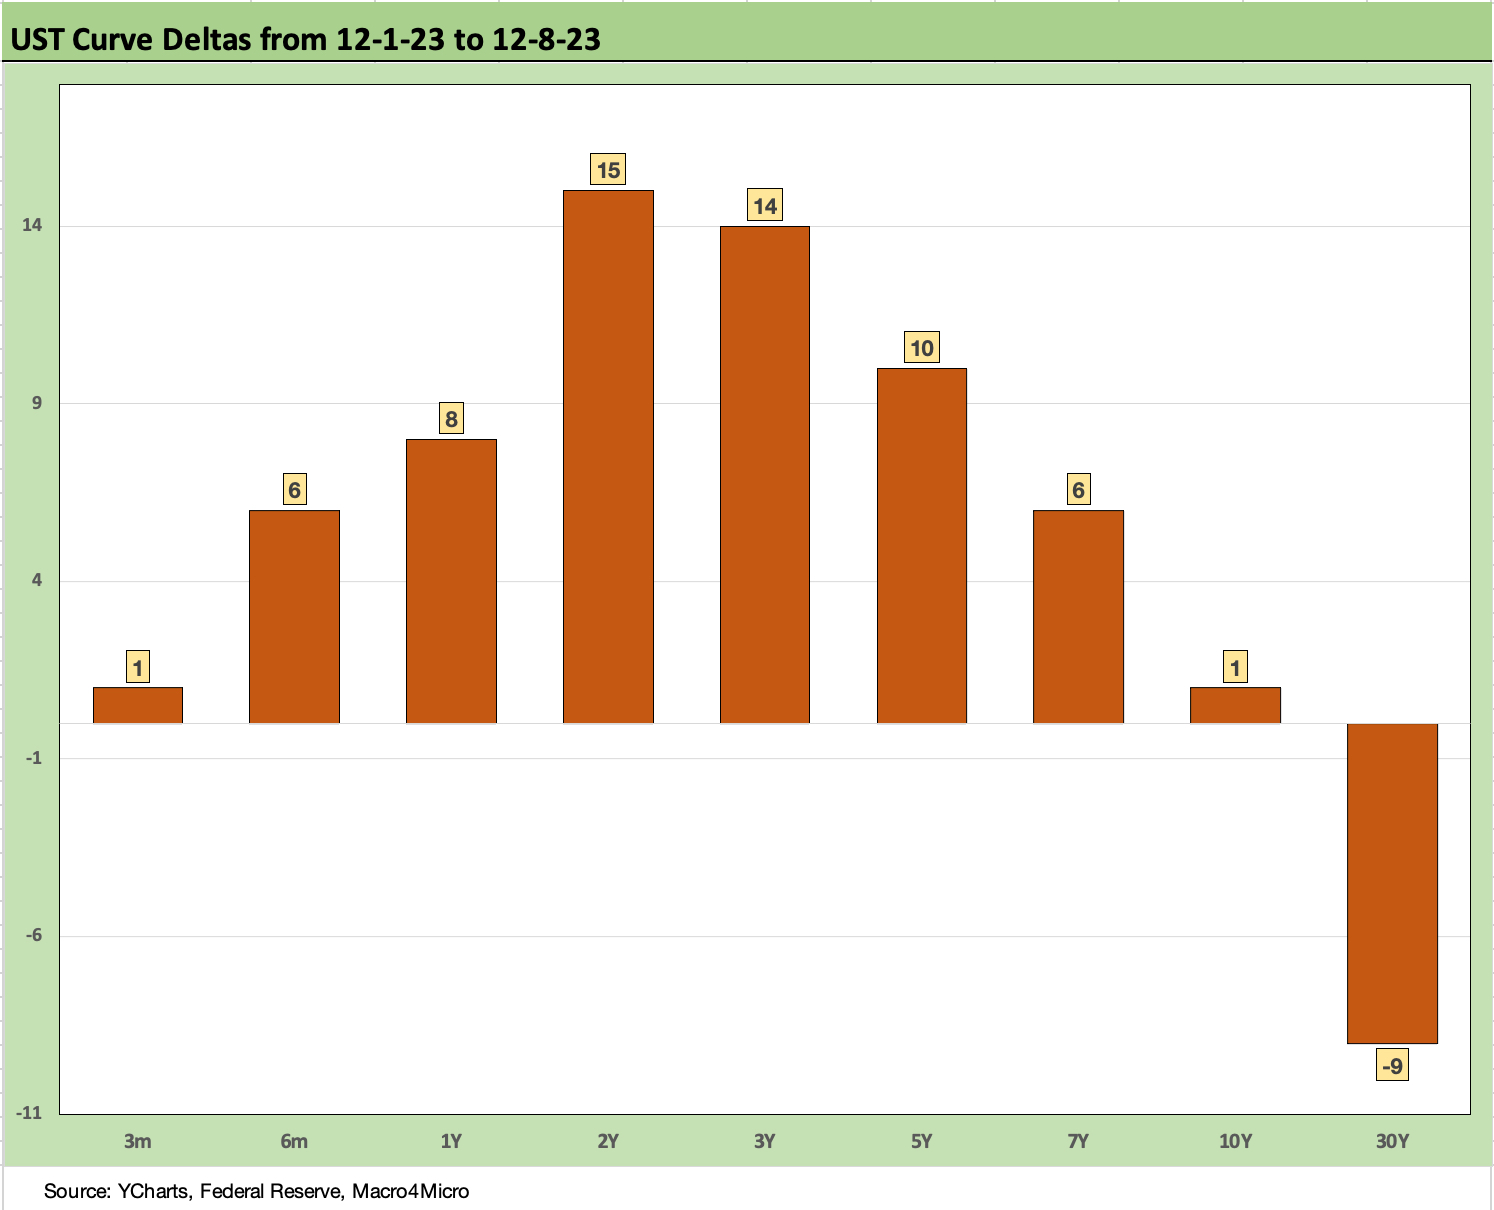
The above chart updates the UST deltas for the week, and we see the pop higher from the short end to the 7Y with a bit of “something extra” in the 2Y and 3Y. Most of the action was after the jobs report with some segments of the curve lower through Thursday before the action. The 30Y finished the week down anyway even after the Friday rise.
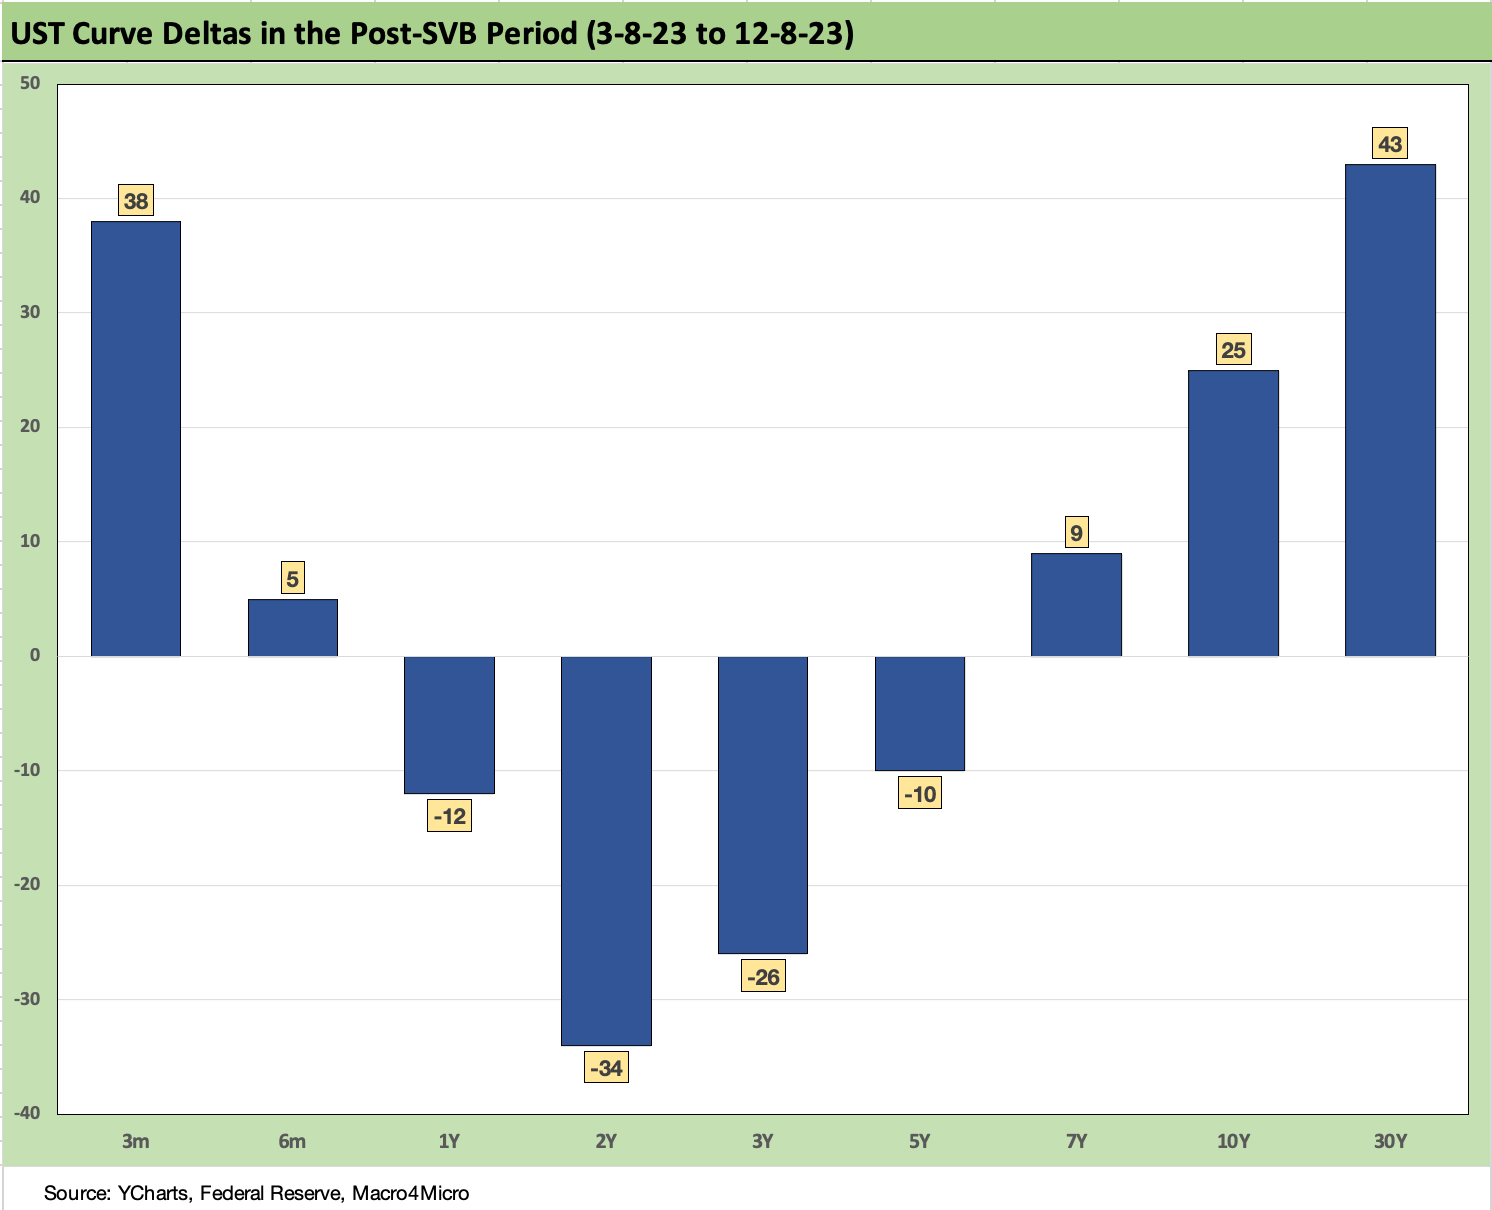
The above chart updates the UST deltas from 3-8-22, which was the last clean trading day before the Silicon Valley Bank collapse that set off the regional bank mini panic. We see the inversion get steeper from 3M to 2Y UST, and the steepening from 2Y to 30Y grow in the other direction with the 2Y UST declining. As we cover in the separate Footnotes publication on asset returns (see Footnotes & Flashbacks: Asset Returns 12-10-23), we still see long duration 20Y+ UST ETF (TLT) in the red YTD at -2.1% but with the overall UST ETF (GOVT) slightly positive at +1.8%. Duration is making a comeback but started in a big hole.
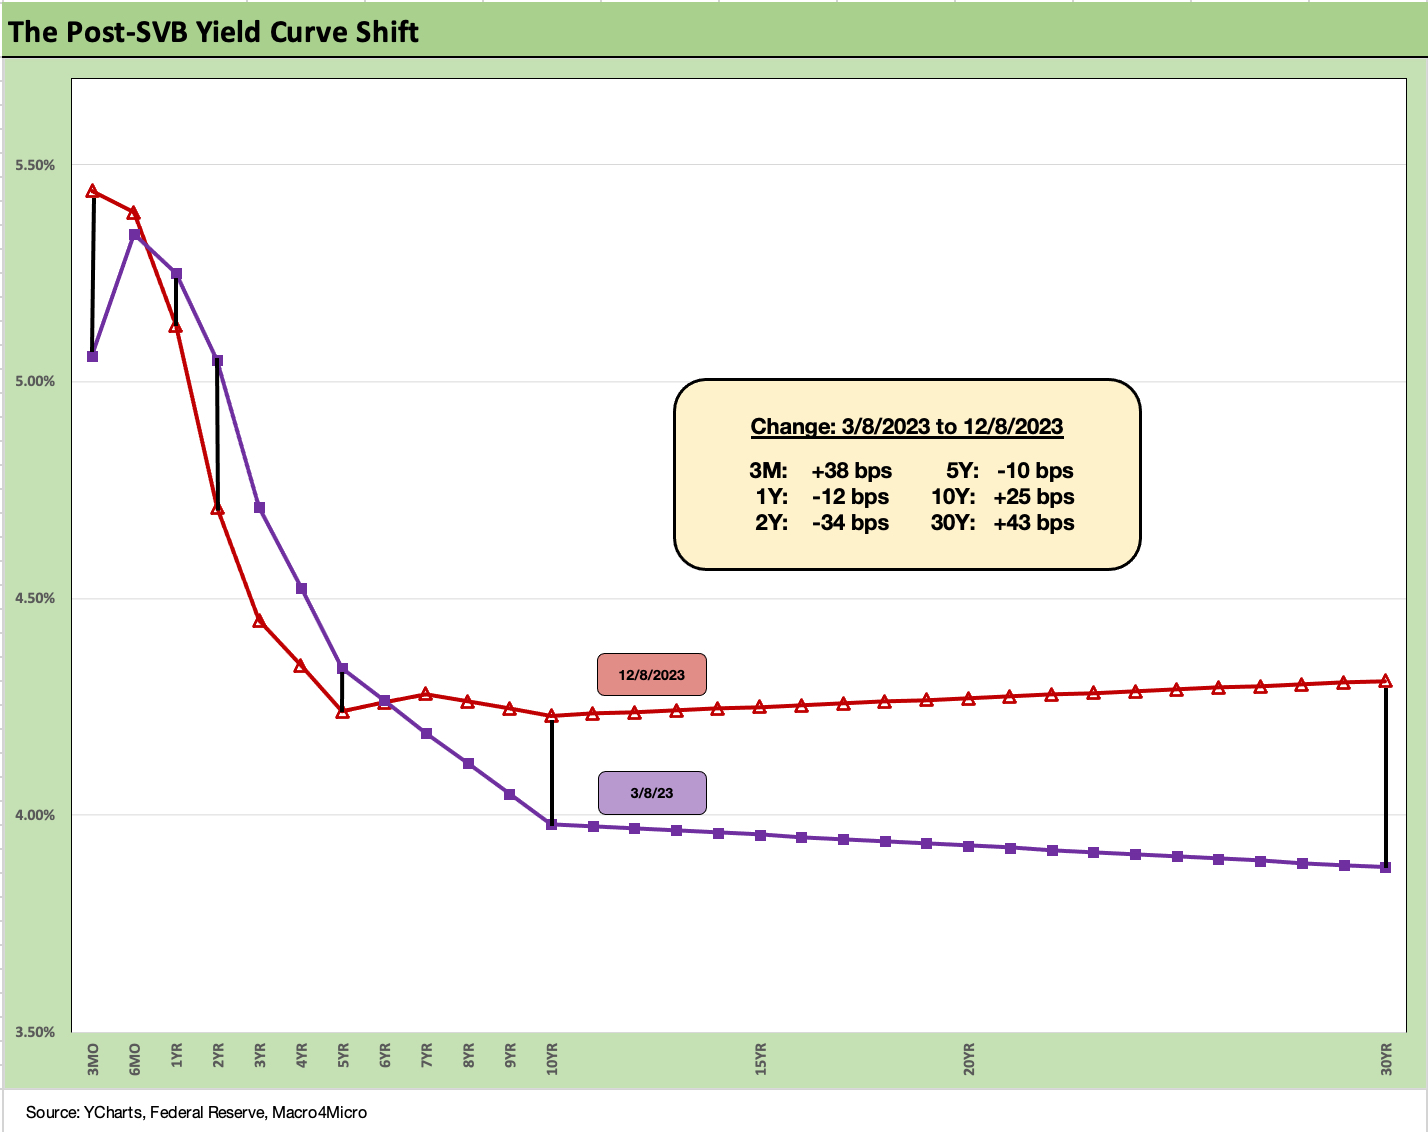
The above chart just takes the UST deltas after 3-8-23 from the prior chart and puts them in curve format. We see the bear steepener that unfolded across the year before the recent downshift and bull steepening rolled into the picture with a fresh round of shapeshifting.
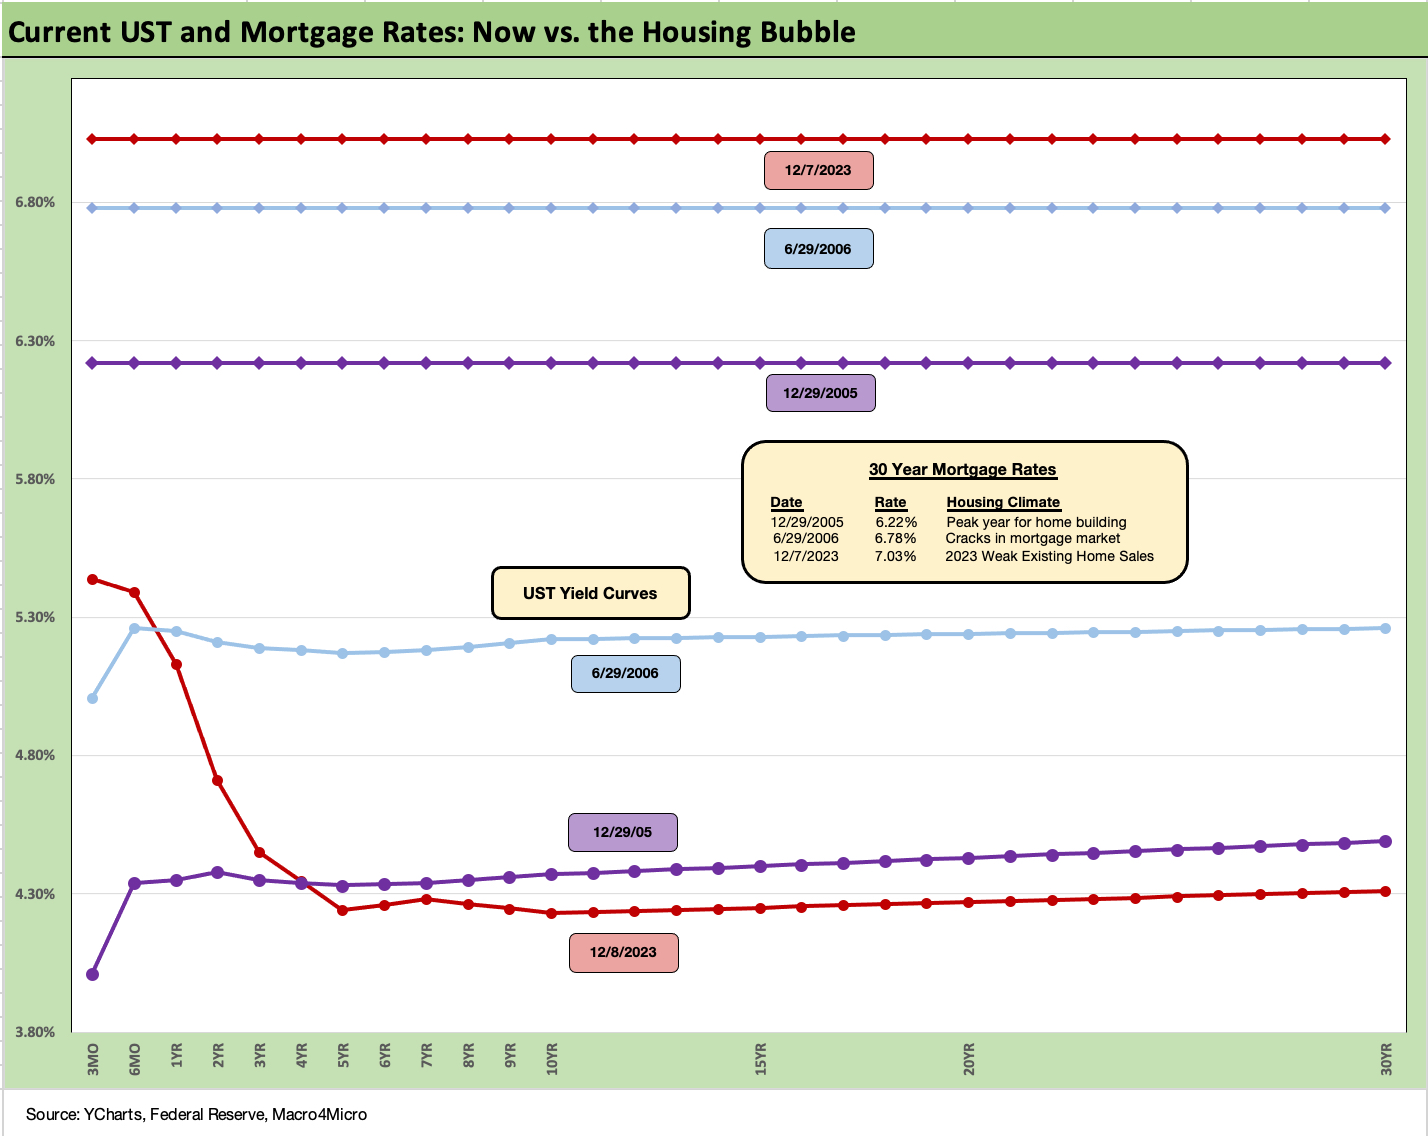
This is a chart where we carry over some of the commentary each week since we get new readers on an ongoing basis. The comparison of current mortgage rates to the peak of the housing excess of 2005 and 2006 makes for some interesting input on how to consider what factors can drive activity on new residential construction (“starts”) and existing home sales. We try to update as appropriate and tweak/add where needed.
As we cover in the separate Footnotes weekly publication on Asset Returns, homebuilder equities have turned in a stellar performance this year even in the face of a painful shift higher in mortgage rates across 7% and all the way to 8% before the recent rally. We have now retraced back almost to the 7% line, which still includes painfully higher monthly payment effects from this tightening cycle.
The bubble lookback years…
With this chart, we drop in the UST curves and the Freddie Mac 30Y mortgage benchmark for two periods from the housing bubble. The Freddie benchmark gets released each Thursday. The Friday quotes away from Freddie were again down to near 3-month lows.
The historical comparison above gives context to how strong demand can be with 6% handle mortgage rates such as in 2005 and 2006. The problem this time around is how much prices soared in 2020-2021 ahead of the Fed tightening cycle. We include the year end 2005 date as the peak homebuilding year and the middle of 2006 when the “liar loan” phenomenon and subprime excess was cresting.
In 2006, subprime was starting to show some cracks but was not yet sending the credit markets into a case of nerves. That would take more quarters to go by. Even then, equities only folded later in the fall of 2007 before the onset of a recession in Dec 2007 (that “official” date for recession was set much later by NBER).
It is notable that the current UST curve is now below the end of 2005 in 10Y UST (it has been running above it recently) but well below the intermediate and long end of the UST curve seen in mid-2006. Despite that UST configuration, the 30Y mortgage levels of 2023 are well above both 2005 and 2006. The 30Y mortgage rates were pulling away before this latest UST curve rally and remain almost a point above 2005. The mortgage vs. UST relationship is a reminder of how mortgage spreads have trended in this cycle vs. the years of overconfidence in the pre-crisis period.
Homebuilders and the mortgage buydown strategy…
Any downward moves in UST rates and mortgages make it easier for homebuilders to do even more attractive buydowns and keep their run rates on housing starts solid enough to push back on recession theories. The color from builders is that the high 5% handle range on 30Y mortgages appears to be the sweet spot for demand in their mortgage buydown programs, so that bodes well for housing in 2024 if the bullish street forecasts on the 10Y UST come true.
For the builders, the trick is targeting mix, regions, and margin hurdle rates on their communities. With so many potential sellers sitting on 3% handle mortgages (and even lower), the inventory is going to stay tight (see October Existing Home Sales: Searching for Lows 11-21-23 ).
This past week, we saw record results (revenue and earnings) out of Toll Brothers, the #4 builder, and this week will see a bigger national sampling of trends with #2 Lennar, who is much larger than Toll and operates across more price tiers (see Credit Crib Note: Lennar (LEN) 11-22-23).
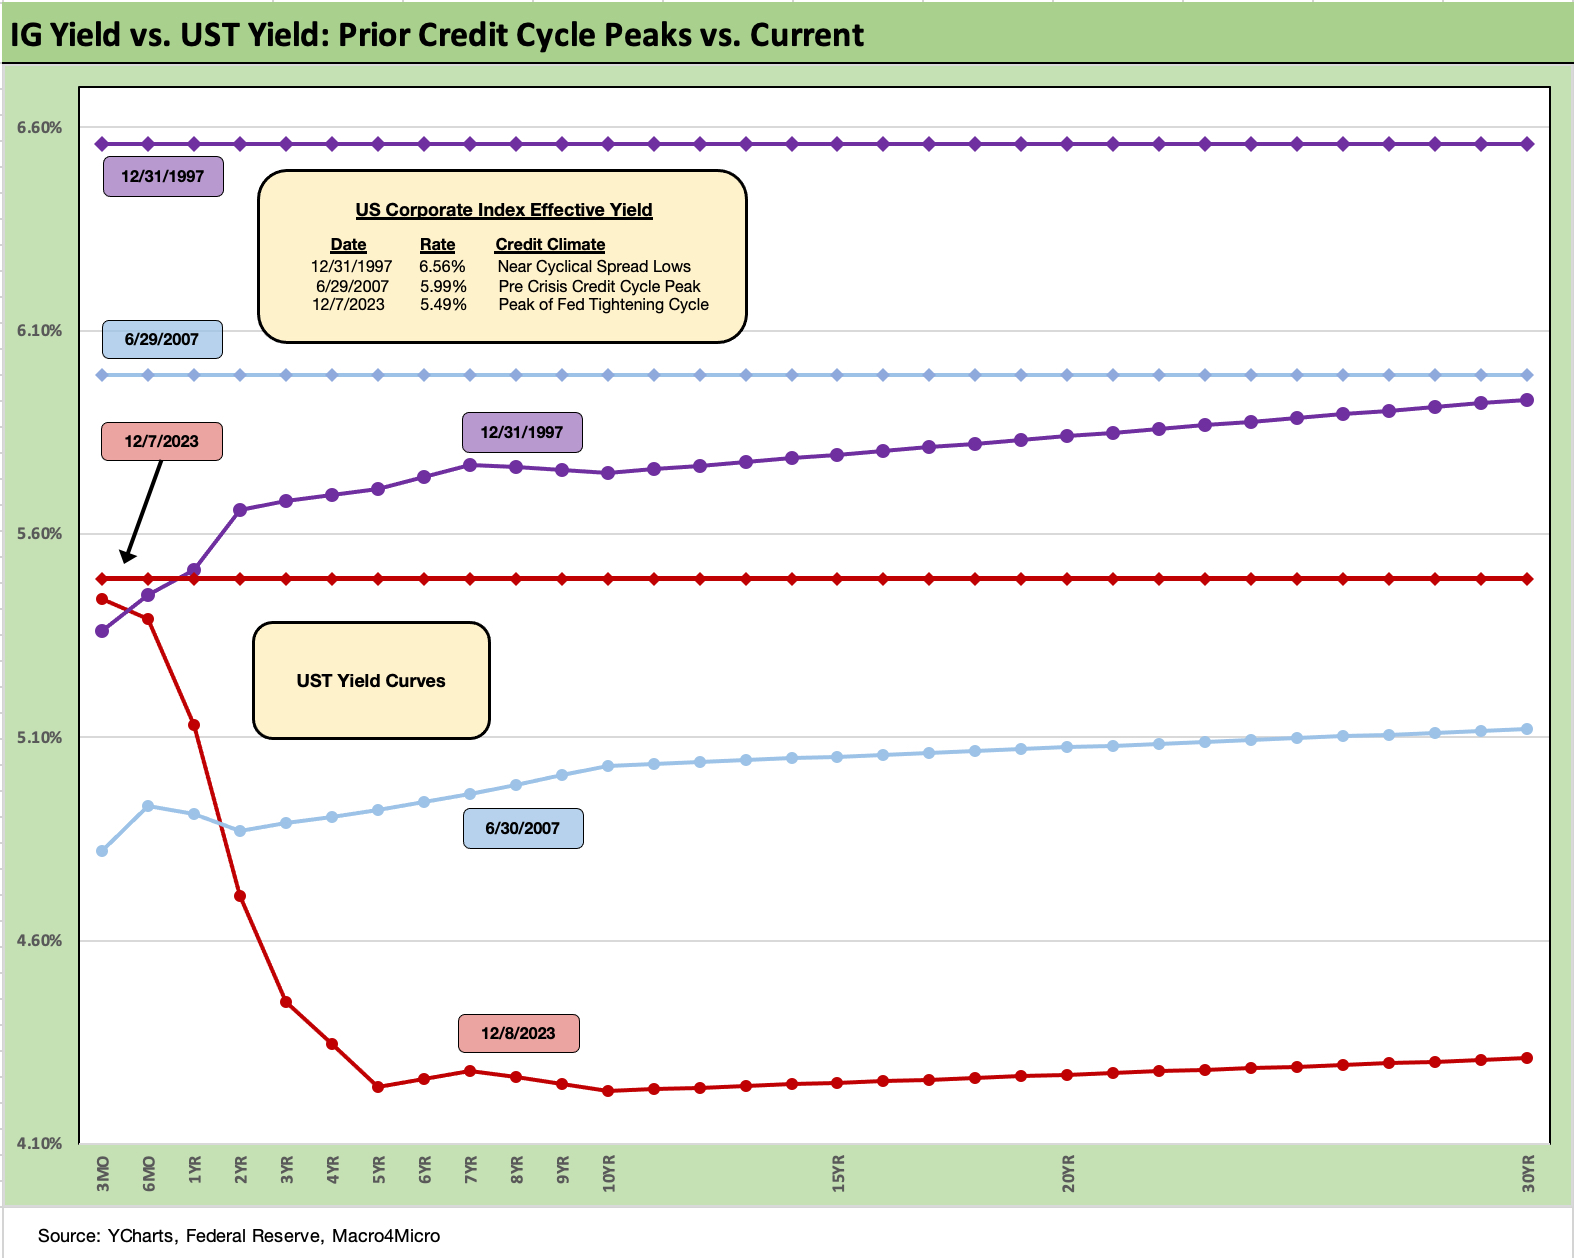
The above chart goes through a similar “then vs. now” exercise for the current UST curve and IG index yield. We compare current days to earlier credit peak periods (1997, 2007) when the IG corporate bond market was at or near credit spread lows.
Spreads were tighter in those peak periods of 1997 and 2007 than recent times, but this latest run in IG is closing in on 2007 with the ICE IG index closing last week at +110 bps (12-8-23). For the past week, IG spreads tightened by another -1 bps. That makes -18 bps tighter on the trailing month, which is a strong performance by IG standards.
The ICE IG index OAS is around 25 bps through the long-term median, so spreads are still not signaling trouble or fears around a material spread wave along the speculative grade divide (see HY Credit Spreads: Migration, Medians, and Misdirection 11-6-23).
As we look back across periods of spread compression near credit cycle peaks, the +70 bps for the IG index at the end of 1997 was much lower than today (the low was in Oct 1997 at +53 bps). The 1997-1998 average for IG OAS was +95 bps. Those offer some historical context for today’s post-rally levels.
In 2007, as the market was looking questionable by midyear, IG OAS was at +100 bps at 6-30-07 at the credit bubble peak. IG spreads were widening by mid-2007 after the period from 1H04 through 1H07 saw IG OAS averages in double digits at around 93 bps. The lows in 1H07 of +86 bps and IG OAS of +100 to end June 2007 were not far from lows in 2H06 at +90 bps and 1H06 at +87 bps.
The takeaways from the 1997 and 2007 periods were that those risk premiums were in stages of the cycles that were on shaky ground given the direction of credit quality. That is where the “What comes next?” questions come in today whether that be around Fed policy, cyclical trends, geopolitics, Washington policy actions, underwriting quality, outflows in less liquid assets, and the list goes on.
As we now know, the market events got very noisy after those 1997 and 2007 periods and dramatically so after June 2007. The 1998-1999 period was a protracted period of global credit volatility (Asia, EM, LTCM, etc.) ahead of the launch of the eurozone credit markets to start 1999. For TMT, it ended badly.
The resilience in the risky asset markets (HY and equity alike) in the late 1990s was remarkable in retrospect given the ability of the US credit markets to decouple from Asia and then the broader EM turmoil that helped send LTCM into a “soft bailout” crisis. The ability to turn away from risky Yankee deals in late 1997 and into 1998 was clear enough, but the tech enthusiasm in the equity markets was hard to shake with the NASDAQ at +86% return in 1999 even with the default rate materially higher by 4Q99.
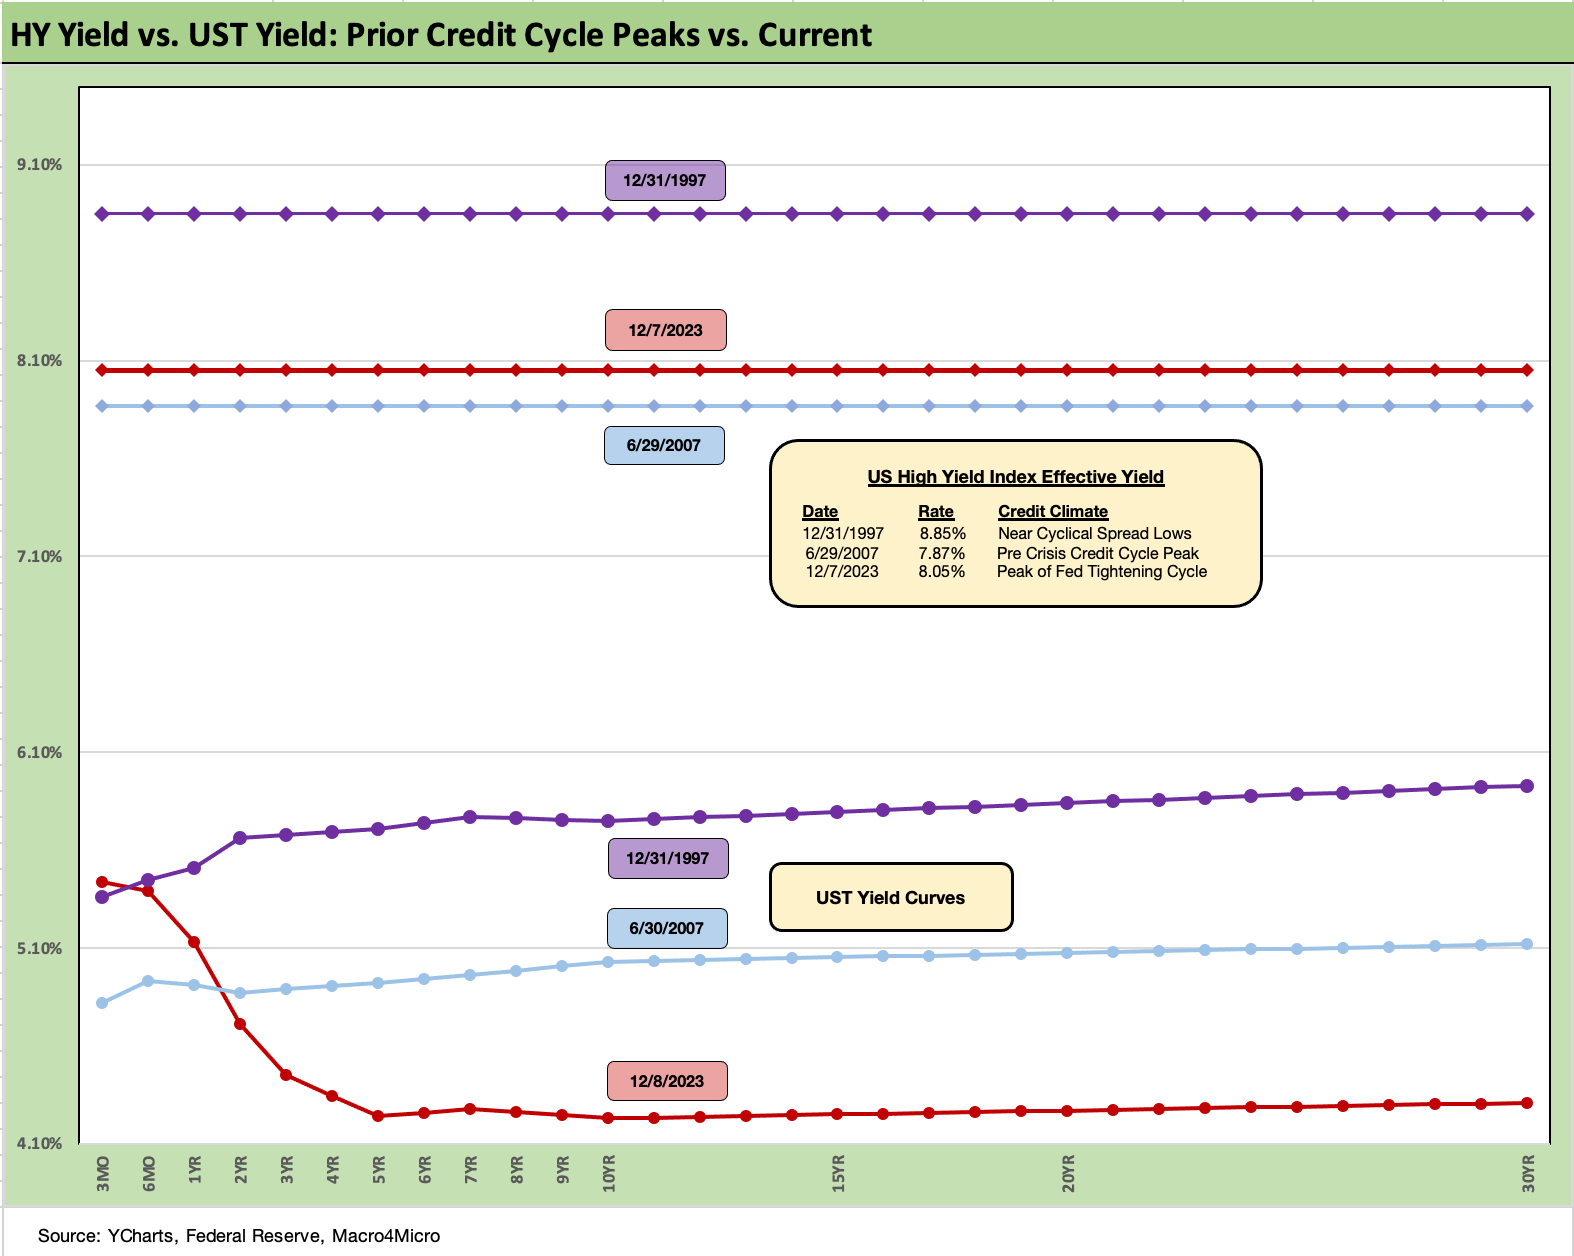
The above chart does the same drill for the US HY market as we did for the IG market. We use the same dates (1997, 2007) as IG to frame the symmetry of risks today. We saw HY OAS at +296 bps (12-31-97) although HY OAS had been inside +250 bps in Oct 1997 (+244 10-17-97). The 1997 period saw average spreads of +282 bps in 1H97, +270 bps in 2H97, and +298 bps in 1H98 before the summer storm of Russia and LTCM rolled in from August into the fall.
The peace and quiet of 2007 was very short-lived relative to 1997. HY OAS averaged around +270 bps in 1H07 vs. HY averaging +270 in 2H97, so the two periods have some common features in spreads. During the crazy period of June 2007 as the market fuse was burning down, we saw HY OAS of +298 bps on 6-30-07 (as tight as +244 on 6-1-07) vs. the +375 bps to close last week (12-8-23). We saw -12 bps of HY OAS compression last week.
In terms of this latest compression wave, HY OAS was a dazzling -49 bps tighter during the week of 11-3-23. The BB tier was -52 bps tighter during the big rally week of 11-3-23, the B tier -47 bps tighter, and the CCC tier -24 bps tighter. For the trailing 1-month through 12-8-23, the BB tier is -31 bps tighter, the B tier -41 bps tighter, and CCC tier -63 bps tighter.
HY OAS in multicycle context…
The absolute OAS in historical context and relative to the risk free and lower risk alternatives do not stack up well vs. history and medians (see HY Credit Spreads: Migration, Medians, and Misdirection 11-6-23). They have tightened materially across the year from year end 2022 (+481 bps ICE) to the current +375 bps. The -106 bps in compression shook off any cyclical or geopolitical nerves. We had expected HY OAS to get shaken by now from such tights, but it has not happened.
These levels are well below the long-term HY median of around +471 bps, so the risk-reward symmetry is getting shaky. With UST in rally mode, equities hitting new 2023 highs, and institutional flows from such areas as pensions favoring increased allocation credit and favorable all-in yields (5.6% IG, 8.4% HY), the demand side for risk is driving the bus more than relative value in spreads.
For reference points, we can once again start talking about the June 2014 lows (+335 bps on 6-23-14) and Oct 2018 lows (+316 bps on 10-3-18). Those 2014 lows and 2018 lows are 2 or 3 good months away. Those lows were not like 2007 or 1997, but lower +300 handle HY index OAS levels are rare. It is worth remembering that the periods after the Oct 2018 lows and June 2014 lows did not go well.
The all-in yields are hard to resist for many. On 6-23-14, the HY YTW was 4.85% while 10-3-18 posted YTW 6.24%. Both of those yield backdrops are substantially below the 8.36 % HY index YTW to close on Friday (12-8-23). An asset allocation strategist can be forgiven for chasing yields that high even if the risk premium is too low in historical context vs. lower risk alternatives. Yield bogeys can carry the day for many, especially after 15 years of yield starvation since the credit crisis.
The 5.6% yield in IG corporates leaves ample room for debate on the relative asset class value of IG vs. HY in expected returns. If you are thinking soft landing or mild recession and easing, the old trade-off of duration and interest rate risk vs. credit risk comes into play. If you are thinking hard landing, then IG is the safer play vs. HY. That is a topic for another day in planning for 2024.
Fundamentals have been in aggregate solid, and 3Q23 earnings season did not signal trouble in the immediate context of spreads. Equity watchers cite the bottom of earnings YoY trends and a favorable outlook ahead for earnings growth.
For the HY energy sector names, oil has been well behaved so far in all the Mideast turmoil and even dropped briefly below $70 handles in the most recent week. OPEC differences on supply and production quotas have been in the news in recent weeks even as fresh news came of more record US oil production and natural gas production. The demand side of the equation (notably in China) is seeing some second guessing.
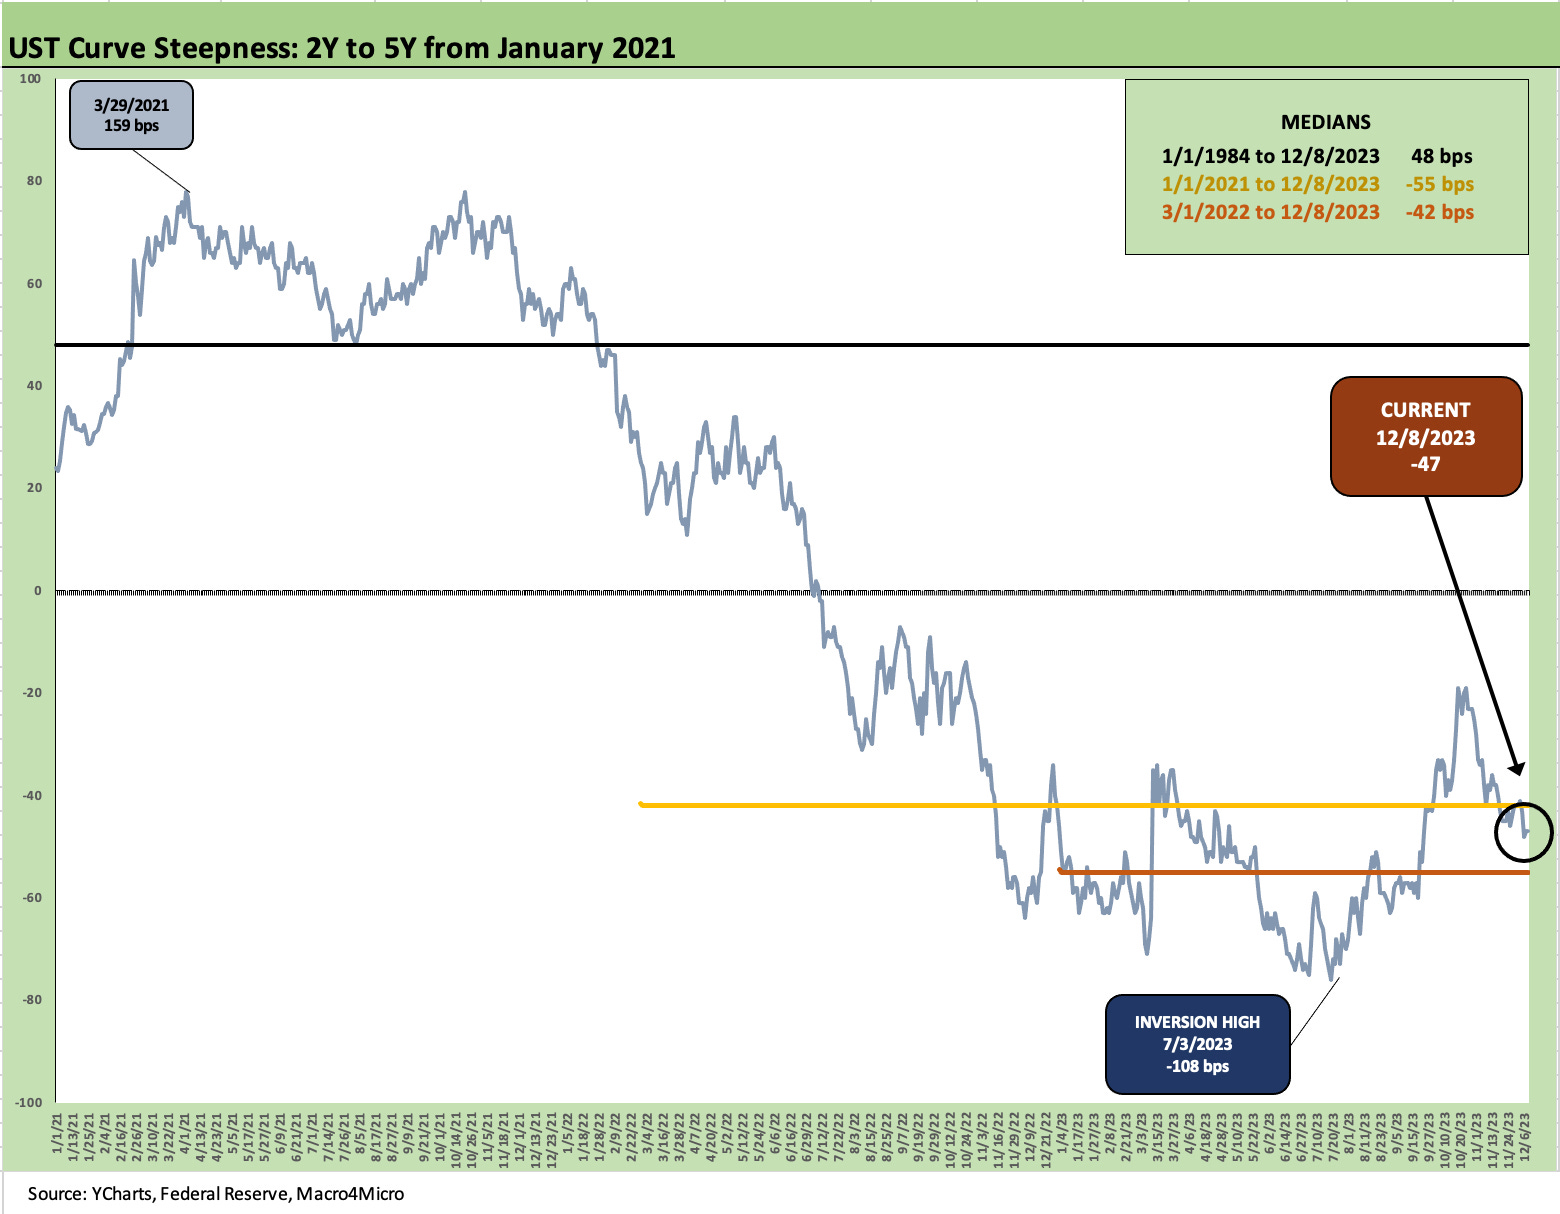
The above chart updated the 2Y to 5Y slope across the period from Jan 2021. We include the medians in the box in the upper right that capture the long-term median (post-1984), since early 2021, and across the tightening cycle (from March 2022). We still see a material inversion relative to the long-term relationship although the inversion is well below the -108 bps of July 2023.
The relationships get back to the question of “What happens if the Fed does not ease due to various inflation related factors?” If the more natural state of the curve is to be upward sloping (based on history, term premiums, etc.) then the return to a “steepening toward a flattening” will get back in the dialogue. We already got a taste of that before the recent rally. With record UST supply ahead in 2024, the investor will be looking to be compensated for his risks. If for some reason higher oil prices and waves of new tariffs promised by Trump start to get forecasted in product and services pricing, there will be a UST curve effect.
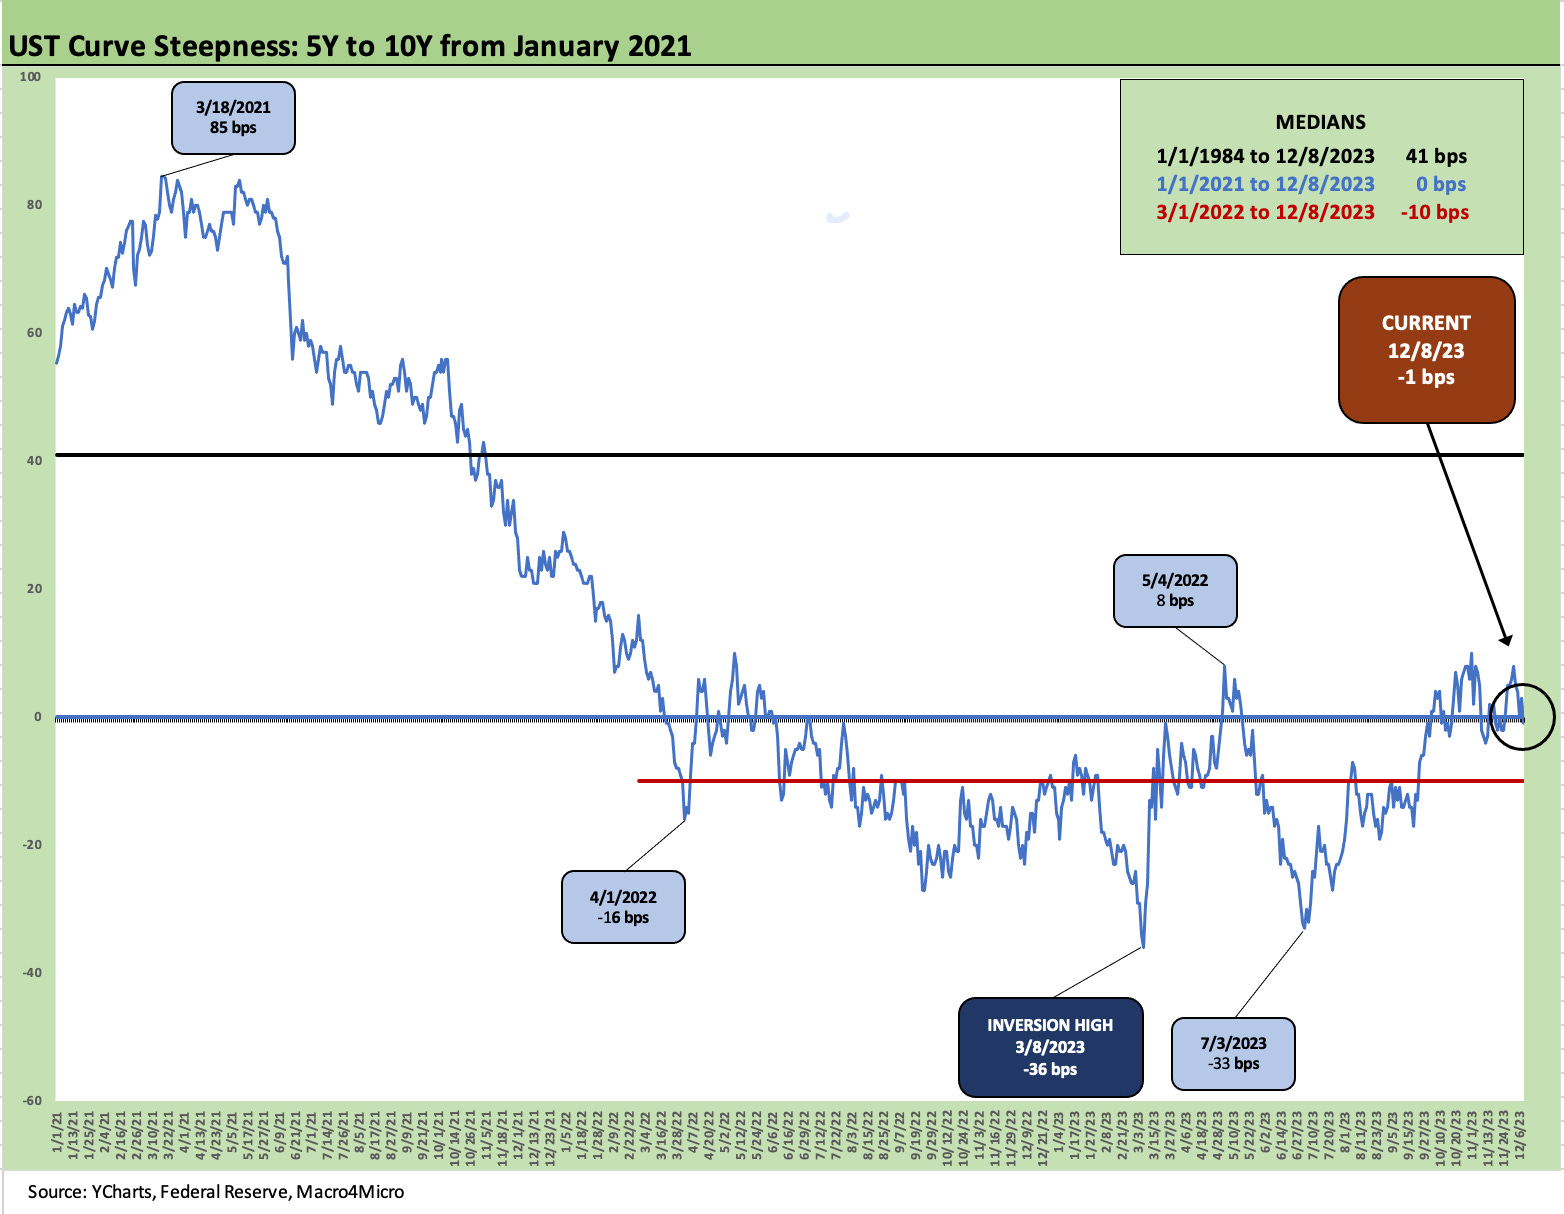
The above chart shows how the 5Y to 10Y slope had briefly pushed back to upward sloping before the latest move back to essentially flat at -1 bps. Across the post-Jan 2021 period the median was flat and post-tightening was -10 bps. The long-term trend line is for upward sloping at +41 bps. The peak inversion was -36 bps just ahead of the SVB collapse.
The 5Y to 10Y slope is an important one for housing with the 10Y as the reference point in pricing 30Y mortgages. The 10Y and 30Y reference points are also quite important in the economics of debt financed M&A for IG companies. The 15+ year share of BBB face value is almost 28% while the 7Y to 10Y is another 16% of the BBB tier.
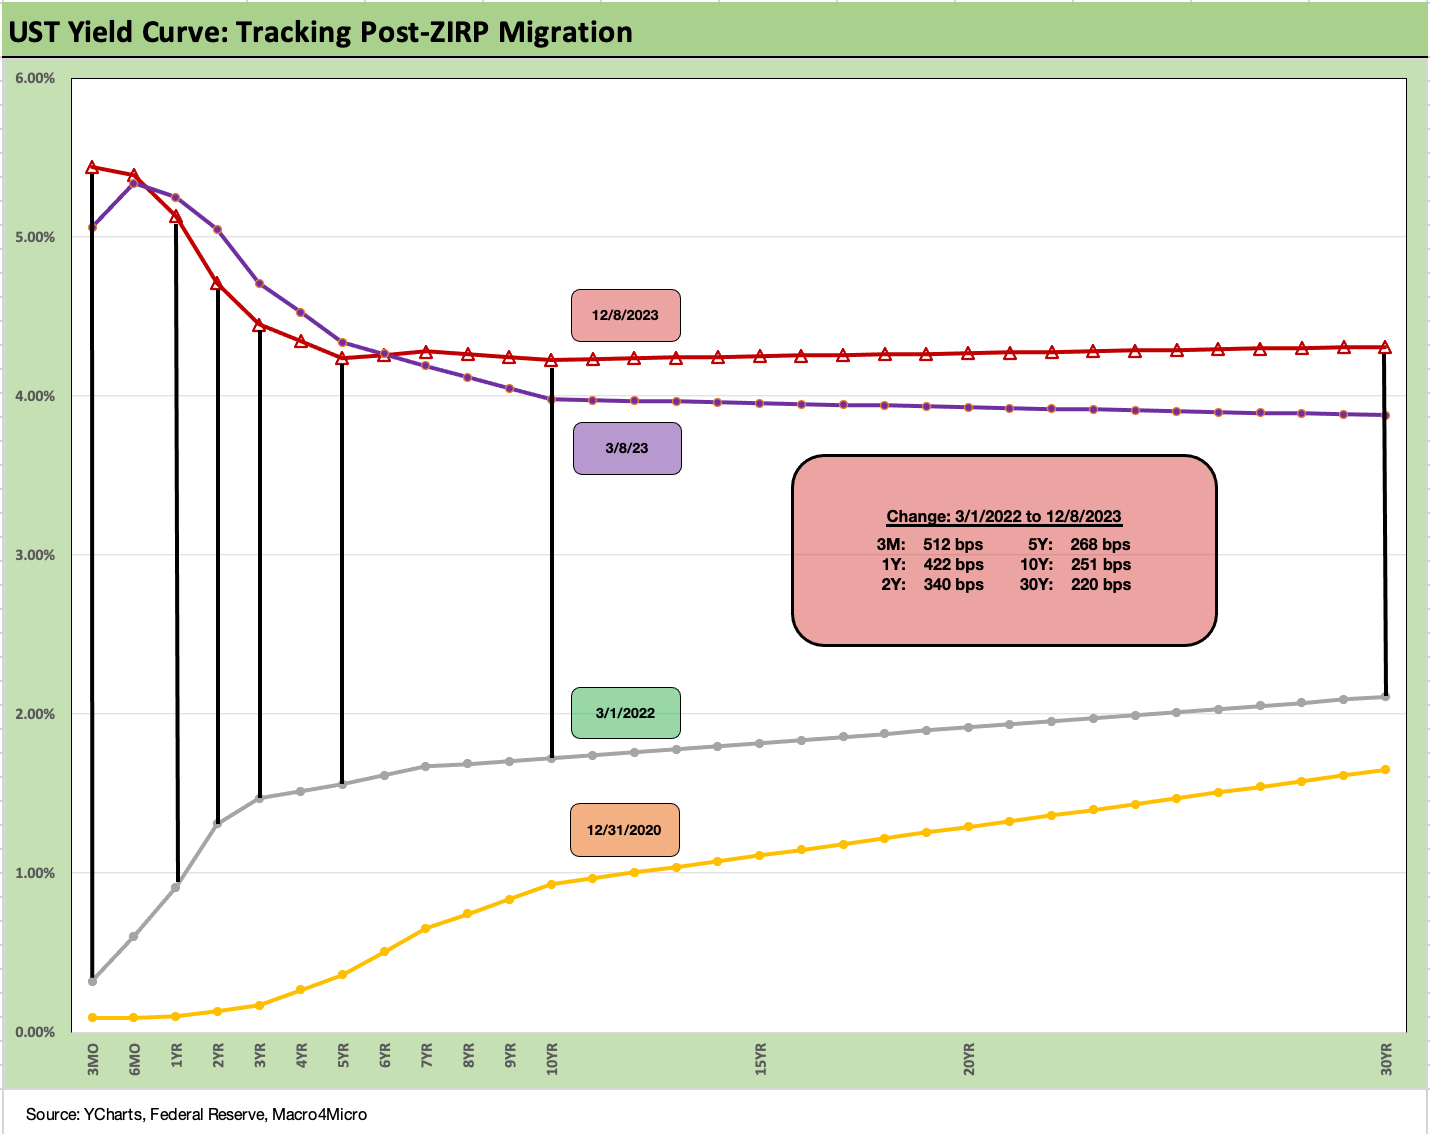
The above chart is our usual wrap-up visual and updates the running UST curve deltas from 3-1-22 or just before the end of ZIRP at mid-month. We include a 12-31-20 yield curve as a frame of reference.
The bear inversion that had unfolded across time is now giving way to a bull steepener with the 5Y to 10Y flattening out somewhat after a brief and painful bear steepener from 5Y to 10Y (see Footnotes & Flashbacks: State of Yields 10-21-23 10-21-23) before the recent rally. There is still a lot of action that can play out on the front end with the Fed and in the 1Y, 2Y, and 3Y UST in coming weeks with the 2Y dropping below 5% over the trailing month and the 1Y still riding above that magic 5% line.
We await the CPI numbers and the FOMC dot plot and commentary to see if the year can end on a good note for fixed income.
Contributors
Glenn Reynolds, CFA glenn@macro4micro.com
Kevin Chun, CFA kevin@macro4micro.com