
Footnotes & Flashbacks: Asset Returns 10-29-23
We look at comparative asset returns in a rare UST friendly week.


The week gave the fixed income asset classes a reprieve with a flattening of the UST curve and little reaction to the very strong 3Q23 GDP numbers and the very robust consumer spending in the Friday PCE report.
Tech earnings so far have not been magnificent to all of “the 7” as evident in a bad week for the NASDAQ and some divergence in the mega-cap names ahead of Apple this week.
With Ford and GM reporting mixed earnings and withdrawing guidance with the strike effects uncertain, the week ahead has a slew of bellwethers among the earnings reports with around half of the S&P 500 still to report.
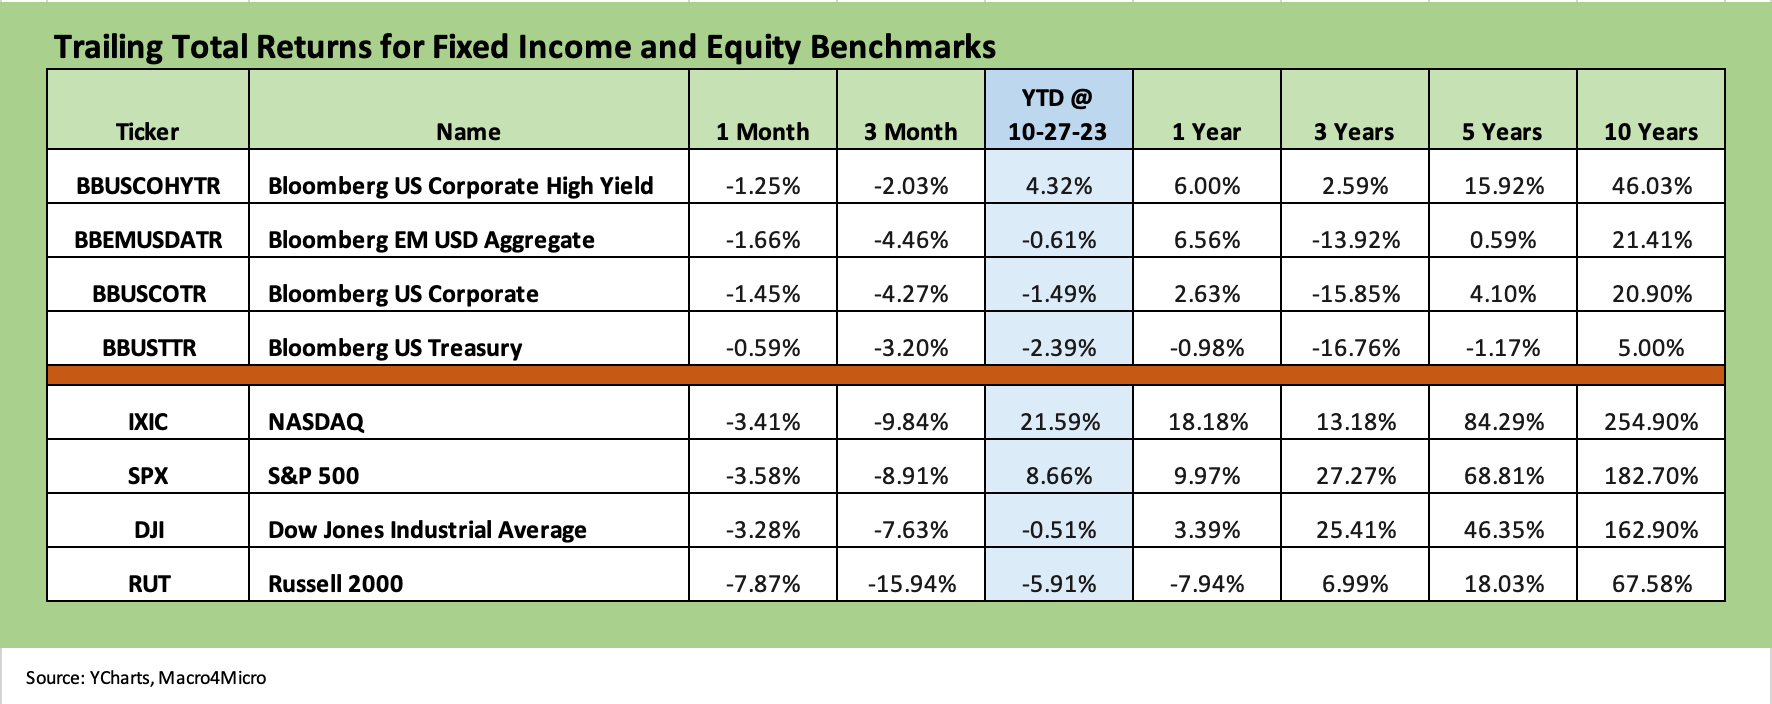
The above chart lists the debt and equity benchmarks that we watch in descending order of total return for the YTD period. We still see the trailing 1-month and 3-month period in the negative zone for all line items. For the YTD period, we see HY still hoping for a coupon year in total return, but EM, IG, and UST are in the red.
This past week was kind to duration and more or less neutral on spreads in IG and HY, with credit tighter by a small fraction in IG (per ICE) and HY very slightly wider on weakness in the CCC tier. We look at the yield curve dynamics in a separate Footnotes publication and detail a mix of fixed income ETFs and industry ETFs further below.
Equities had another bad week with all the benchmarks in the red but small caps still sending bad signals to the US-centric base of companies in that space. Those in the small cap universe correlate more with the long tail of smaller cap HY and private credit borrowers. There are not a lot of positive, forward-looking vibes in these numbers.
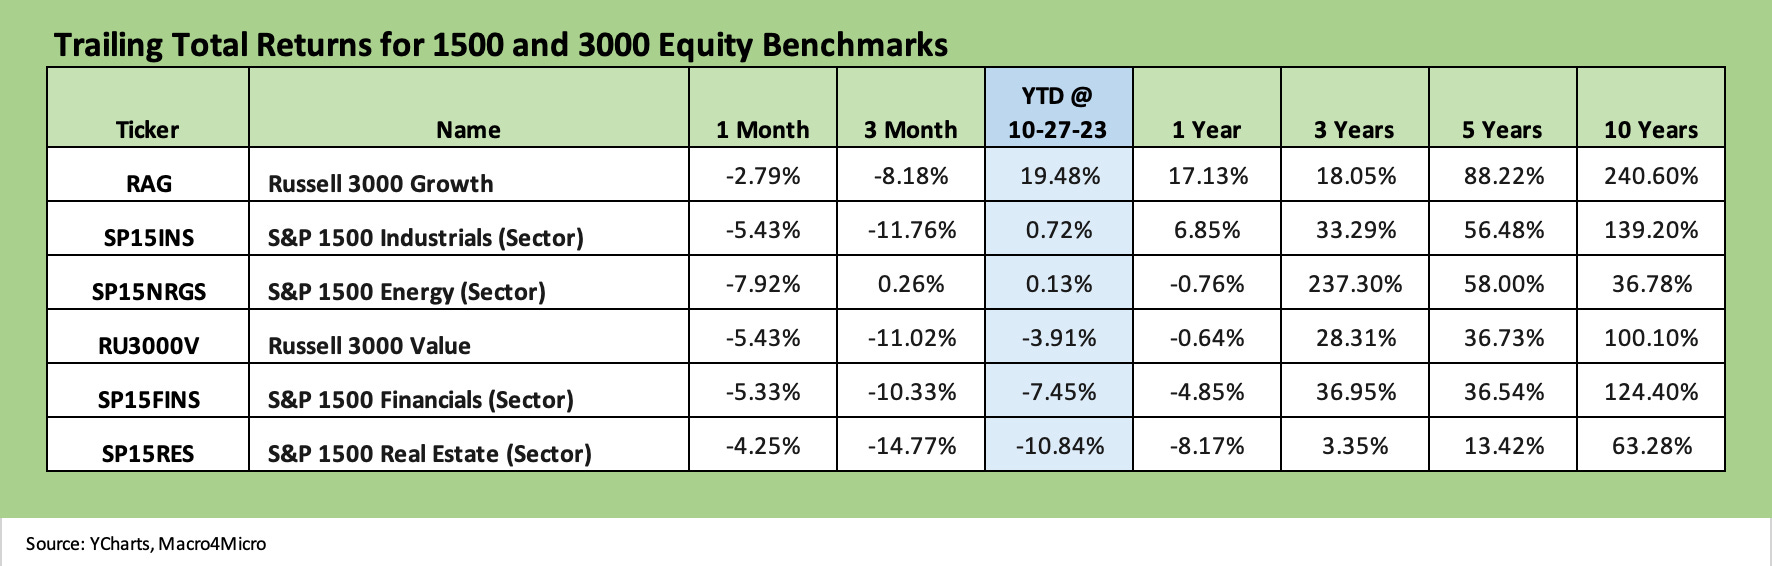
The above chart updates the 1500 and 3000 series. We also line those up in descending order of total return for the YTD period. The numbers are still shaping up ugly in recent periods with negative returns for 1-month and 3-month, with the exception of Energy which managed a marginal positive that rounds to zero for 3 months.
For the YTD period, we see Industrials still barely in the black YTD with Energy also a sub-1% return. The UST-curve-sensitive Financials and Real Estate are still sitting in the red zone YTD and materially underperforming cash.
ETF and Benchmark Returns
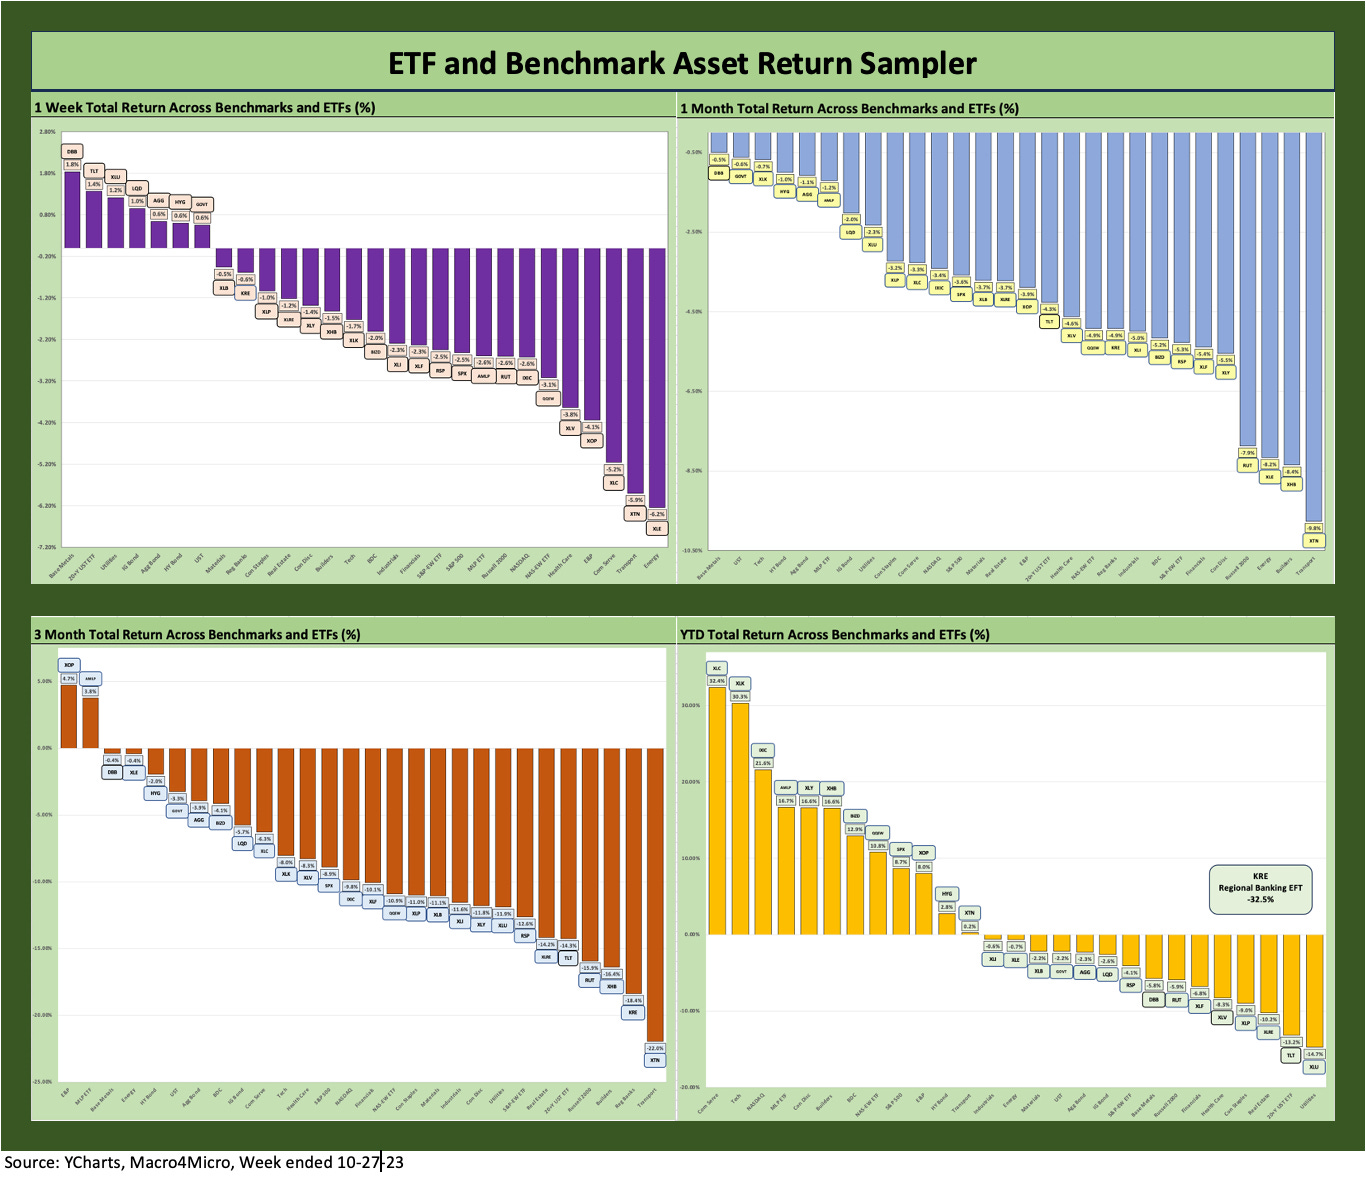
In the next section, we update our usual asset class subsector returns through a mix of ETFs and market benchmarks. We added the chart below for a quick visual on the relative symmetry of returns before we get into the weeds.
The visual makes a clear statement that the 1-week, 1-month, and 3-month time horizons are fairly grim as asset classes have struggled across equities and debt and across industry valuations. On YTD basis, the balance of positive and negative is biased toward negative at 12 to 16.
Time Horizon Returns
In our individual asset return charts, we cover 1-week, 1-month, 3-month, and YTD time horizons for a range of ETF and benchmark returns. We look at 28 different benchmarks and ETFs that cut across a wide expanse of the economy.
We recently added the YTD version as we are now in the 4Q23 period. The usual question of “What kind of year was 2023?” is starting to look for a general description. The year is shaping up as a bad one for fixed income and a weak one for equities outright but especially in terms of large cap breadth and for small caps.
We see the equal weighted S&P 500 in negative range YTD, the Dow is negative YTD, and the small cap Russell 2000 is also negative. Time is running out to achieve a median year.
The Magnificent 7 has carried the S&P 500 into the positive zone, but that is not a real portfolio with prudent diversification. NASDAQ has been a winner in market cap weighted or equal weighted, so that is something. It will take a serious six-week run to pull this out for equities with a lot of the same macro questions still in play.
2023 vs. 2018: the year 2018 sets the standard for a bad expansion year…
As detailed further below, at least there are a lot of subsectors and industry ETFs well in the black YTD. We have seen materially worse years than this even during cyclical expansions. For a year where cash came in at #1 in returns vs. debt and equities, the year 2018 immediately leaps to mind. That was also a year with minimal returns on cash unlike 2023. The aftermath was that 2019 was an excellent year for risk, and that is when we get into the outlook debates for 2024 that still lie ahead.
It is no coincidence that 2018 was the end of a mini-tightening attempt (more like a stab at normalization) ahead of some 2019 easing on economic weakness that year. The year ended on a terrible note in 2018 and brutal Dec 2018 in HY. That occurred in what was still an expansion year for the cycle. Then COVID came shortly after the bull run in 2019.
A 2018-style limp to the finish line is still a risk in 2023 from equities to HY. That great HY performance in 2019 came after a very poor 4Q18 and obscenely bad December. It is all about time horizons and patience in the end with a lot of homework behind it.
We dropped in some equal-weighted ETFs for a reason…
We recently added equal-weighed ETFs for the S&P 500 (RSP) and NASDAQ 100 (QQEW) given the market cap weighted distortions in the total returns for those benchmarks that had been driven for much of the year by the mega-names.
The YTD return profile for market cap weighted ETFs vs. Equal Weighted ETFs offer a clear reminder of what an unusually imbalanced year 2023 was to this point.
The SPX returned +8.7% YTD as of this past week while the S&P 500 equal-weighted ETF (RSP) weighed in at -4.1%. It is never a good year when the equal-weighted S&P 500 materially underperforms cash. With respect to the more tech-centric benchmarks, we see NASDAQ at +21.6% but the Equal-Weighted NASDAQ 100 ETF (QQEW) at +10.8%.
We added the TLT ETF for a cleaner read on duration…
We also recently added another fixed income ETF to the mix with the addition of the iShares 20+ Year Treasury Bond ETF (Ticker TLT). We see TLT as a good proxy to add to the collection for a more concentrated look at how duration is performing each week. We have LQD, GOVT, and AGG already in the high-quality fixed income mix (HYG in low quality), but TLT adds some extra price volatility tied to the steepening vs. flattening scenarios.
The greater sensitivity to moves in the UST curve than what we see in the GOVT ETF heightens the effects for a useful visual. TLT has been slaughtered looking back across the tightening cycle at -40% since March 1, 2022, the month ZIRP ended. TLT got a reprieve this week at +1.4% after the prior week’s -5.0%.
We also added a base metals ETF for a global cyclical indicator with a China twist…
We added a base metals ETF recently with Invesco DB Base Metals Fund ETF (Ticker DBB) for some additional flavor on how base metals have been trending. Base Metals (heavy in Copper, Aluminum, and Zinc) can be a useful indicator on any combination of sentiment in global manufacturing cycles or where China economic activity is headed. We thought that would add something to the portfolio color we lacked in the prior mix even though we had a range of industrials. DBB has been a poor performer YTD with China weakness and plenty of global cyclical question marks.
The Magnificent 7 heavy ETFs…
Some benchmarks have a few issuer concentration elements that leave them wagged by a few names. When looking across some of the bellwether industry/subsector ETFs, it is good to keep in mind which narrow ETFs (vs. broad market benchmarks) get wagged more by the “Magnificent 7,” including Consumer Discretionary (XLY) with Amazon and Tesla, Tech (XLK) with Microsoft, Apple, and NVIDIA, and Communications Services (XLC) with Alphabet and Meta.
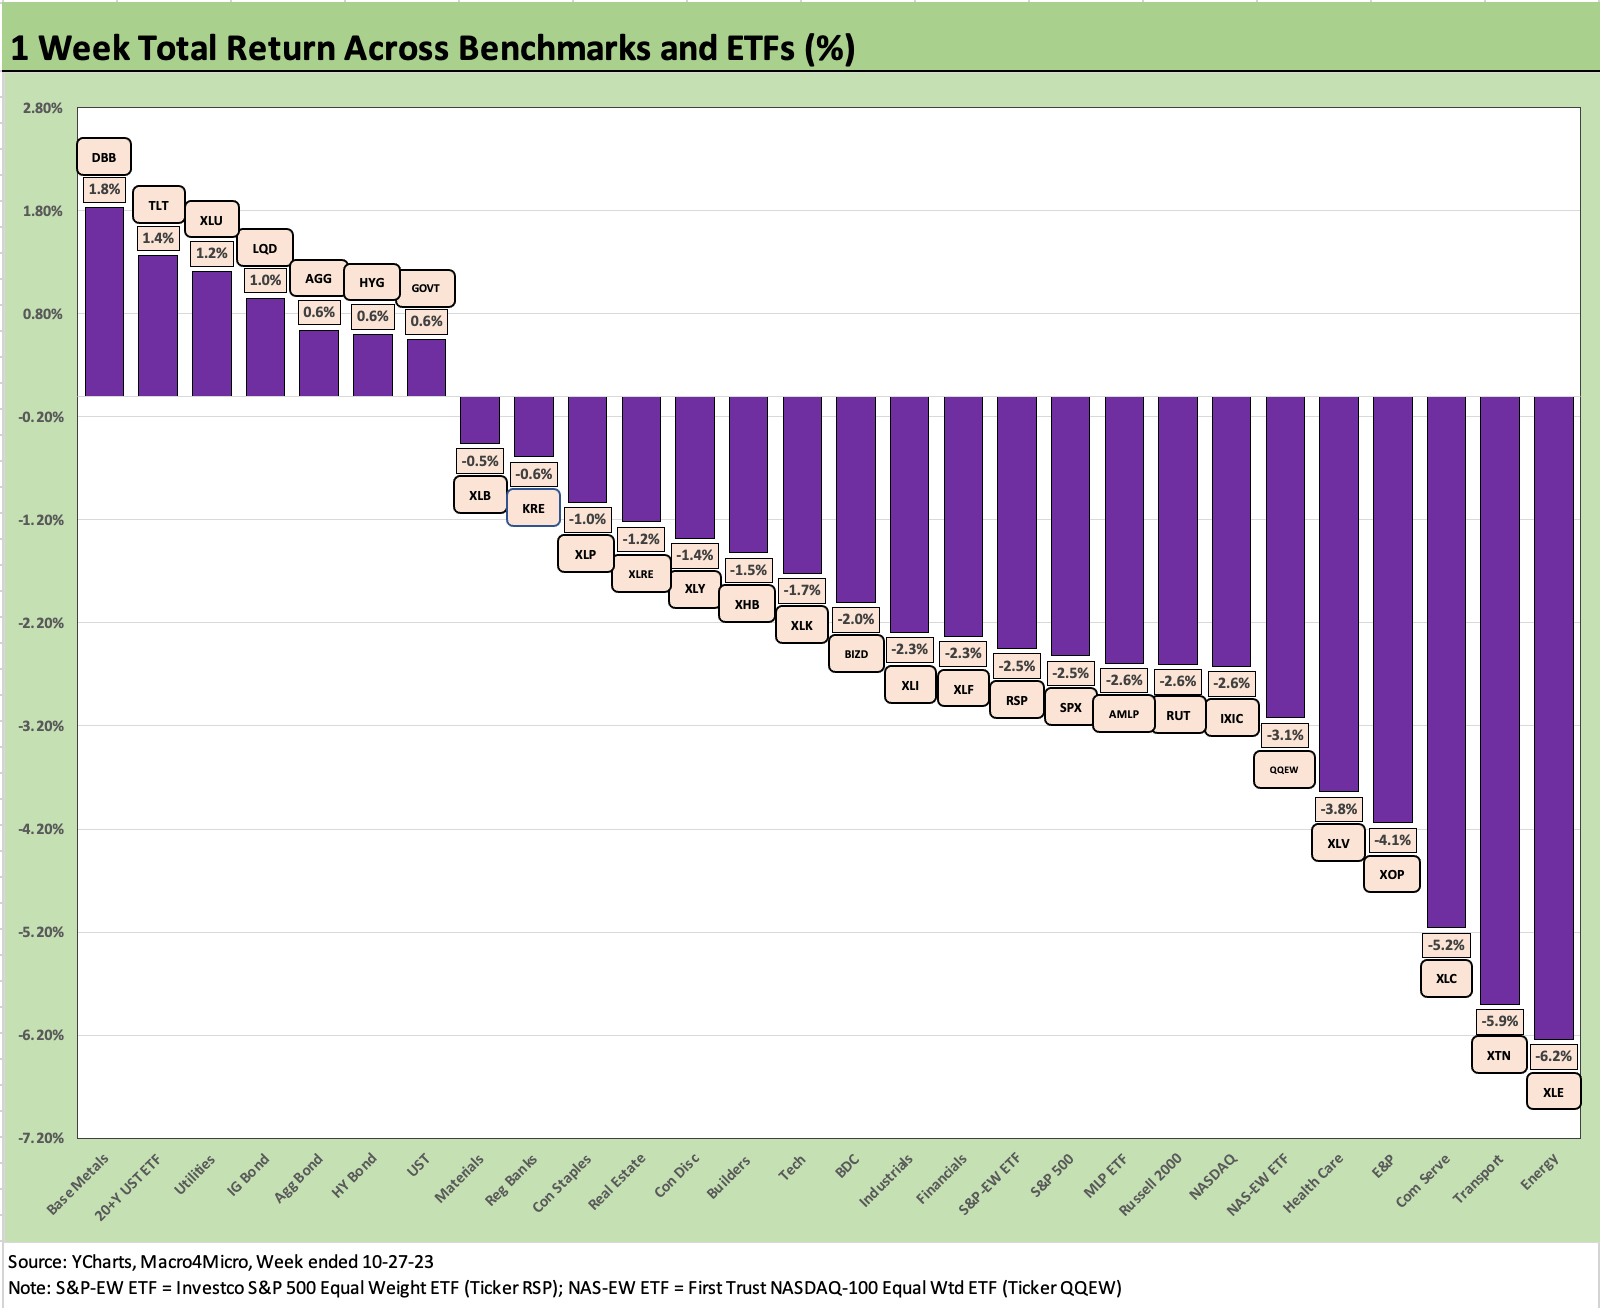
The above chart plots the 1-week returns with 7 in the positive and 21 in the negative range. It is a rare week when we see 5 fixed income ETFs in the black at 5 of the 7. The remaining two in the black sees the Base Metals ETF (DBB) at #1 and the interest rate sensitive Utilities (XLU) at #3.
The bottom tier sees Energy weaker after a soft week overall for oil markets and lack of enthusiasm around the mega-deals and earnings reports. Exxon and Chevron are playing the long game, but the stock market scored them low on their massive deal plans for Pioneer and Hess, respectively.
Drilling for oil on Wall Street has been a long-established tradition going back to the steady decline of the “Seven Sisters” and the rollup of the major integrated names.
Transports (XTN) continues to drag on cyclical expectations while Communication Services (XLC) was pounded in Alphabet’s selloff. We see benchmarks with a very rough week including the S&P 500 (SPX) moving into the correction zone.
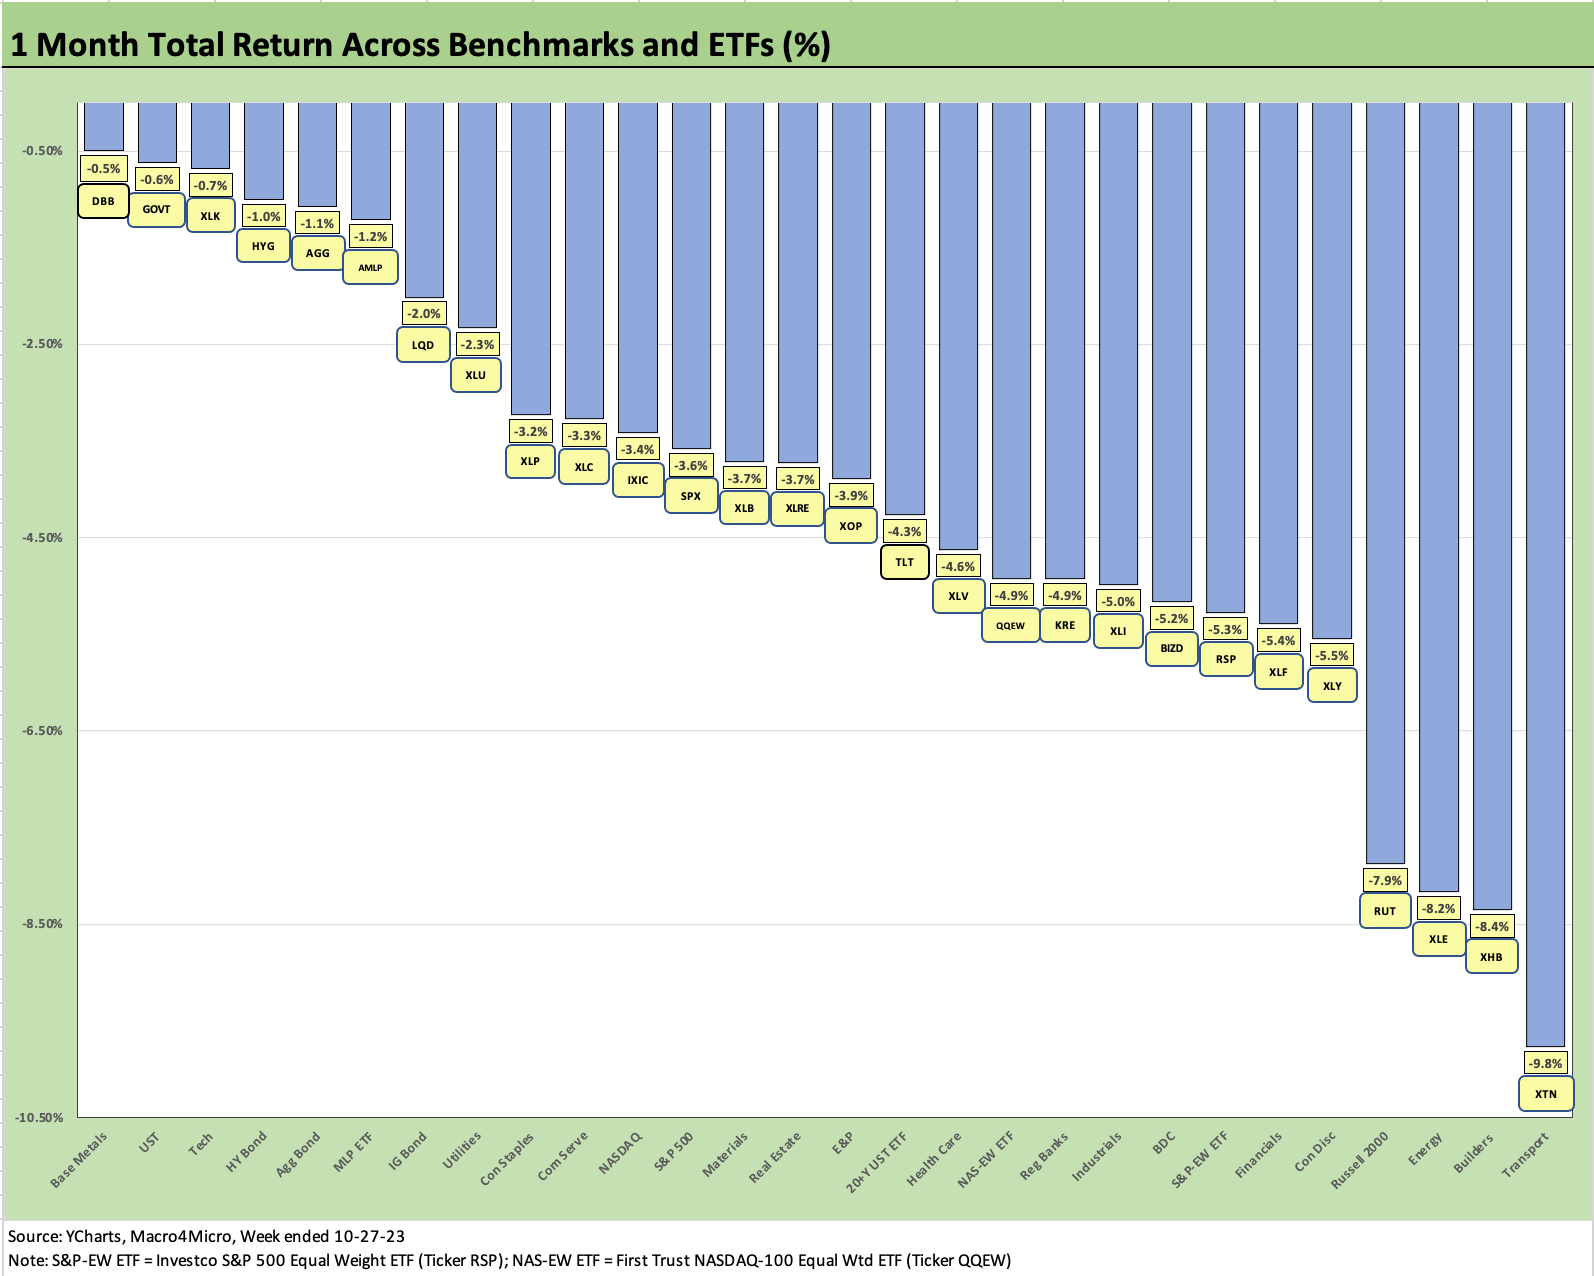
The 1-month time horizon shows a consistent theme with every one of the 28 bars in the red zone during the earnings season launch weeks. We see 4 of the 5 fixed income ETFs (GOVT, HYG, AGG, LQD) in the top quartile of “lower negatives” but the duration sensitive TLT down in the third quartile.
Transports (XTN), Builders (XHB), Energy (XLE), small caps (RUT) and the Consumer Discretionary ETF (XLY) are in the Bottom 5. For XLY, Tesla took a serious beating this month and more negative color on EVs has been coming out of the Detroit 3 while earnings reports are not helping. Some lurking supplier chain threats from China (graphite) is not helping the EV story much.
The Builders (XHB) are seeing pressure after such a strong YTD run still has them in the top quartile YTD at #6 and a +16.6% YTD total return. The mortgage trigger point of 8% has sent housing broadly into a case of nerves but not material financial worry. Builder cash flow fundamentals and financial resilience have been affirmed, and earnings reports so far from some major builders this past week has been favorable in context.
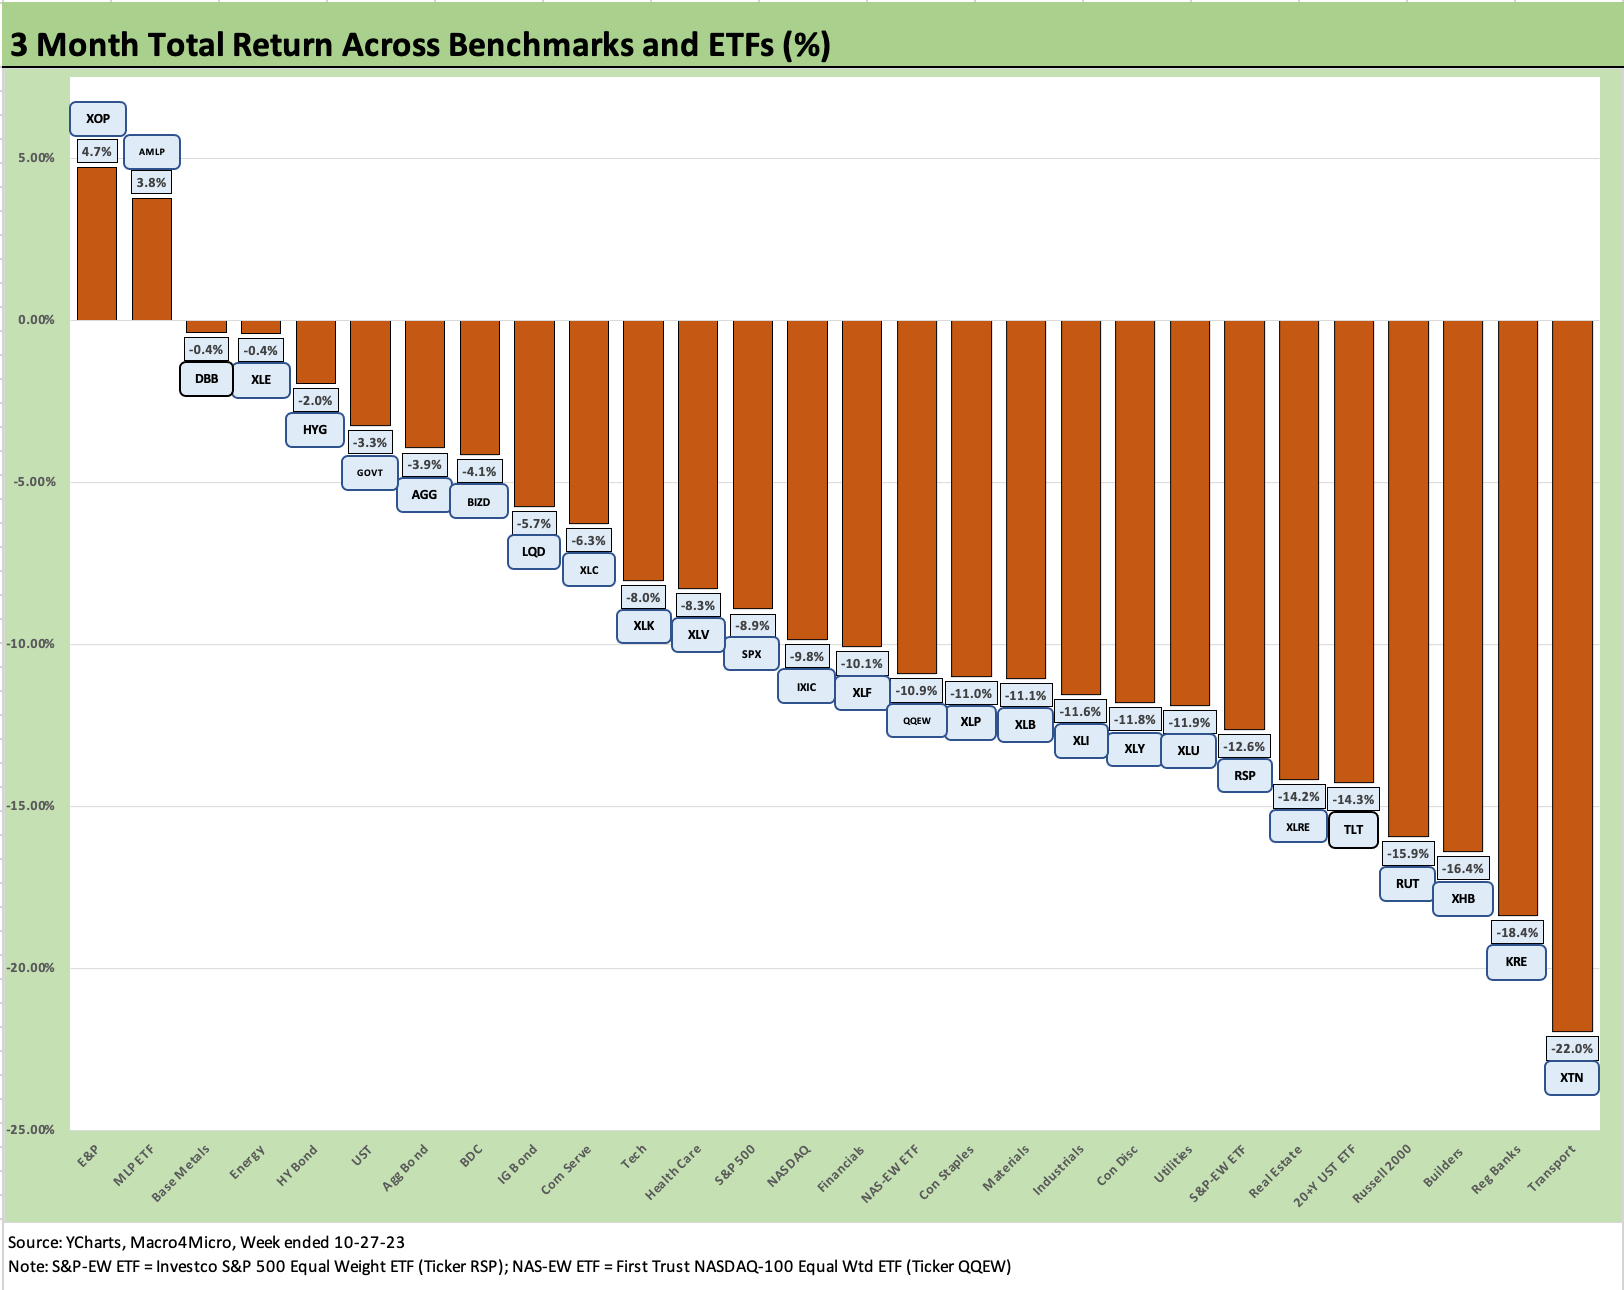
The trailing 3-month time horizon shows 2 in the black and 26 in the red for a bad rolling 3 months. The E&P ETF (XOP) at +4.7% and the income-heavy Midstream ETF (AMLP) at +3.8% landed in positive return range. We see 4 of the 5 fixed income ETFs in the Top 10 with the 20+ year US ETF (TLT) over in the bottom quartile.
Transport (XTN), Regional Banks (KRE), Builders (XHB), small caps (RUT), and TLT were in the Bottom 5. Of the low-end performers for the 3 months, only XHB was a “correction” after a strong YTD run. The rest were fairly regular performance problems. Real Estate (XLRE), and Equal Weighted S&P (RSP) rounded out the bottom quartile.

The YTD numbers offer some balance across positive and negative with a few more tilting into negative this week for a positive/negative score of 12 positive and 16 negatives. We see a Hi-Lo range in total return of 64.9 return points between Communications Services (XLC) and Regional Banks (KRE). If we drop out the highest and lowest names, the Hi-Lo range declines to 45.0 points. These gaps are why active managers and day traders will always stay busy. There were a lot of analysts and PMs bullish on both Tech and Financial along the path. There were also plenty bashing Builders and BDCs, and those performed quite well YTD.
The Magnificent 7 heavy ETFs and Tech benchmarks win the day in the top quartile with Communication Services (XLC with Alphabet and META) at #1, the Tech ETF (XLK, with MSFT, NVDA, AAPL) at #2, the NASDAQ benchmark (IXIC) at #3, Consumer Discretionary (XLC, with AMZN and TSLA) at #5. The non-tech outperformers in the top quartile include Midstream ETF (AMLP) at #4, Builders (XHB) at #6, and the BDC ETF (BIZD) at #7.
We still see the Regional Banks ETF (KRE) in their own box in total return purgatory at -32.5% while the bottom quartile is rounded out by interest sensitive names and defensive ETFs. We see Utilities (XLU) at next-to-last but with a less brutal -14.7%. or less than half the KRE loss. The rest of the low quartile includes the 20+ year UST ETF (TLT), Real Estate ETF (XLRE), Staples (XLP), Health Care (XLV), and the Financials ETF (XLF).
This coming week features a slew of earnings reports, a new Speaker of the House with a budget deadline closing fast, an escalating ground war in Gaza, and, of course, Halloween with The Great Pumpkin on trial.