
Footnotes & Flashbacks: Asset Returns 12-10-23
We look at our broad range of benchmarks and ETFs in another winning week for equities as the rolling 3-month return story makes a statement.


Another positive week for the major stock benchmarks sees the highs of 2023 with a silver lining to be found in energy equity weakness and favorable adjustments in consumer inflation expectations.
The UST curve was steady for fixed income returns until jobs delivered a mild increase across most of the curve on Friday.
Flows and yield chasing are still the main themes on the interplay of the yield curve and credit asset returns with US HY seeing another week of spread compression with market signals remaining bullish on what investors see for UST curve action in the next year.
The ETF returns were decidedly more mixed on the week vs. the prior week as Energy has had its share of setbacks with some bellwether commodities benchmarks and EM posting negative weeks on signals from China.
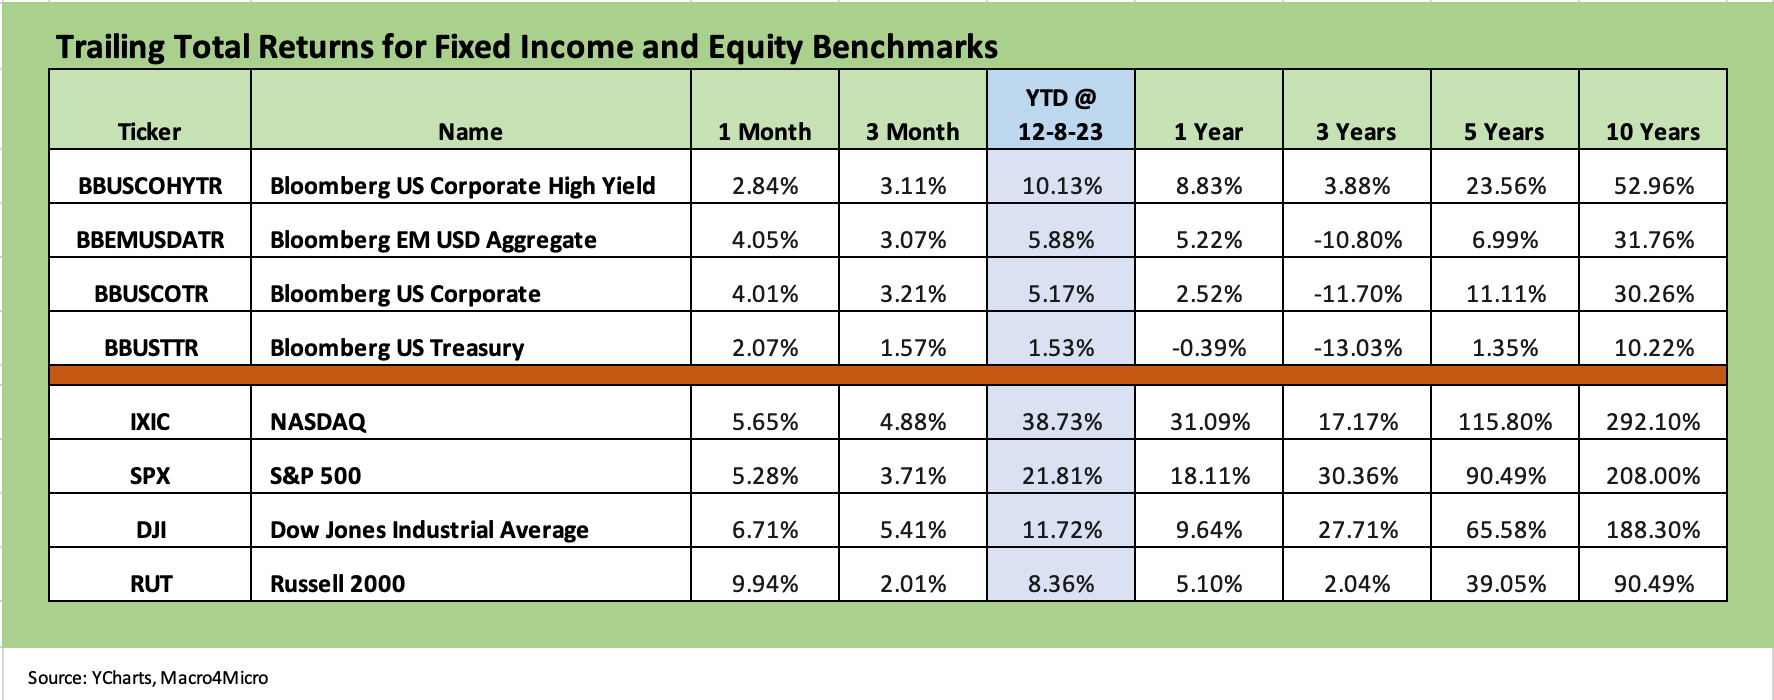
As the year and 4Q23 winds down, the asset return story has mounted a very favorable comeback, and we see the debt and equity benchmarks we regularly track posting up strong trailing 1-month and 3-months numbers. Most line items are climbing out of the doldrums seen through much of October including YTD numbers.
We see HY debt posting numbers in line with nominal long-term returns in equities, and the IG Corporate Index is now running ahead of a coupon year at +5.2% (5.4% for ICE) vs. a par weighted index coupon close to 4%. Bond returns have come a long way in a hurry. As recently as the week ended Oct 27, the IG index was negative and so was the UST index.
As we cover in the commentary further below, our peer group of 31 benchmarks and ETFs saw only 3 in the negative return zone for the rolling 3-month period (2 of the 3 in energy), 8 of 31 negative YTD, and with only 1 ETF (Regional Banks KRE at -14.4%) in double digit negative range vs. 11 in positive double digits (9 of those north of 20%).

The above chart updates the 1500 and 3000 series, and the only index in the negative range in 1 month and 3 months is Energy, which had been the main positive line along with Growth back in October. The comeback in interest rate sensitive sectors has been the main story across November and into December with Real Estate the one with the most bounce YTD after being at -10.8% YTD as recently as 10-27-23.
The volatility of the Energy swings is not a new experience across the cycles with near zero returns over 1 year and +135% trailing 3 years with all the action from the Russia-Ukraine War. Oil will remain a key driver of headline inflation and consumer sentiment as politicians continue to portray themselves as able to control global commodity prices. Lower oil is a consumer tax cut. Higher oil is a tax increase that cuts across many aspects of economic life. That is not a new concept.
The return snapshot with a quick visual…
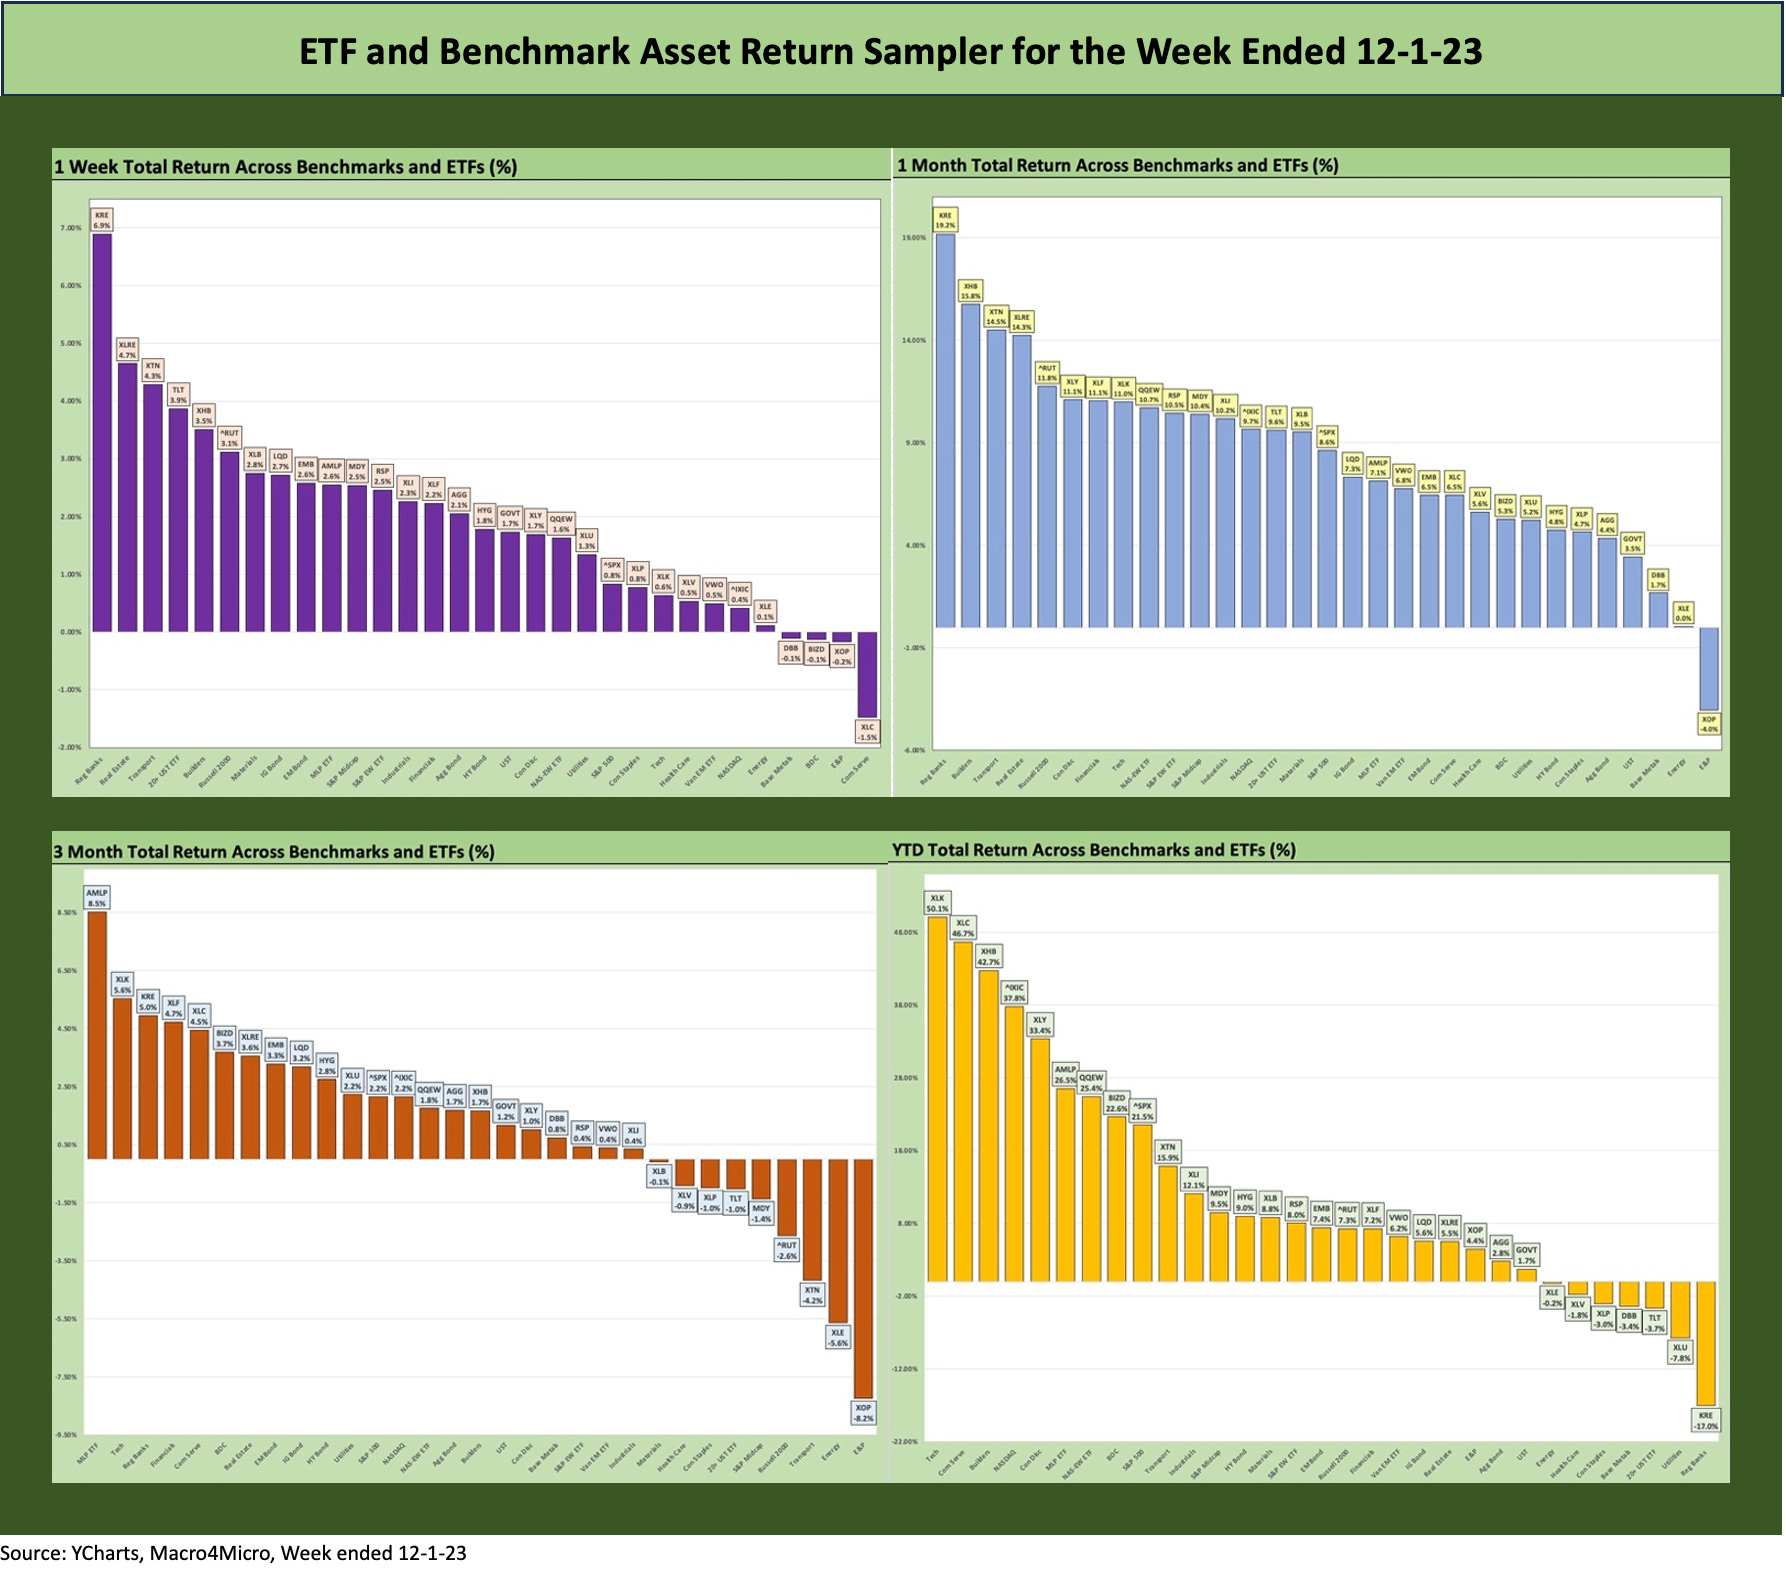
We started dropping in the following box of four different time horizons in the weekly. The chart grouping allows for an easy view of the shape of returns for each period (1-week, 1-month, 3-months, and YTD). We occasionally see all negative or all positive, but we found it to be an easy way to look at the current configuration and how it may have reshaped in just a week. First, we show the box of 4 for this week and then we show one for last week.
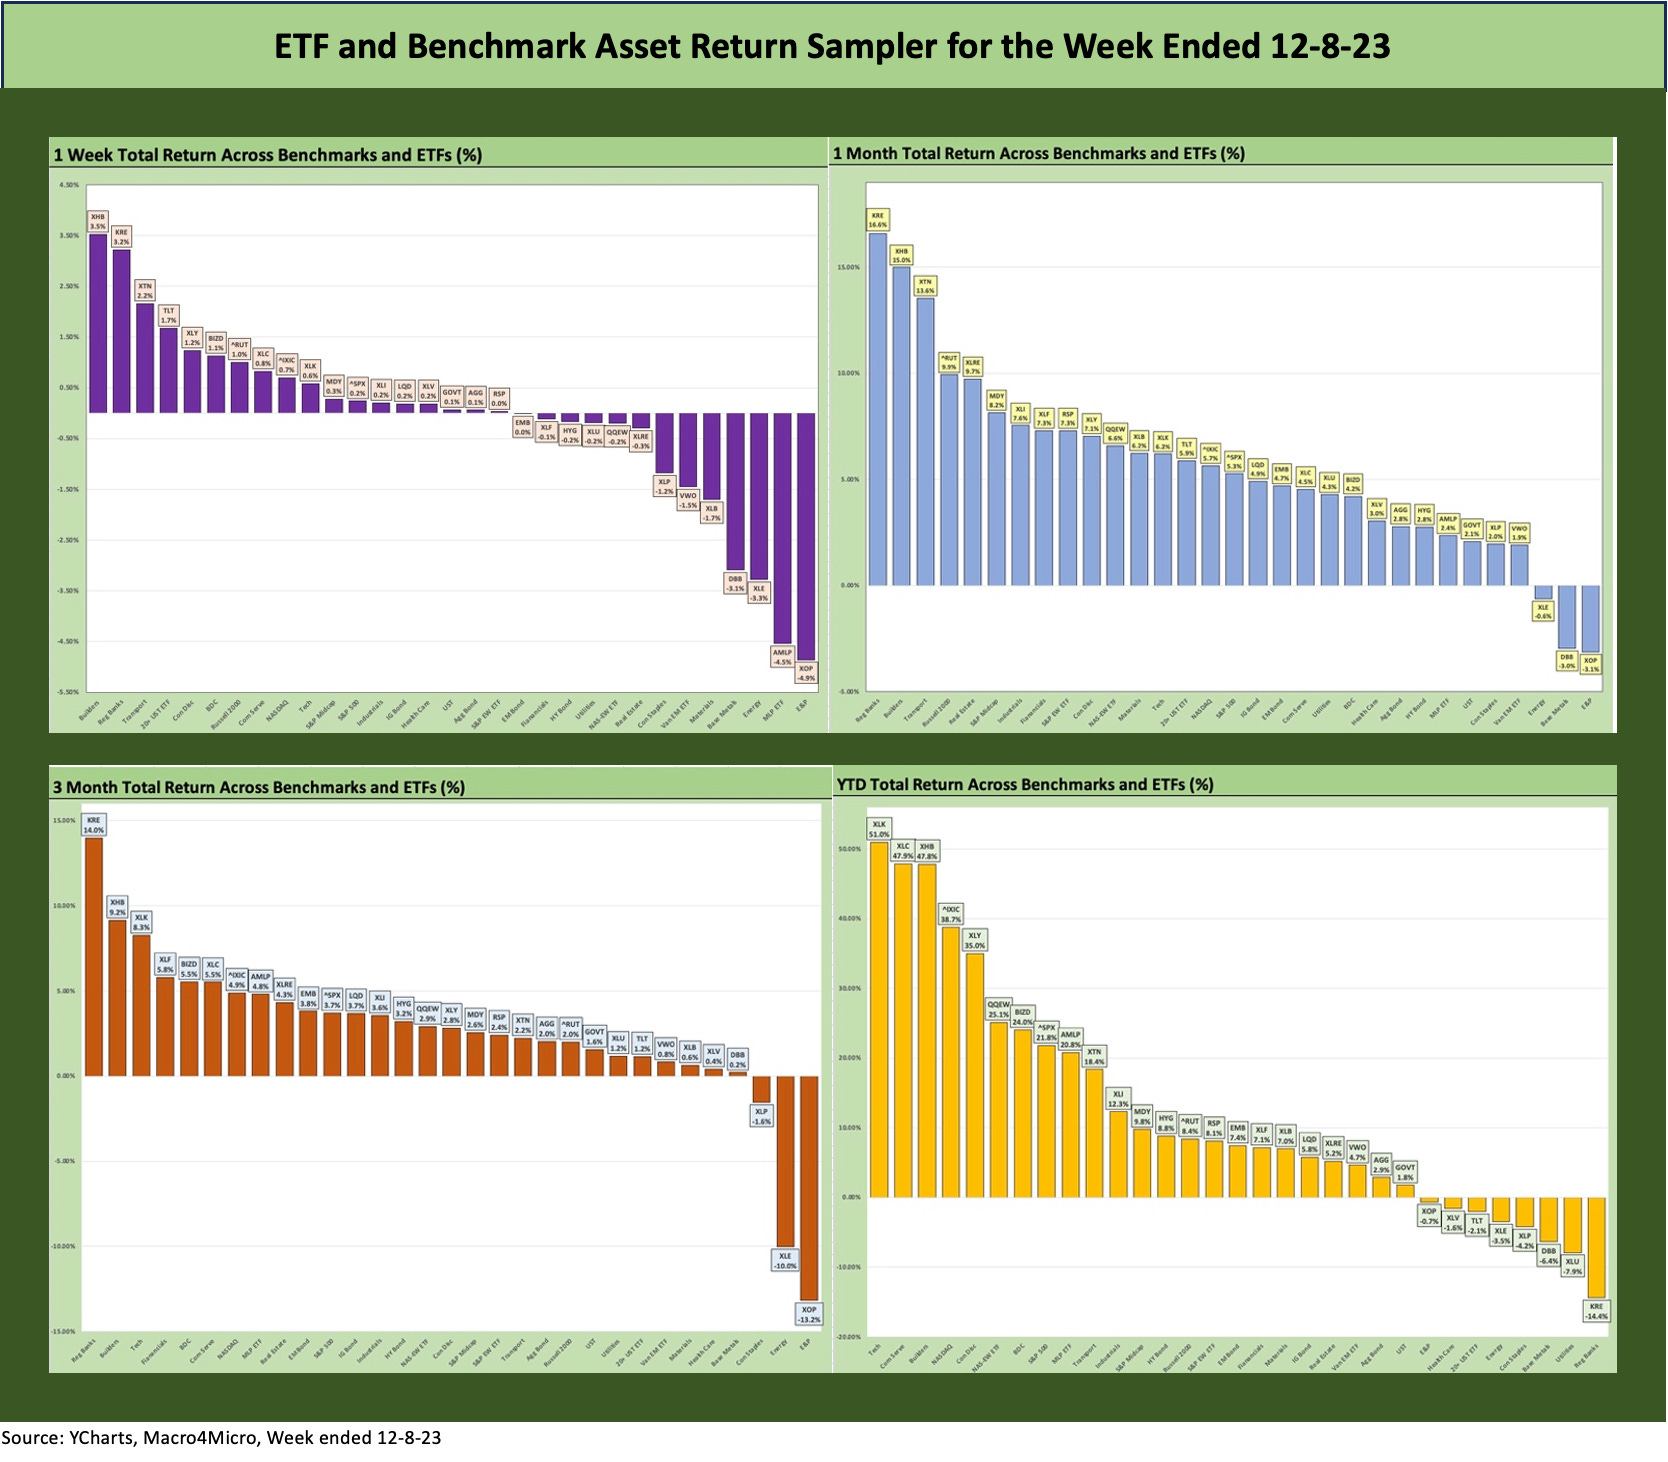
The above chart frames the pattern of returns through this week to 12-8-23. The chart below frames the results through last week to 12-1-23. We still see a handful of the 31 ETFs hovering close to the zero line over 3 months and in the +2% to -2% zone YTD.
The main visual highlight is for the rolling 3-months, where we see a continuation of the shift left with only 3 negatives this week vs. 9 negatives in last week’s rolling 3 months. The 3-month rankings now just show Staples (XLP), Energy (XLE), and E&P (XOP) in the red zone.
The good news for diversified portfolios of stocks and bonds is that the YTD period shows 23 positive and 8 negative. The heavy shift to the left (more positive) and higher (more sectors driving strong finishes to year end 2023) stand out in terms of the shape and symmetry of the returns.
Time horizon asset returns…
In our next four asset return charts, we cover 1-week, 1-month, 3-months, and YTD time horizons for a range of ETF and benchmark returns. We look at 31 different benchmarks and ETFs that cut across a wide expanse of the economy.
We recently added 3 more ETFs to the mix, including one for the SPDR S&P Midcap 400 (MDY), one for Emerging Markets Equities (Vanguard FTSE Emerging Markets ETF), and one for the iShares JPM Emerging Market USD Bonds (EMB). We needed some EM representation in EM equities and bonds as well as a benchmark to connect the large caps and small caps.
Midcaps have a wide variety of valuations with both growth companies and old school value plays across the diverse mix of industry groups. Midcaps also have a fair amount of overlap with the HY issuer base and credit-intensive sectors generally with less of the narrow issuer distortions that we see in the broad market large caps.
The Magnificent 7 heavy ETFs…
Some benchmarks have a few issuer concentration elements that leave them wagged by a few names. When looking across some of the bellwether industry/subsector ETFs, it is good to keep in mind which narrow ETFs (vs. broad market benchmarks) get wagged more by the “Magnificent 7” including Consumer Discretionary (XLY) with Amazon and Tesla, Tech (XLK) with Microsoft, Apple, and NVIDIA, and Communications Services (XLC) with Alphabet and Meta.
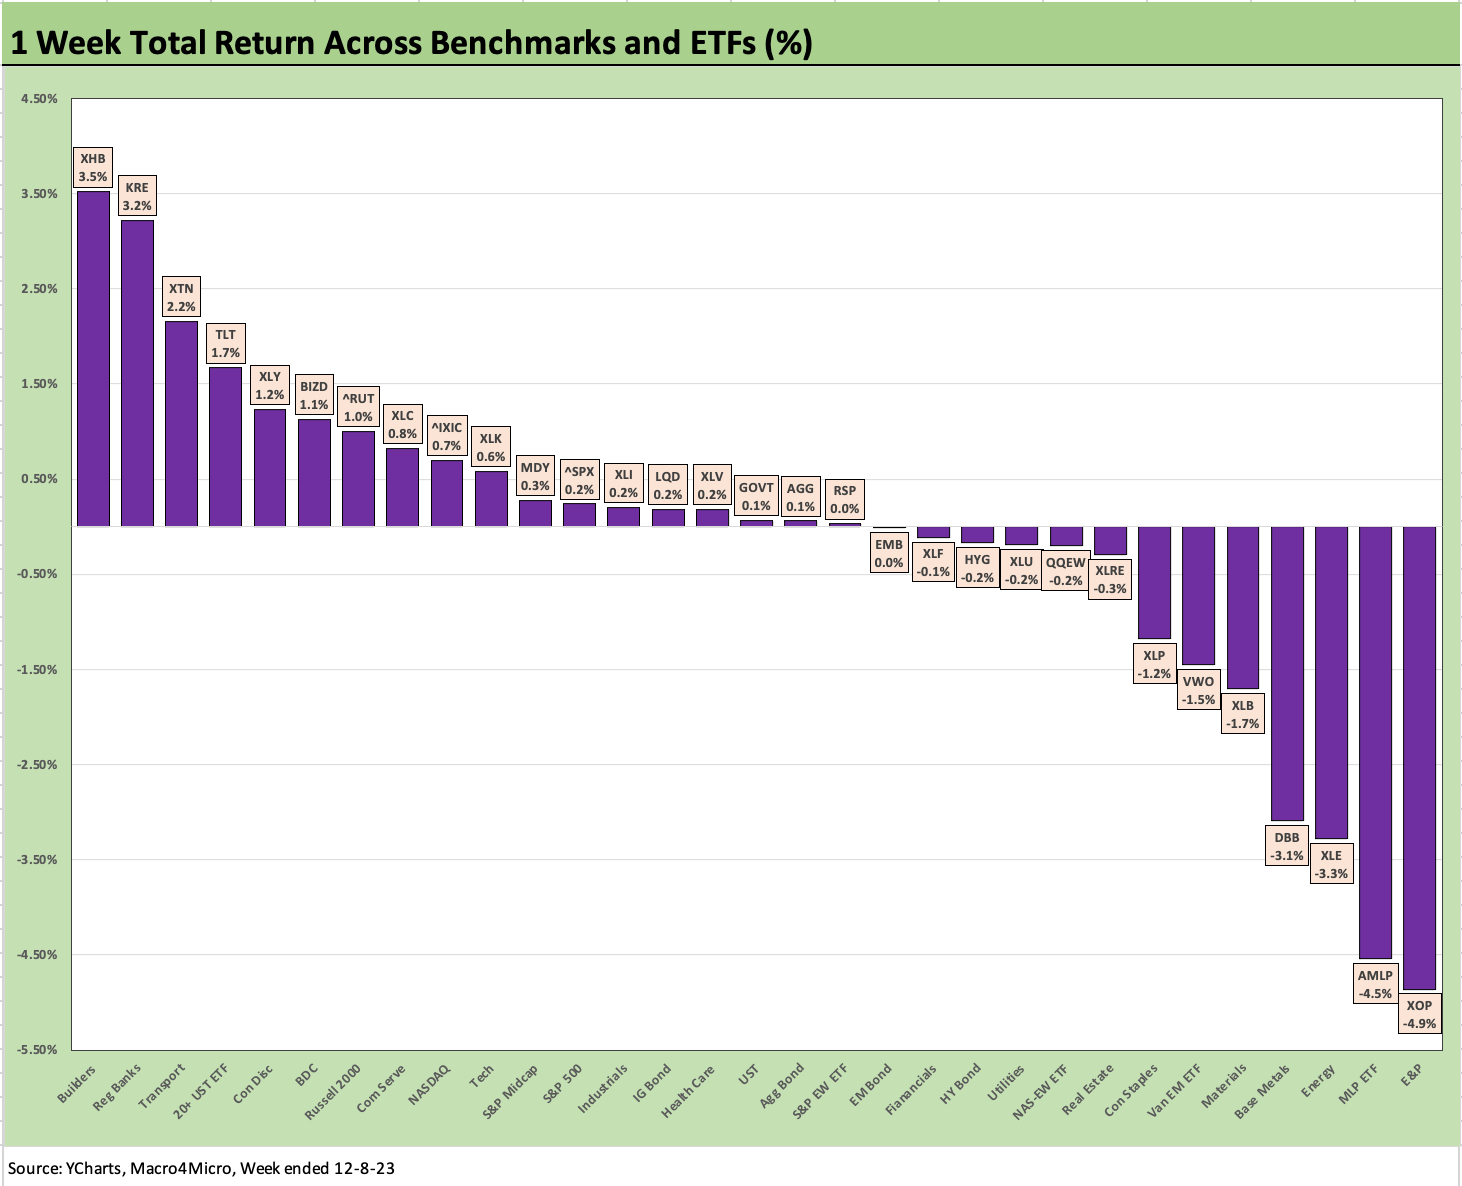
The above chart frames 1-week returns with Energy taking a fresh beating as oil briefly dipped below the $70 line and China generated some weak macro headlines that flowed into Base Metals (DBB), Materials (XLB), and EM Equities (VWO). We see the “zero line” bracketed by fixed income and interest sensitive sectors with the UST curve delta biased to the upside on the week (ex-30Y)after the Friday curve moves on the heels of decent jobs numbers (see Nov 2023 Jobs Numbers: A Sad Story of More People Working 12-8-23). See our separate Footnotes publication on “State of Yields” for more color.
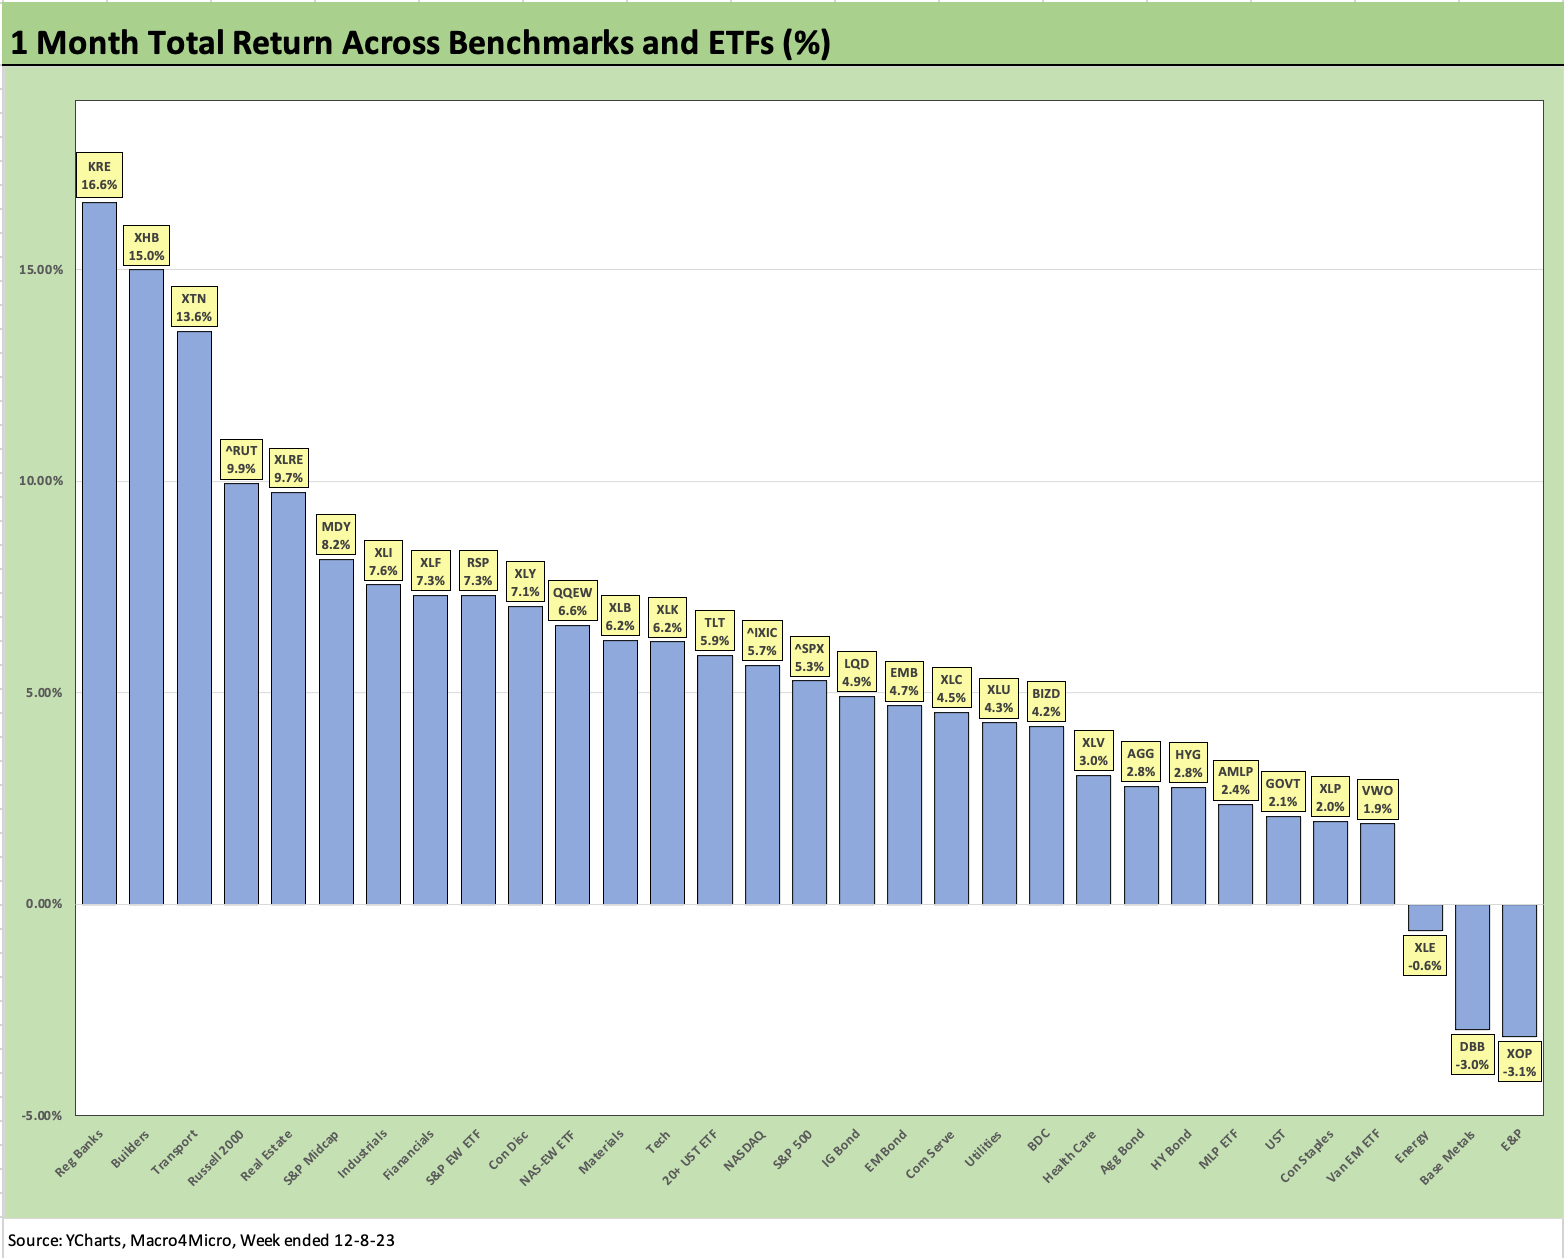
The 1-month numbers remain very favorable as covered in prior weeklies after some dramatic yield curve moves and spread compression (see Footnotes & Flashbacks: Asset Returns 12-3-23, Footnotes & Flashbacks: State of Yields 12-3-23). Only E&P (XOP), Energy (XLE), and Base Metals (DBB) are in the red for the 1-month period. WTI hit a $69 handle on Thursday before ticking back up to a $71 range on Friday.
Over on the left, we see the bullish response to the yield curve action. We see Regional Banks (KRE) on top as the market tries to handicap Fed policy actions in addition to the “soft landing or no landing” side effects on downside risk in asset quality. Some relief on deposit costs and interest margins would be welcome, but there is still a cloud over KRE from the March crisis with KRE the last place performer YTD at -14.4% with Utilities second to last at -7.9%.
Homebuilders also seem to remain unflappable despite a 7% handle on mortgage rates with Toll Brothers reporting a strong quarter this past week along with record fiscal year revenue and earnings along with solid guidance into 2024. Toll is a luxury player ranked at #4 among builders based on revenues (see Credit Crib Notes: Toll Brothers (TOL) 9-11-23), so that is a narrower customer base.
We have #2 Lennar reporting this coming week (Friday Dec 15), and their footprint and product range will give a much broader look at the national state of affairs in residential markets (see Credit Crib Note: Lennar (LEN) 11-22-23). As evident in the performance of the Homebuilder ETF in 2023, the rates have not rattled the ability of the builders to pick up market share in the overall housing sales totals with existing home sales under so much pressure (see October New Home Sales: Low Bar to Clear 11-28-23, October Existing Home Sales: Searching for Lows 11-21-23).
The performance of Transport (XTN) and small caps (RUT) offer other signals around the expanding breadth of the stock market recovery but also some flavor on how the market is feeling about cyclical prospects in the US. The same could be said of the Industrial ETF as Industrials are looking past consistently shaky ISM numbers.
We also see Midcaps in the top quartile for the month. Interest rate sensitivity and Fed handicapping is also helping asset quality sentiment feel a bit better this month as evident in Real Estate (XLE) and Financials (XLF). We should highlight that the equal-weighted S&P 500 ETF (RSP) in the upper end of the second quartile beat the market weighted benchmark over the trailing 1-month period.
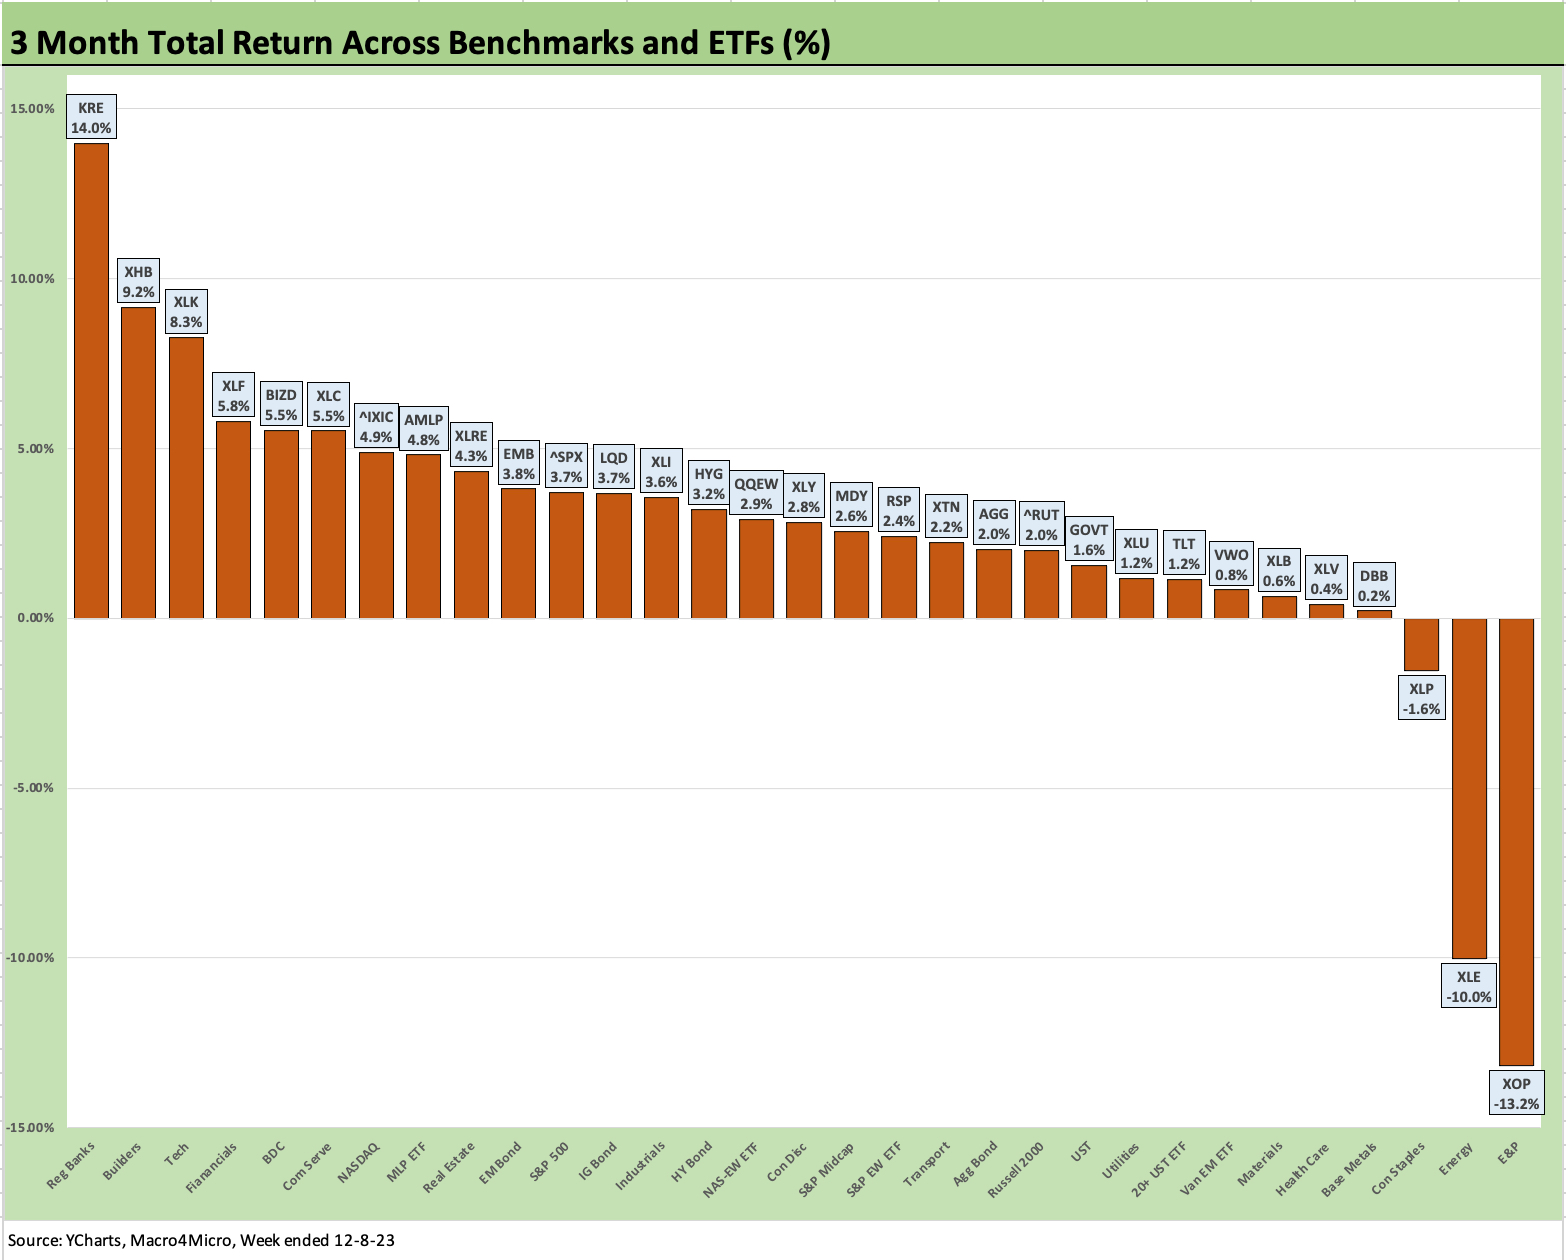
As highlighted earlier, the 3-month rankings and numbers highlight the strong finish with only 3 negative and 2 of those (XLE, XOP) keying off oil price weakness. The flip side of energy weakness is an economic “household tax cut” for the consumer on the way into peak heating season and at the gas station.
Among notable top quartile performers beyond the Regional Banks (KRE), Builders (XHB), Transports (XTN), and Financials (XLF) that we already discussed, we see the BDC ETF at #5 just edging out Communications Services (XLC) and ahead of the NASDAQ (IXIC).
The BDCs (BIZD) have held in well on cash income returns on dividend payouts and an apparently sustained confidence in the small cap borrower base and floating rate secured asset mix. That is another positive vote in the risky asset credit column. Despite the HY OAS compression, BIZD was well ahead of the HY ETF (HYG) on the BDC’s dividend yields and floating rate profile and structurally senior asset mix.
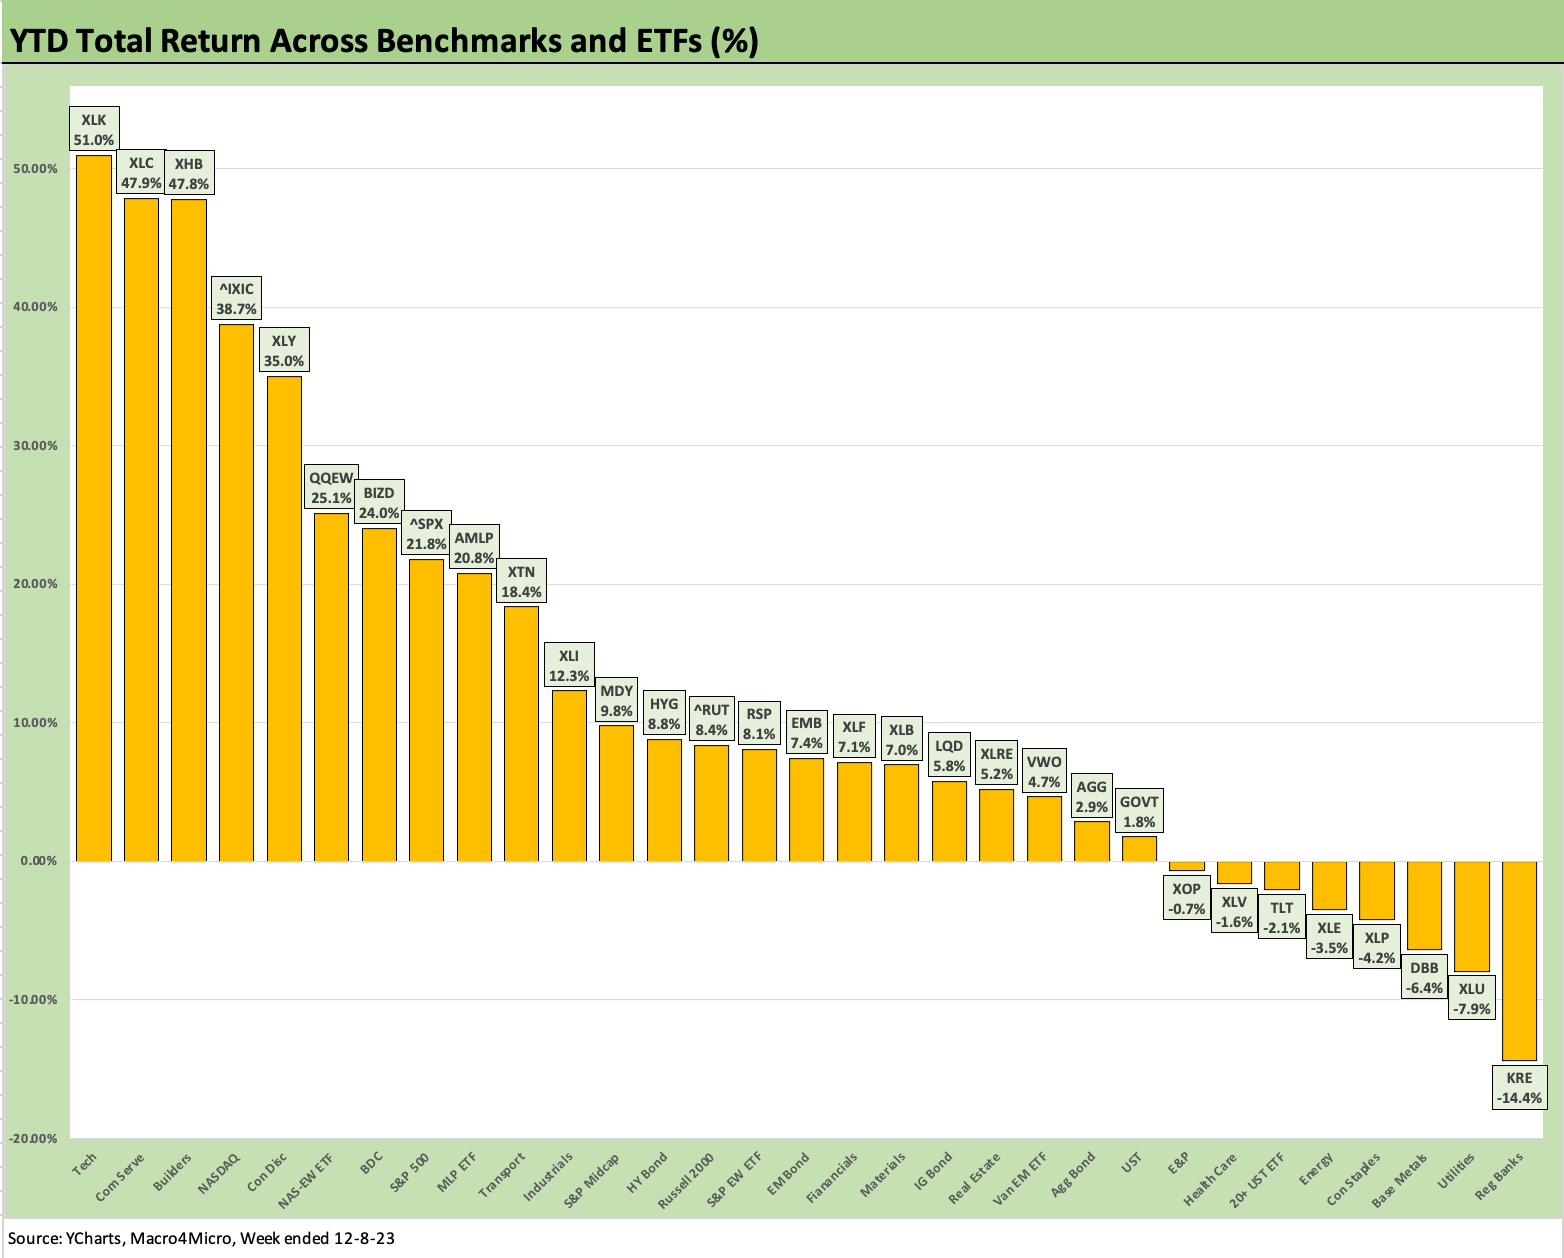
We wrap with the YTD numbers and a score of 23 positive and 8 negative. We see a Hi-Lo range over 65 total return points when framing the Tech ETF (XLK) vs. Regional Banks (KRE). If we toss out the Hi and Lo, we still see a return range of just under 56 points. Using the top non-tech, non-Magnificent 7 ETF, we see Builders (XHB) at +47.8% YTD vs. Regional Banks (-14.4% YTD) at a range of over 62 total return points. Those ranges offer a reminder of why there will always be active management and active wealth managers.
Contributors
Glenn Reynolds, CFA glenn@macro4micro.com
Kevin Chun, CFA kevin@macro4micro.com