Footnotes & Flashbacks: State of Yields 7-9-23
We update UST curve moves after a mini bull steepening nicked duration and moved past most March levels.
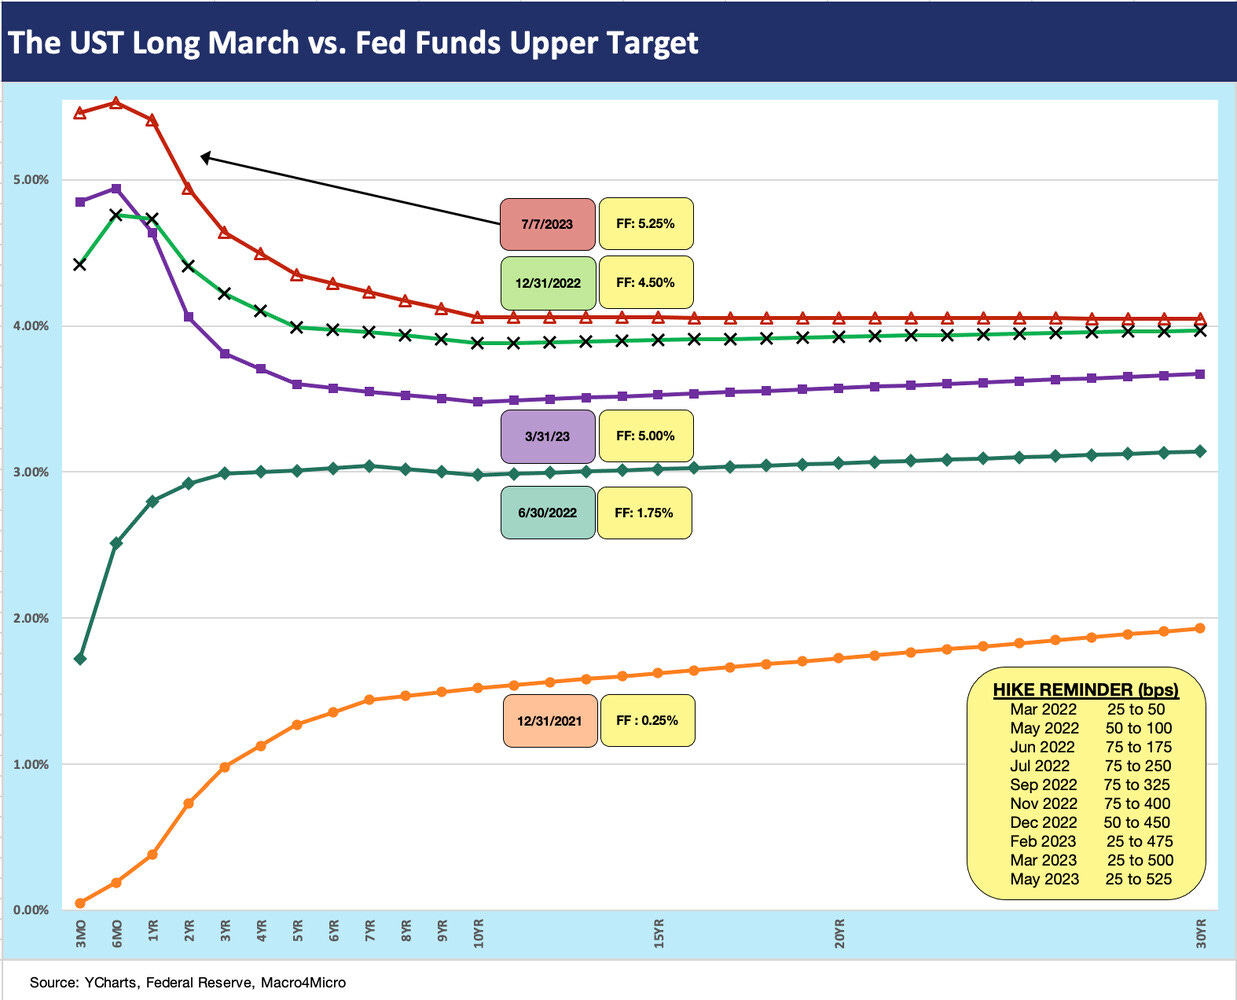
The UST curve shift crossed back to levels above the pre-SVB yields this past week as the bear steepening fears get a market test with many forecasts still trying to warm up to duration looking ahead.
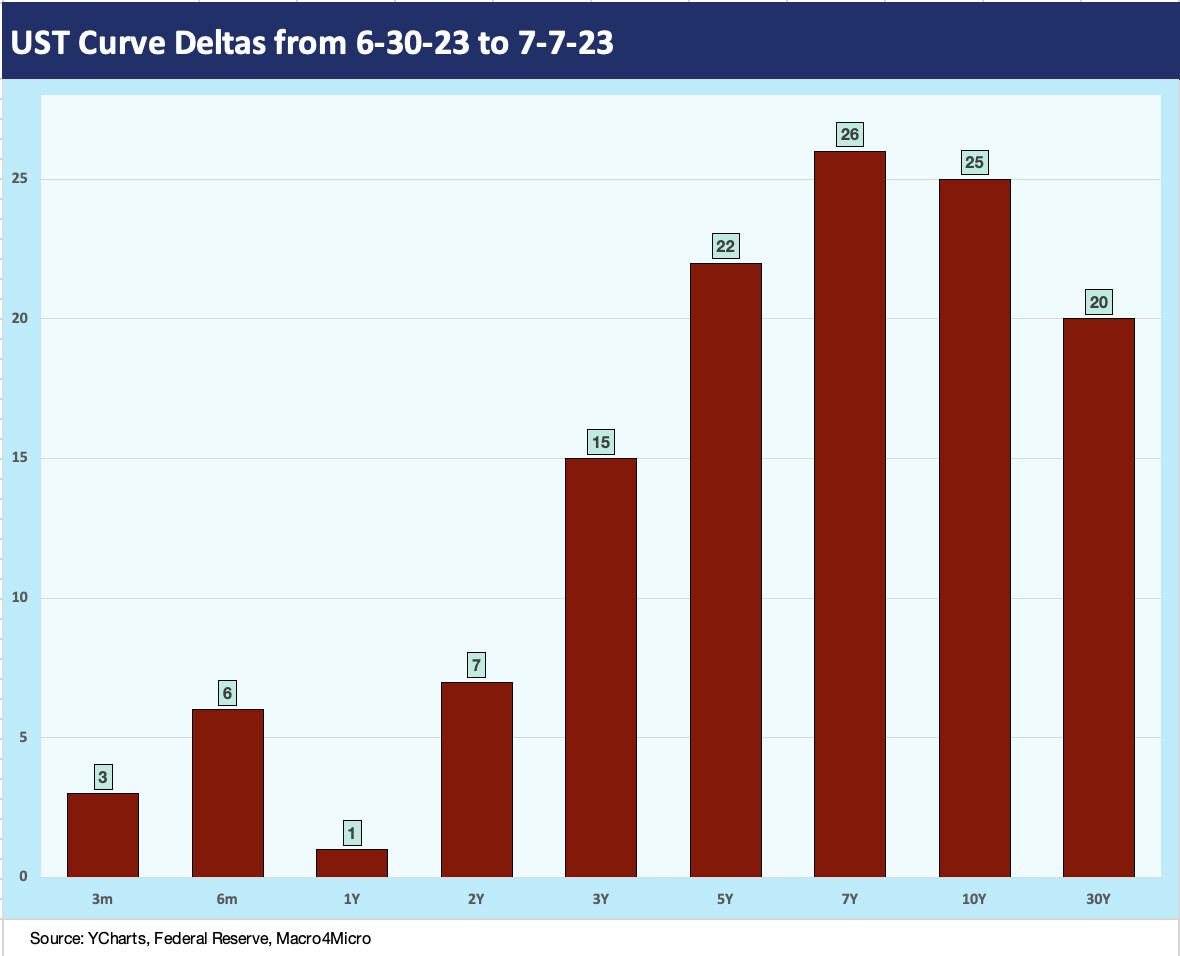
We update the UST curve deltas for this week and since the early March (3-8-23) onset of the regional bank mini-crisis as UST market starts a migration to lower inversions from what was generally a multicycle peak inversion for most segments of the yield curve.
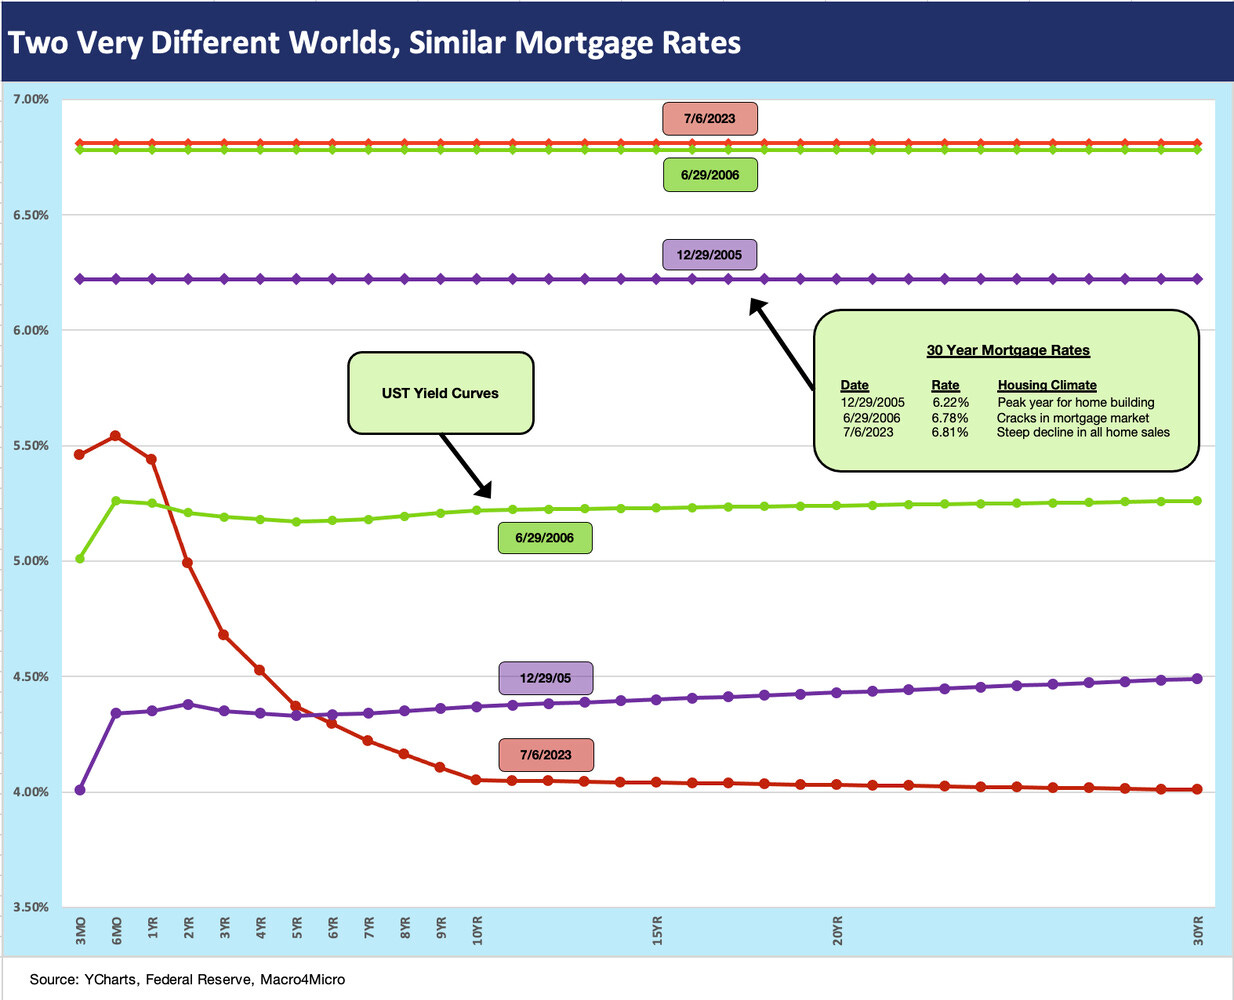
We look back at UST curve and 30Y mortgage levels in the 2005-2006 housing bubble and the very strange pattern vs. today’s rates as mortgage spreads punish current all-in levels.
We did a more-in-depth look at histories in last week’s midyear edition (see Footnotes & Flashbacks: State of Yields 7-2-23 7-2-23), but the past week broke through some milestones after the FOMC minutes cast doubts on FOMC consensus. We then saw heightened anxiety around jobs numbers after ADP rattled the markets (see Employment: BLS Gongs ADP 7-7-23, Jobs: Mild JOLT for May Trumped by June ADP Shock 7-6-23).
We are now back to cyclical highs on the front end with 5% handle yields from 1M UST to 1Y UST. We also now have a full UST curve above 4%. We had some across-the-board 4% handles back in November 2022 (see High-Speed Inversion Gains Altitude 11-6-22), but the steady tightening and cyclical second guessing since then has left peak inversions and more 3% handles in the mix in recent months, especially after the March 2023 regional bank drove a partial UST shift with the Fed still tightening.
The above chart frames the material move over the past week. One week does not a trend make, but the theory that a protracted inversion is not sustainable is catching on. The debate is whether the market has to see a contraction and recession that leads to easing or that steady economic fundamentals and high services inflation will cause the UST curve to head back towards a less inverted profile in a negative shift for duration risk. The market got a taste of the latter trend this past week. That would mean in substance a bear steepening pattern.
The 2Y UST maturity has been “casino night” for investors and especially since the March regional bank turmoil. The 2Y-3Y UST area influences a lot of consumer durables rates (auto finance, etc.). Further out the UST curve, we saw the 10Y UST move higher on the week, and that is a big driver of 30Y mortgage rates.
The UST curve shift this week delivered a duration hit to high grade bonds and UST and negative total return for the week. The curve move peaked after the ADP data and then eased slightly on Friday with more muted jobs numbers from the BLS. We get CPI and PPI numbers this coming week, and the market will be focusing on any sign of easing in Services inflation and whether Core CPI finally shifts to levels below the upper target range for fed funds.
The above chart updates the post-SVB move of the UST curve using 3-8-23 as the last “clean day” for regional banks before all the ensuing turmoil. The steepening from 5Y to 30Y marks a reversal from where we were in prior weeks. Last week, the post-SVB yield changes showed 5Y to 30Y lower and this week’s changes now leave the 5Y to 30Y changes all positive. That’s a big move higher in the context of 2023 as was the UST rally as regional banks flared up.
The above chart just gives a yield curve shift visual on what we captured in the bar chart. The pressure on funding costs and deposit stability for banks is not getting any easier, and the inversions (we revisit some below) are still very much in place but at higher absolute rate levels.
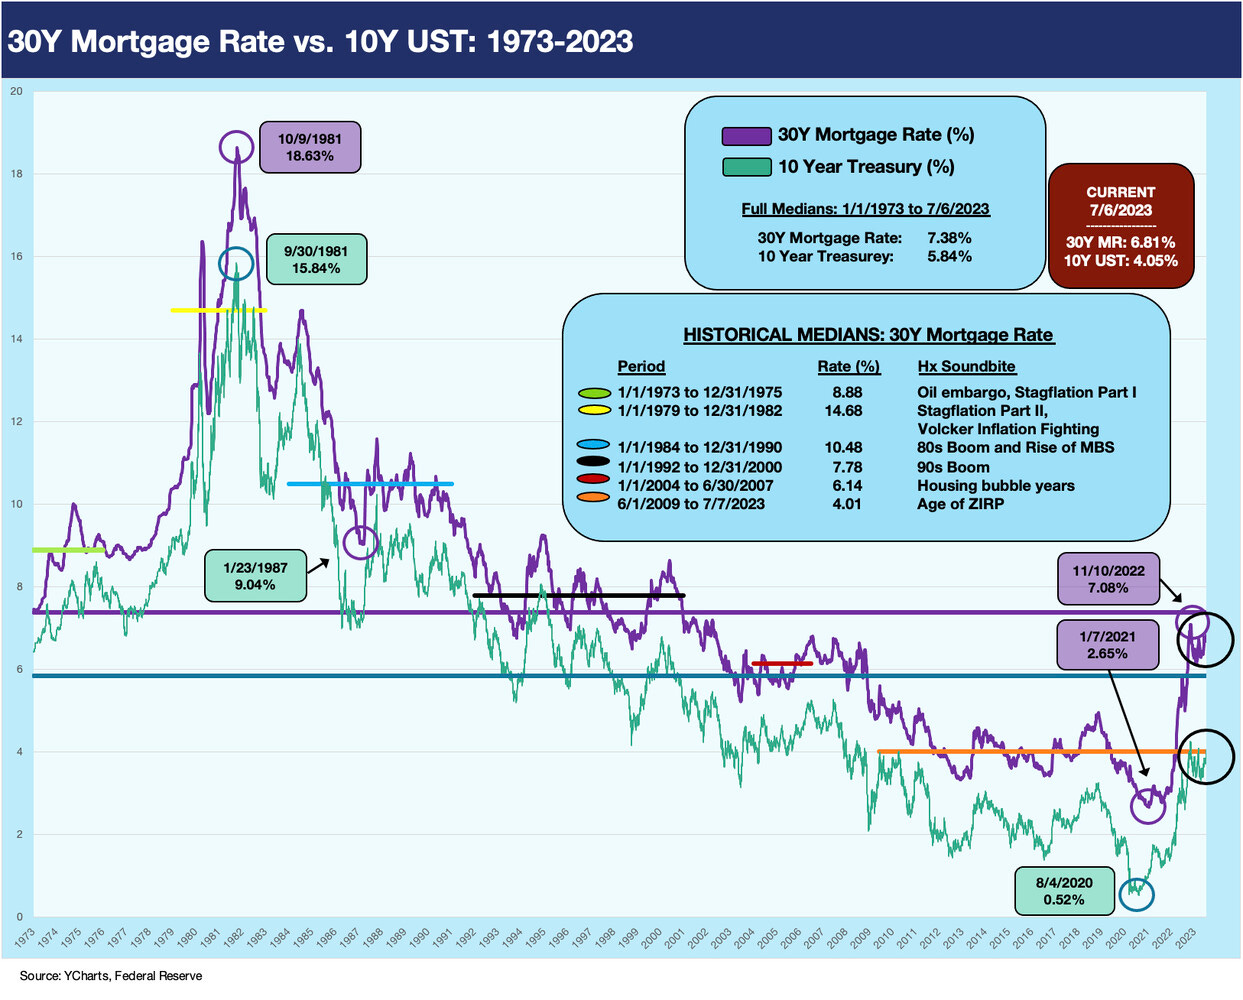
One of the issues to watch closely in the event of any sustained bear steepening is fallout in mortgages. The above chart revisits one of the anomalies we had looked at in an earlier commentary where we detailed 30Y mortgage rate histories vs. the 10Y UST back to 1973 (see Footnotes and Flashbacks: Week Ending April 2, 2023).
The takeaway was that wider mortgage spreads today result in materially higher mortgage rates than what we saw at the end of 2005, when the UST curve was higher from 10Y to 30Y than in 2023. The year 2005 was the peak year for homebuilding in the housing bubble. The peak month for new home sales posted around 1.4 million single family home SAAR rates in July 2005.
The differential captured above frames the UST curve against the prevailing 30Y Freddie Mac mortgage rate on the same date. The 2005 housing boom saw low 6% handle mortgage rates at year end with a higher UST curve. The 2023 market was in the low 6% area earlier this year as the 30Y mortgage rates swung around.
The Fed was in tightening mode in 2005-2006 just as the FOMC is today. If we move the calendar year a bit ahead to mid-2006, we see similar 30Y mortgage rates today near 6.8% but with a materially higher UST curve in June 2006 when the tightening cycle had been continuing (noted in the chart with the move in 3M UST from year end 2005 to mid-2006).
This history is the good news/bad news angle with 30Y mortgages swinging around in a 100 bps range in 2023 and trying to find a narrower zone. The chart uses the Freddie 30Y benchmarks, but we see 7% handles cited in some mortgage trade rags.
The hope for normalized mortgage spreads that would allow for lower all-in mortgage rates is the bull case for 2023. The sustained dislocations in mortgage rates on yield curve fears, potential volatility, and tighter credit is carrying the day for now.
Mortgage market dynamics are outside of my lane (on the other side of the freeway after meeting so many mortgage analysts in my travels), so we are not making a call on the structural risks on that front. The differentials detailed in the chart stand out, however, and give homebuyers and sellers hope for refinancing opportunities later as they wrestle with their golden handcuffs on the embedded low mortgage rates in the homeowner base.
The above chart adds more detail in the mortgage vs. 10Y UST history with some multicycle visuals from 1973. The 2.65% low in 30Y mortgage rates as highlighted above (1-7-21) is a reminder of the golden handcuff effect on existing homeowners. That strains their willingness or even their ability to sell their homes and move on to another mortgage at 6% handles at much higher monthly payments.
The above chart updates the 2Y to 10Y UST slope that we frequently address in our yield curve work. We even saw a new inversion peak to start the past week at -108 bps (7-3-23) before the UST curve was roiled by the FOMC minutes and the ADP shock as the inversion dropped from -108 to -88 bps by Friday with the support of some more restrained jobs numbers from the BLS.
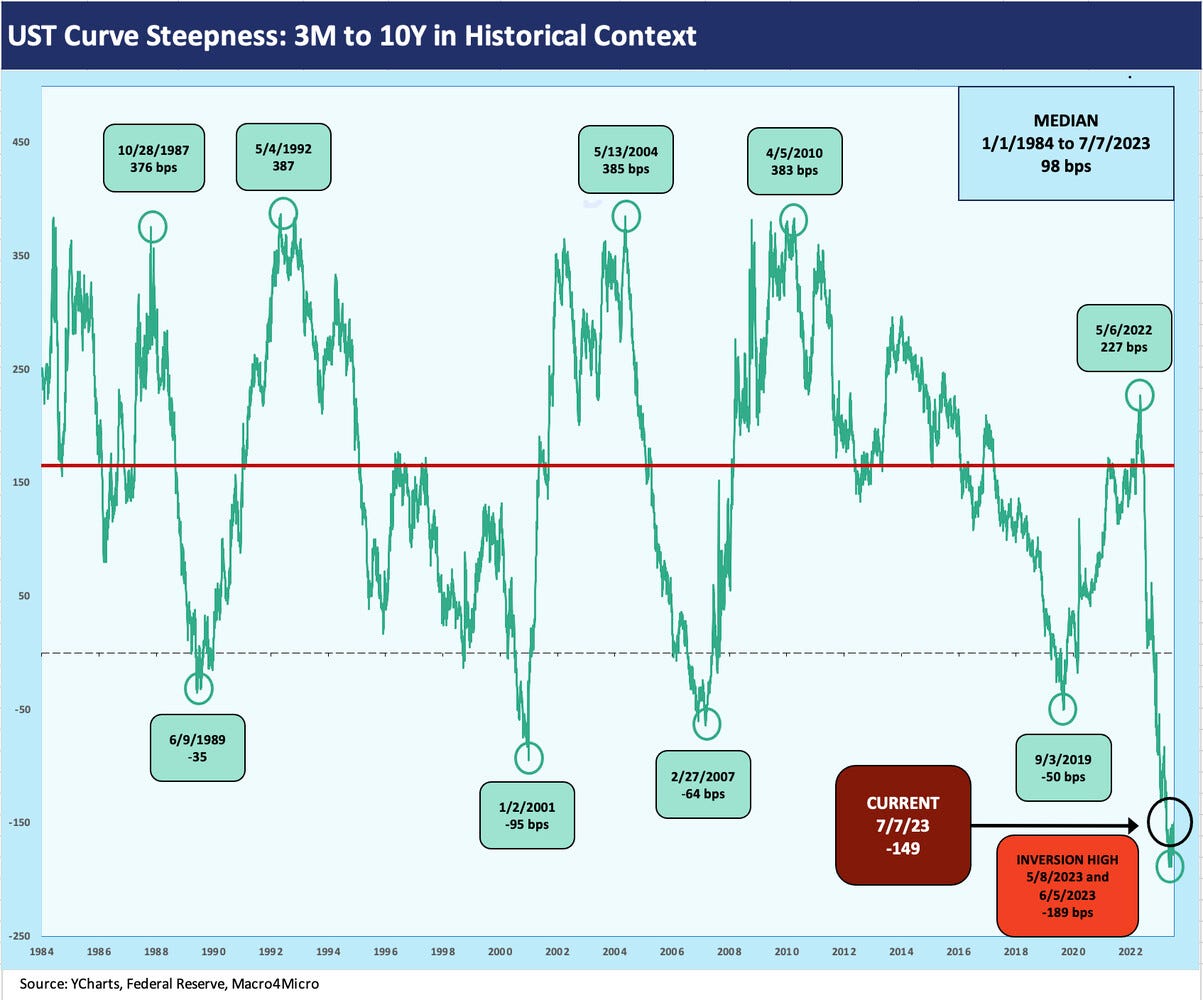
The above chart updates the 3M to 10Y UST slope. The recent shapeshifting shows the flow-through effects of the higher 3M UST together with the upward shift in the 10Y UST. While the inversion is now 40 bps lower than the early June peak, the current -149 bps is still more inverted than any earlier cycle inversion back to 1984 in the timeline.
We end this week’s chart collection with the running migration of the UST curve since March 1, 2022 to start the month when ZIRP ended. We have a box in the chart tracking the moves from 3-1-22 (two weeks before ZIRP ended) to 3-8-23, which marks the downshift in the 2Y to 10Y part of the UST curve as market anxiety rose after the onset of the regional bank scare (see Silicon Valley Bank: How did the UST Curve React? 3-11-23). The second box covers the running timeline to 7-7-23.
The new position of the UST curve is dominated by the front end. The more current UST migration differentials though 7-7-23 vs. 3-8-23 show the new high points for most maturities except 5Y UST. With inversions of this scale, there is room for a lot more action if the market smells higher inflation expectations and/or a more bullish set of economic fundamentals.
Some street forecasts see the 5Y to 10Y UST part of the curve moving lower with small relative moves by a stubborn Fed. The question is whether the forecasts and market is stubborn and the Fed still properly focused on high inflation in a market where fed funds only recently exceeded headline inflation metrics (see Fed Funds – Inflation Differentials: Strange History 7-1-23).
We should have another busy curve week with CPI.


