
Delta: Airline Investors have a Confidence Problem
We look at Delta Air Lines FY 2023 in broader industry context.

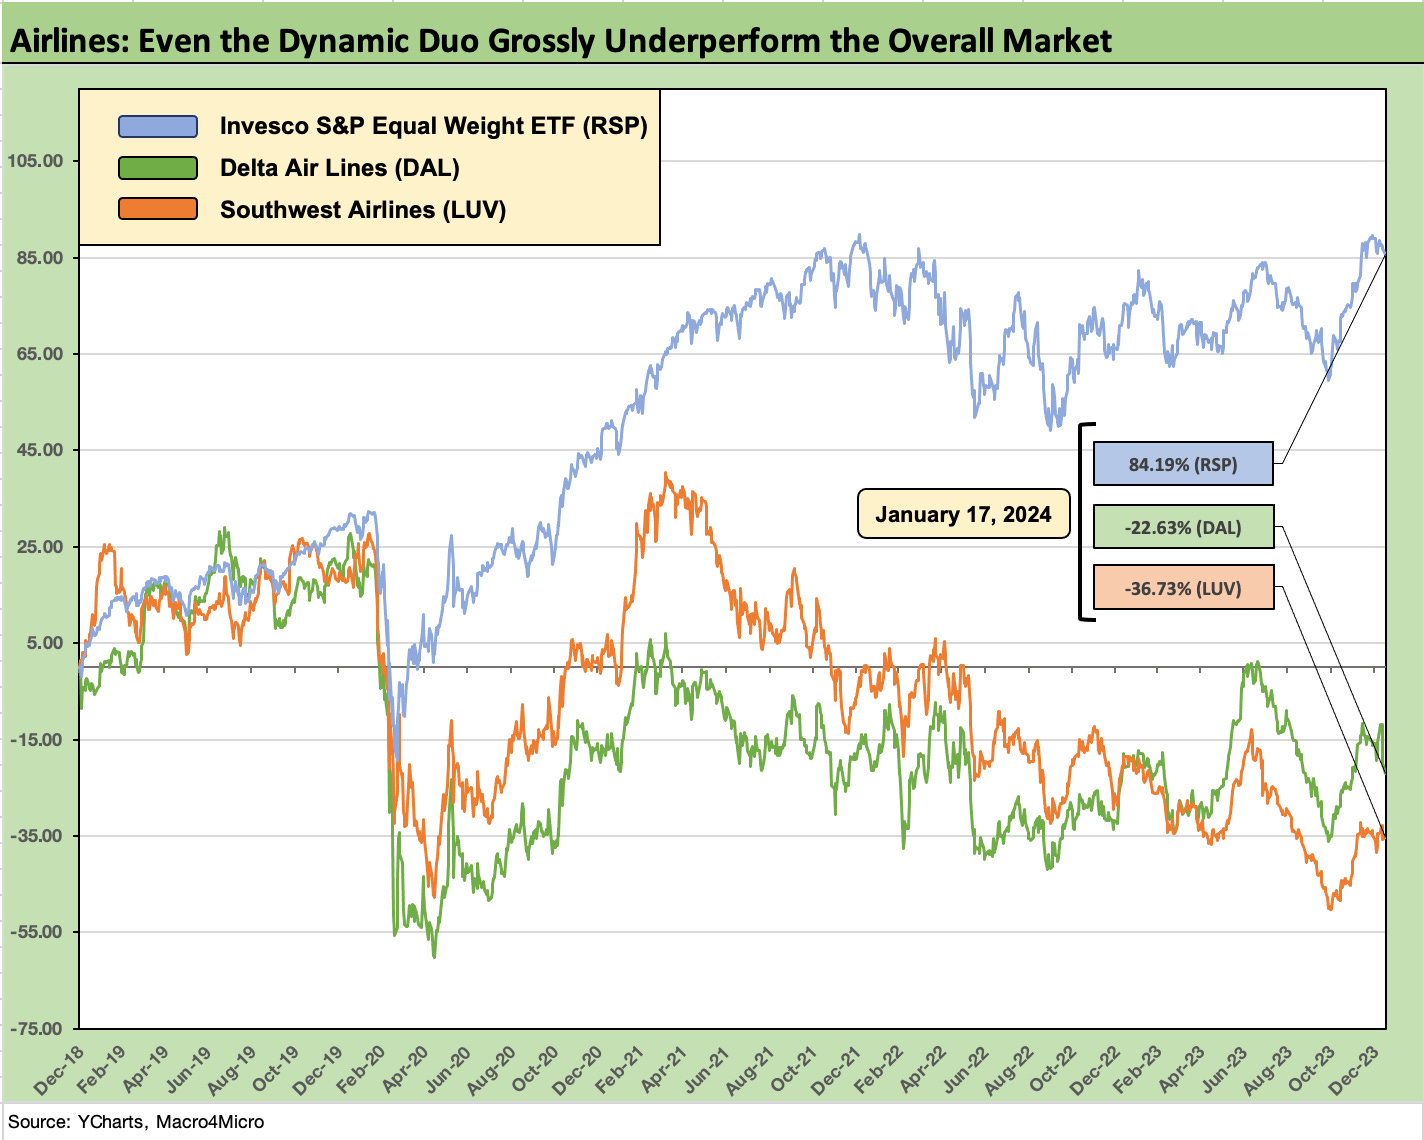
The airline industry has faced a tough audience since the 2019 boom year as we see all major US airlines with equity returns running in the red since then and also over a range of trailing horizons despite booming travel.
The good news for Delta (DAL) is that the credit quality of the company keeps improving, but the path back to full IG ratings has been a steep one given the massive amount of balance sheet repair that was needed in terms of absolute debt levels.
The bumpy ride over the past few years for aviation fuel prices and a very expensive labor deal did not derail the sustained reduction in financial risk with total debt and finance leases down by over $9 bn from year end 2020.
DAL posted higher adjusted margins and operating cash flow with a favorable operating cash flow variance of over $10.2 bn in FY 2023 vs. FY 2020, so we remain very comfortable with the credit quality of Delta as the new industry leader in profitability and market cap.
In this commentary we look at DAL’s financial performance in broader industry context.
Our headline chart above plots DAL and Southwest (LUV) against one another and vs. the S&P 500 Equal Weighted ETF (RSP). Of the “Big 4” carriers, these two are the clear leaders of the pack with DAL winning the battle against the Big 3 global carriers (includes United and American) and LUV the unquestioned low-cost domestic leader with its scale and decades of success despite its recent turmoil. The recent setbacks for LUV (notably the Christmas season 2022 meltdown) do not change its domination of so many secondary hubs and city pairs and successful growth story.
The challenge for the Big 4 generally is “Where do we go from here?” after a boom travel year still left them all with negative stock returns and a multiple of debt balances than they posted in 2019. In the case of LUV, that debt level is still lower than cash on the balance sheet, which sometimes gets underappreciated in the equity markets. We will look at LUV in a separate commentary after it reports. Cash in excess of debt and the ability to remain a very strong competitor while investing in select market expansions and upgrading its technology still makes LUV a very different company in the low cost space and a unique operation in the Big 4.
The relative performance of DAL since the start of 2019 could not be more evident with DAL and LUV, who are the stock “winners” the past 5 years among the majors, well into the red zone with RSP materiality positive. DAL is now the market cap leader with LUV a distant #2. DAL and LUV are the only airlines in the majors that posted a positive total return over 10 years (none did the past 5 years), and that makes a statement on investor confidence in the industry.
As we plot in the stock chart above since 2019 and then frame in more time horizon detail in the trailing return table further below, DAL has been the best performer for a range of reasons we have already addressed in some earlier commentaries (see Credit Crib Notes: Delta Air Lines (DAL) 8-28-23, Delta 2Q23: Bellwether Bliss 7-16-23). Superior execution and a formidable international presence and favorable earnings trends support the improving financial risk profile. Within the “Big Four”, DAL and LUV are the two clear leaders even if United has a very impressive international business (see Credit Crib Notes: United Airlines (UAL) 8-30-23). American has been a notable and persistent laggard.
The credit story…
We see good news for bondholders in the 2023 numbers including the lower leverage of 3.0x (Adjusted debt/EBITDAR) posted by DAL, who has the ambition of wrapping 2024 with a 2x handle. How low that 2x handle within the 2x to 3x range will be influenced by how EBITDAR risk gets swept up in a range of factors. Fuel and the consumer cycle are the major drivers.
There is every reason to expect more credit rating upgrades of DAL unless there is a major disturbance in air travel or an oil shock. The intermediate bonds trade more like a cheap BBB tier name than the composite high BB tier rating and offer a material incremental spread pickup of over 50 bps vs. LUV high BBB tier bonds based on the price indications we reviewed (7-Chord and ICE). We would argue LUV is a rock as a strong high BBB1 composite while DAL is a good crossover holding with favorable credit trends.
DAL cites its credit ratings on its earnings calls as a focal point, and DAL has the metrics and market execution to back up its full IG ratings ambitions. It needs Fitch or S&P to get on board and put its ratings in the upright position. A rapidly increasing base of unencumbered assets combined with lower leverage and decent margins (though still below 2019) help make DAL’s case.
DAL has something for everyone in layers of its capital structure, but we are comfortable with the unsecured at a high BB1 composite. If the upgrades do come through and DAL rejoins the IG index, we would expect activity to pick up to realign its balance sheet, extend liabilities, and unencumber even more assets.
A current coupon DAL unsecured bond with a much cleaner set of layers will be a matter of price, but DAL would be a good BBB core holding for many IG investors. Timing and coupon will be interesting as the overhaul of more airline balance sheets unfold in 2024-2025 and the UST curve debate plays out. DAL has the track record to back up its story.
History has not been kind to airlines, but Delta is one of two winners over the past decade…
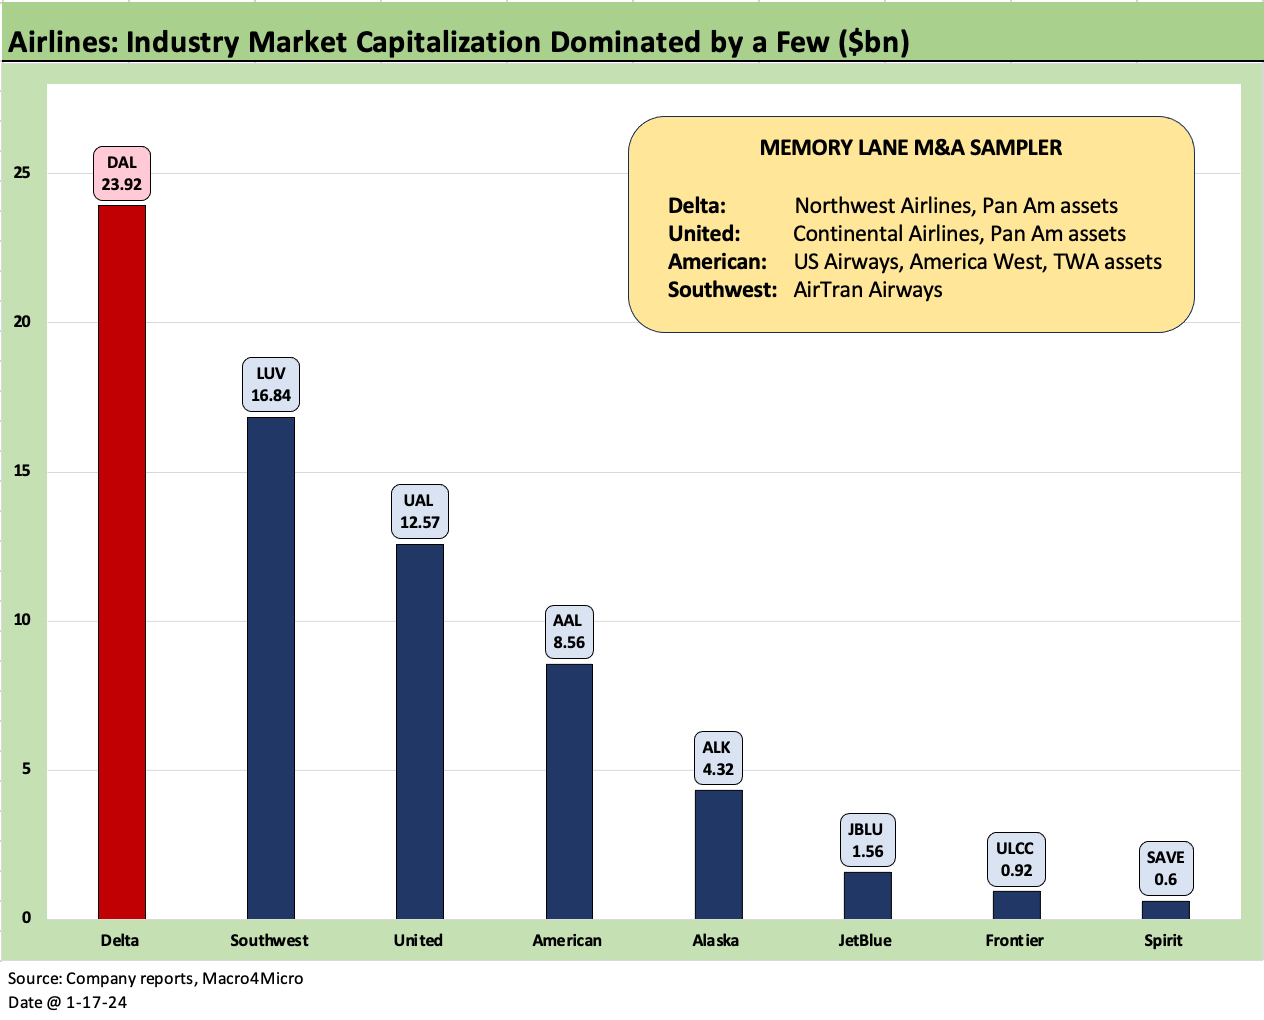
The above bar chart of equity market caps tells a story of the industry and how it has downsized over the decades into the legacy Global Big 3 and the supersized low cost leader of Southwest in what is now a Big 4. DAL is #1 in market cap and Southwest is #2. For all of its brand power in the Northeast markets, JetBlue is a distant #6 in market cap. We add in Frontier (ULCC, as in “ultra low cost carrier”) and the troubled Spirit Airlines (SAVE) for some recent headliners in the consolidation theme.
Gone from the list that I dealt with as stand-alone operators in the 1980s and 1990s are such names as US Airways, Continental, and Northwest among some of the bigger players. We include a “memory lane box” in the chart as a reminder of the gone but not forgotten (OK, maybe forgotten). These names were a routine part of the capital markets “pitch” process of the 1990s as a high level of new issue volume of bonds, ETCs, EETCs and credit volatility was the norm. LBOs (Northwest) were even part of the story line. Each airline had some unique qualities and operating strategy but over time the industry strategic asset mix was rolled up.
There is a reason the airline industry faces mixed opinions around how to rank the industry’s business risk profile. One of the main risks is captured above in that few survive. The consolidation and many bankruptcies over the years preclude seeing this industry as anything other than high risk. High leverage compounds the risk. Southwest is a rare low financial risk airline with a balance sheet that can absorb a beating.
Based on history (notably defaults), the business risk is high, earnings are volatile, and “events” have been damaging. Geopolitics (usually centered around war and oil) have taken a severe toll across the decades. In 1990, it was war (Desert Storm) as fear of travel and high oil prices sent a few names into oblivion and some ceased to exist (notably Pan Am, with many of its best assets going to Delta). Round two of Iraq in 2003 did not help as it came on the heels of post-9/11 stress (We look at the Chapter 11 and merger history in the separate DAL Credit Crib Note).
LUV is a bellwether bond comp for DAL with each a leader in their respective strategies.
No major airline has a clean history. That is just the reality. Even the transformational Southwest has been taking a beating in recent years as the airline congestion challenges and need for dramatic improvement in systems caught up with LUV’s “measured” investment strategy. LUV was fined heavily by Washington and got a lot of bad PR.
Despite the latest problems, LUV remains unstoppable on the back of their captive or semi-captive hubs, extensive route domination, and in most years very effective service out of many secondary hubs. Investors will need to watch closely how the 737 MAX fleet certifications play out. LUV has major orders in place and notably some recent major orders for the 737 MAX-7 that awaits final certification.
For a Southwest side story, over three decades ago I was in line in Dallas ready to board a LUV flight with a numbered tongue depressor for the first-come, first serve seating strategy on an intra-Texas LUV flight. I had visited Southwest with a banker who drove a white Porsche (Seriously), so the experience was strange (I was hoping for a Chevy pickup truck). We ate with the LUV CFO in a tray-through cafeteria at their spartan Dallas Love Field headquarters as he extolled the virtues of lean costs and rapid turnaround times on flight and leading the industry in flight time per plane (i.e., hours in the air per plane). The Herb Kelleher ethic was all around you.
That banker and that cafeteria was a notable contrast. The CFO was no-nonsense. Low cost was very effective back then after the chaos of 1990. LUV had lower credit ratings than Delta and AMR at the time, and then LUV took the industry by storm. LUV and DAL are likely to remain the industry leaders with their respective business models. The more I researched LUV, the easier it was to be a believer. Southwest was no People’s Express (from a debate with a client on that point).
DAL has outperformed UAL in the markets, which is the best comp among the legacy Big 3 global carriers. DAL presents a radically different business model than LUV, but it outperformed the other two members of the global Big 3 despite the many similarities in the core strategy. All of the Big 3 went through Chapter 11 processes and major M&A periods and faced integration challenges, scrambles for available assets (notably those of Pan Am and TWA of epic bygone years). In the end, DAL is the clear winner among the three with UAL making a push and AAL struggling.
Tough histories and event-filled volatility…
The industry saw a long stretch of post-deregulation (1978) collapses that later saw many overleveraged start-ups bring intense competition but very mixed results. The current mix of US-centric low-cost players are struggling, and this week’s death of the JetBlue-Spirit deal will keep competition very tough on the domestic front. JetBlue has a distinctive operating strategy, but the low-cost carriers made for a battle for JBLU. The rise of the low-cost carriers, the post-9/11 stress, and protracted periods of consolidation are part of a very convoluted and event-filled history.
A pandemic, flight equipment setbacks in the industry (737 MAX-9 the latest), fuel price volatility, and airport congestion problems (and very bad press) seem to rotate in and out of the picture. The macro picture saw a consumer services spending binge as the purchasing power shifted from goods to “experiences” and that provided outsized pricing power at a key time when labor pricing power was soaring alongside travel demand this last year. Sustaining that demand will not be easy.
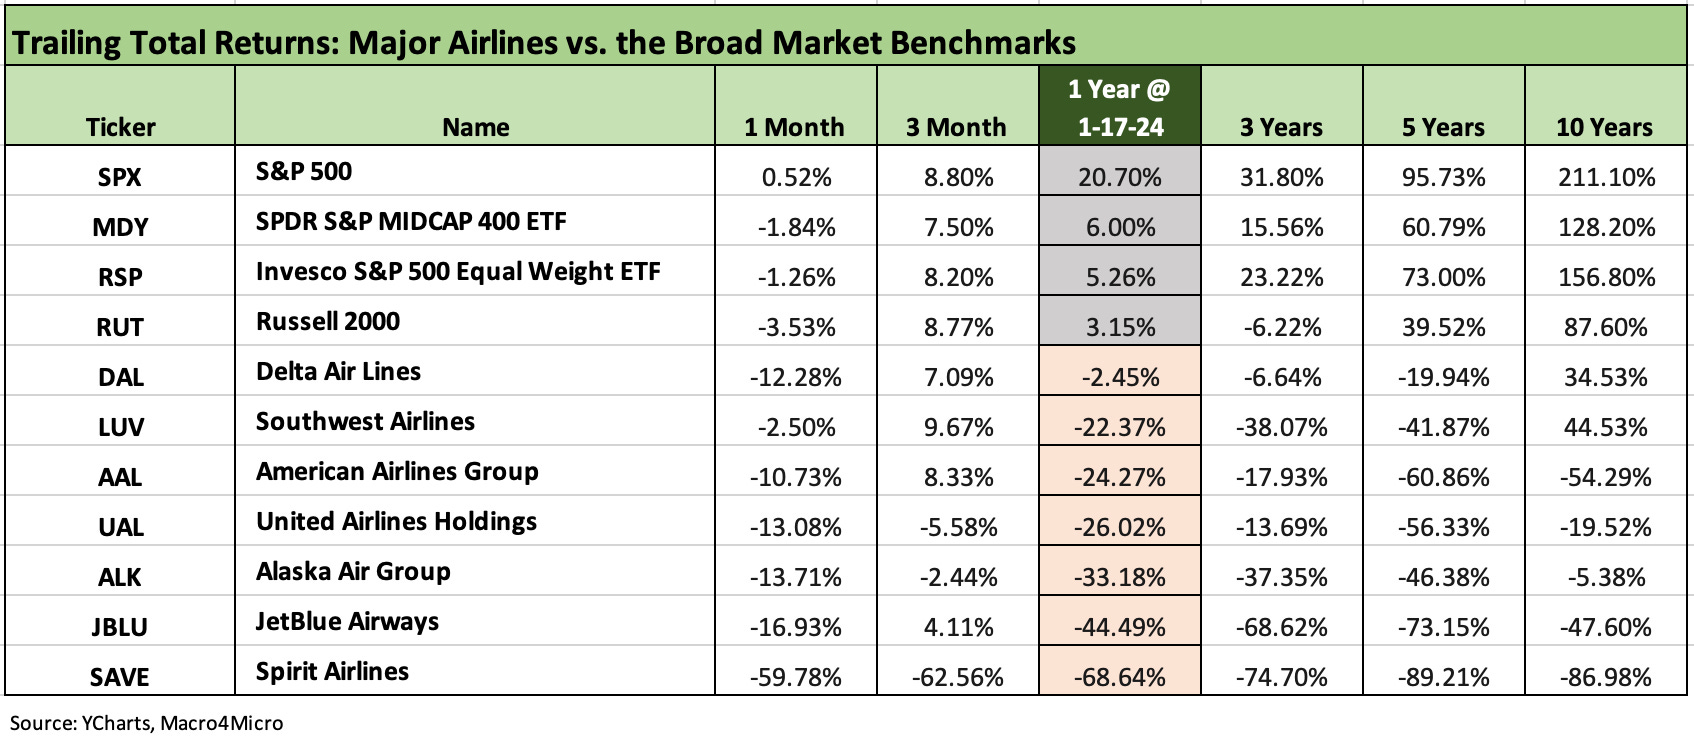
The above mix of trailing stock returns tells a favorable story around DAL vs. peers but also highlights the high mix of negative returns over a very challenging recovery period. A banner earnings year in FY 2023 came after a very healthy travel period that was much stronger than even the 2022 rebound. The earnings and cash flow recovery is getting DAL back toward being a less asset-encumbered IG company with a lot more financial flexibility to deal with new challenges that often come in global travel, whether from geopolitics or fuel prices.
Boeing also just reminded everyone again how fleet deliveries and the risk of groundings happen too frequently (one 737 MAX setback was enough). At least DAL is not swept up in the immediate 737 MAX-9 issue (see Boeing: Different Scales, Different Magnitude 1-10-24) which is limited in its scope so far.
The MAX problem could create some capacity challenges in some key markets if the problem slows down some other certifications. DAL’s main exposure to the MAX is a major order for 737 MAX-10 that was to start arriving in 2025. That is a higher capacity version but is not caught up in this current problem in terms of delays (yet). For now, a very modest benefit accrues to DAL if the UAL and Alaska (ALK) capacity shortfalls detour traffic or more pricing power to DAL for some airports and routes.
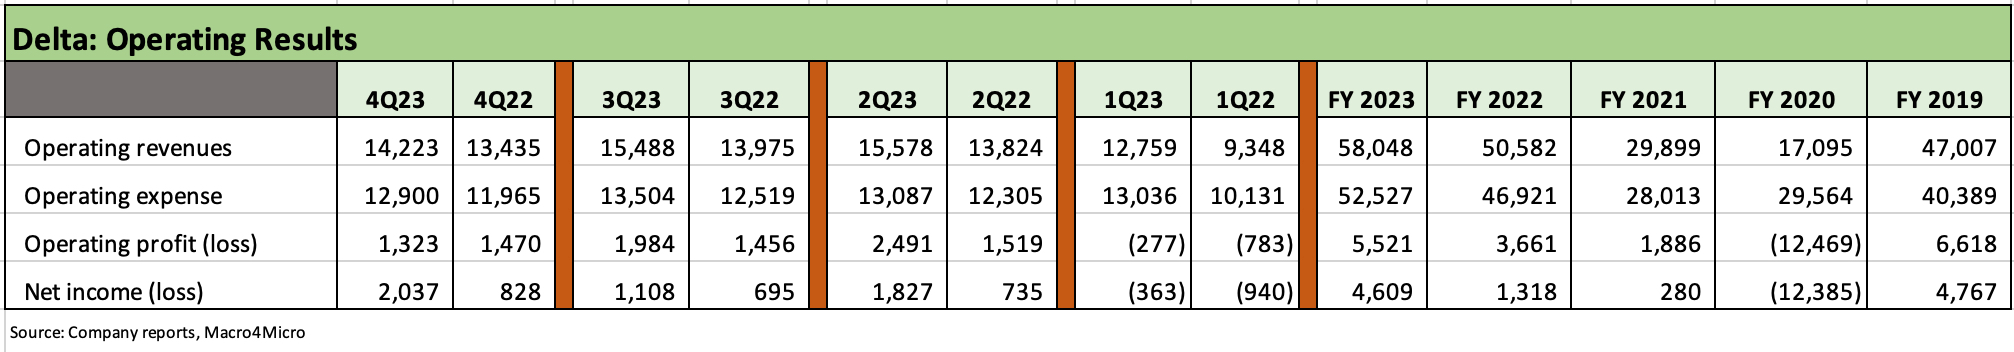
The chart above tells the annual story on the DAL results since the 2019 peak numbers. We also look at the breakdown for each quarter YoY in a bit of a crowded table.
The $5.5 bn in operating income and $4.6 bn in net income for FY 2023 are stellar numbers in the context of recent years, but it is worth noting that DAL averaged $6.5 bn in operating income and a $4.1 bn net income from 2015 to 2019. In other words, that takes some of the shine off 2023. On the other hand, the 2015-2019 period demonstrated the proven ability of DAL to sustain strong earnings even at lower revenue levels than seen in current times. That should offer some comfort to those framing credit risk.
Sustaining current margins will not be easy of course. The stock valuation and equity holders need to worry about steady growth and room to reward shareholders. That hope might get tempered by consumer cycle handicapping, a materially repriced labor force, and the ever-unpredictable direction of oil and the timing of sharp moves in fuel vs. seasonal ticket pricing.
Looking across the quarters of 2023 above shows quite a swing from the seasonally slow 1Q period when the pilot agreement charges were booked on through the seasonal pickup in travel and softening fuel prices. Those fuel prices will be vulnerable to escalation in the Middle East with Iran and Yemen acting up.
Delta guided to a 3% to 5% capacity growth (ASMs) in 2024, or below the earlier Investor Day guidance. That reduction was one of the items that spooked the market on more guarded growth expectations for the major airlines. Growth was described as “normalizing” after the post-COVID rebound and “restoration.”
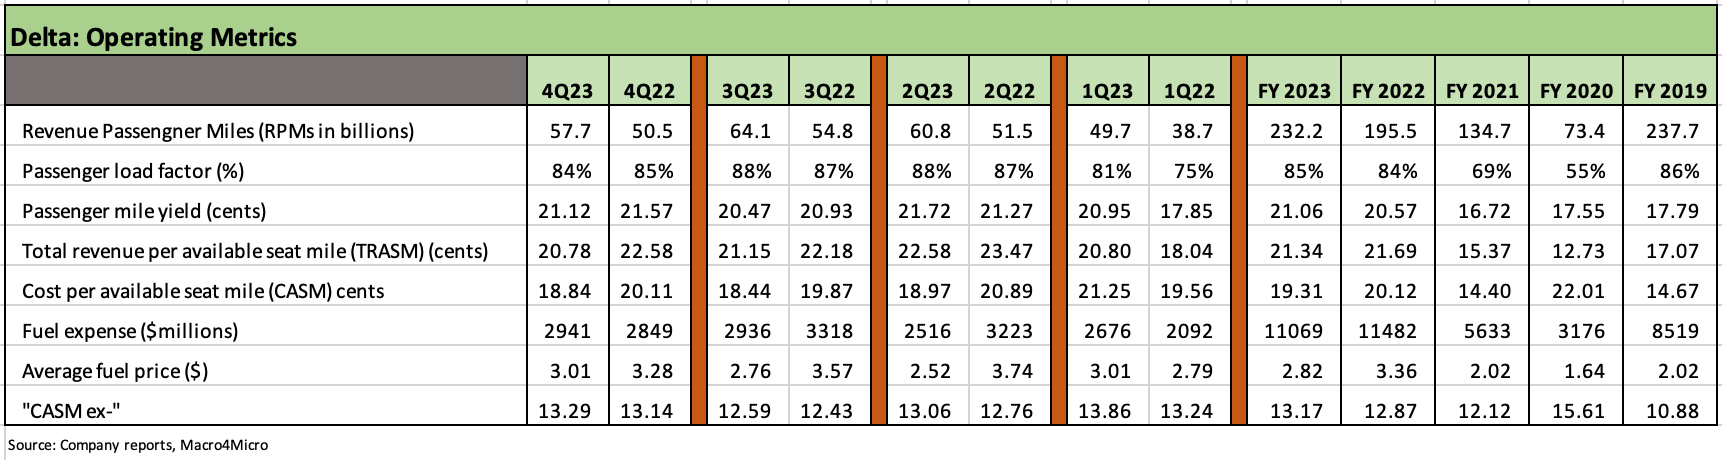
The operating metrics frame the substantial recovery back toward the volumes of 2019, but the running Revenue Passenger Miles fell a bit short in FY 2023 vs. FY 2019. Yield and costs are both climbing across time from 2019 as evident in the yield, TRASMs and CASMs above and the jockeying between the revenue and expense trends.
The margins of 2023 fall well short of 2019. FY 2023 weighed in with a GAAP operating margin of 9.5% vs. 14.1% in FY 2019. Getting back to 2019 margins for a full fiscal year is a very heavy lift with the new cost structure.
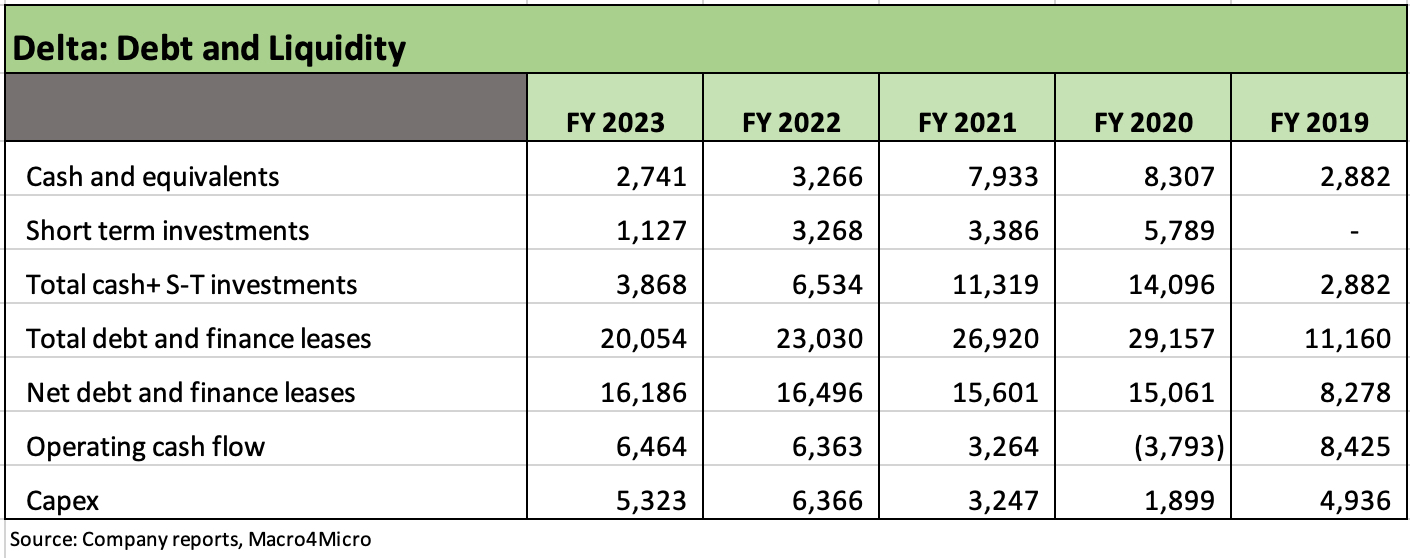
The headline financial risk commentary from management on the conference call was that leverage (Adjusted debt to EBITDAR) was down by two turns to 3x from 5x and was heading toward 2-handles in 2024. Unencumbered assets reached $26 bn at 4Q23 with more to come.
DAL focused on its ability to generate free cash flow after capex. For FY 2023, DAL posted operating cash flow of $7.2 billion and free cash flow of $2 bn after $5.3 billion in gross capex. DAL indicates that it expects $3 bn to $4 bn in free cash flow after capex of $5 bn in 2024. DAL also indicated it will pay cash for 45 aircraft deliveries, thus boosting the unencumbered asset base to around $30 billion. DAL will also pay cash for $3 bn in 2024 for debt maturities.
When the FY 2023 reporting season ends (United, Southwest, and American report next week), DAL and LUV will still be the industry anchors.
See also:
Boeing: Different Scales, Different Magnitude 1-10-24
Credit Crib Notes: United Airlines (UAL) 8-30-23
Credit Crib Notes: Delta Air Lines (DAL) 8-28-23
United Airlines - Company Comment 7-22-23
Delta 2Q23: Bellwether Bliss 7-16-23