Delta Air Lines: Tailwinds on the Return Flight
Excerpt from Footnotes and Flashbacks: Week Ending April 16, 2023
Delta reported results for its seasonally slow quarter, but as always the 1Q23 release and conference call is about the outlook for the spring and summer travel periods and how the supply-demand balances are shaping up after so much logistical and infrastructure turmoil in 2022 and into 2023.
The guidance was bullish on demand and revenue growth in 2Q23 with mid-to-upper teens growth (15% to 17%) and revenue guidance for FY 2023 in a range of 15% to 20%. That is impressive guidance and helps drive home the expectation for the full year of free cash flow of over $2 bn.
The priorities of getting back to investment grade by next year were restated, and the target of 3x to 3.5x leverage reiterated. Delta is at the top of the heap now in performance across most industry metrics and certainly among the “Big 3” of DAL, UAL and AAL.
The return to the less troubled days of 2019 is always a topic with airlines, but that is still a long way off by most metrics. Those days are going to be hard to recapture until major reductions can be made in the mountain of debt still on Delta’s balance sheet.
Below we frame how the timeline for the Big 3 airline equities played out since the the 2019 fiscal year through Friday close.
The above chart underscores that DAL has been the top performer across the Big 3 comps (DAL edged out Southwest as well), but in all the excitement of the improving financial strengths across a brutal period after COVID, all of them are still in the negative zone. As strong a performance as Delta has put together in its superior results, the reality of the debt load is still very much a structural problem that makes for a tough trade-off on credit quality vs. shareholder rewards.
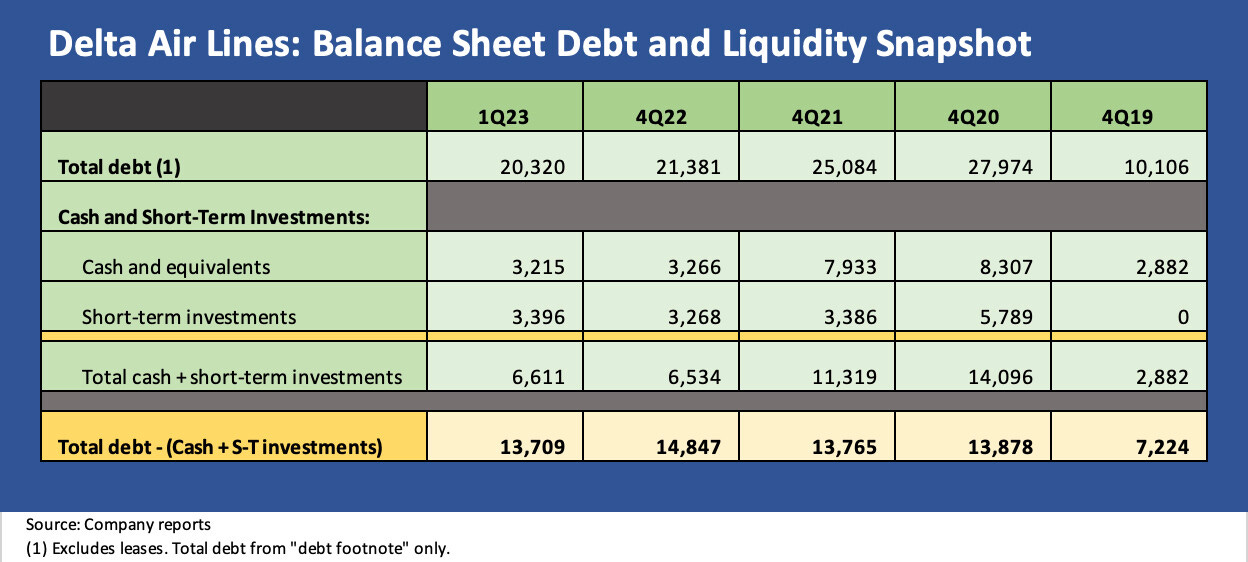
We revisit a very simplified profile of the debt lines below. We recognize that there are a slew of other angles that need to be looked at on the moving parts of balance sheet and liquidity risk for airlines with lease exposure and fleet planning at the top of the list. Pension adjusted leverage is another crowd favorite.
I covered airlines in the late 1980s and early 1990s and then in the early years of CreditSights in the post-9/11 travel crisis as more airlines headed for Chapter 11 and eventually more mergers and consolidation. The volatility of the industry has always been a hallmark. The same is true for the volatility of oil prices and how that drives fares and earnings.
The big moving parts can be hard to predict, but the capacity constraints that can cause travel problems also can protect pricing power for 2023. For now, Delta and peers can keep defending that balance. That is the good news. However, at some point a lot more of that debt needs to be paid down. The RASMs and CASMs can move around dramatically, but a loan has a number that needs to get paid back.
The chart is just a stark reminder of how different the debt burden is now vs. the end of 2019 with the total “footnote debt” (vs. lease adjusted risk metrics) still double the level of 12-31-19. Airline analysis always falls into a chowder of lease adjustments and RASM-CASM-TRASM-PRASM spasms, but it still gets back to balance sheet profiles and how free cash flow is deployed.


