
November CPI: The Big 5 Buckets and Add-Ons
We look at a mix of CPI metrics that don't advance the easing cause much but had some pieces moving in the right direction.


We update the major CPI moving parts with a focus on the Big 5 categories that account for almost 75% of the CPI index and drive consumer health while the add-ons bring the total to almost 87% of the index.
The 3.1% headline YoY CPI number ticked slightly lower from 3.2% after a more material decline seen in Oct’s drop from the 3.7% headline CPI of Sept to the 3.2% of Oct.
Services less Energy remains stubborn at +5.5% and brings a challenging metric into the equation but is tempered by key “CPI ex” numbers such as “All items less Shelter” at a favorable +1.4% (down from +1.5% in Oct) and All Items less Food, Shelter, and Energy” at +2.1% YoY (up from 2.0% in Oct)
The Month-on-Month CPI All Items ticked higher to +0.1% from 0.0% in Oct and Core CPI monthly ticked higher to +0.3% in Nov from +0.2% in Oct, so that is hard to pitch as a favorable trend even if you can get back to pitching a bearish forecast.
The CPI perception quiz will be a tough one each month from here as the market awaits headline or core numbers that look like they are closer to the 2.0% line either at the headline or core level. Below we look at the major line items that comprise the CPI index, and we don’t see reasons in this month’s numbers to be confident around early easing or material easing unless you add in a mental forecast on a weaker consumer sector and a fair amount of job losses in 1Q24.
The case can be made (we are not making that case yet) for material weakness in 2024 even if the strength of GDP growth in 2023 will make room for a weak and slower growth expansion. It is not easy to make a contraction case - yet. That view is still a forecast without too much more in tangible signals beyond what has already been there (ISM, etc.).
For now, the Nov 2023 CPI line items show a mixed trend that is hardly as supportive as the sequential trend during October in the move from 3.7% to 3.2% and a MoM 0% headline month.
The Big 5 drivers of inflation are mixed sequentially…
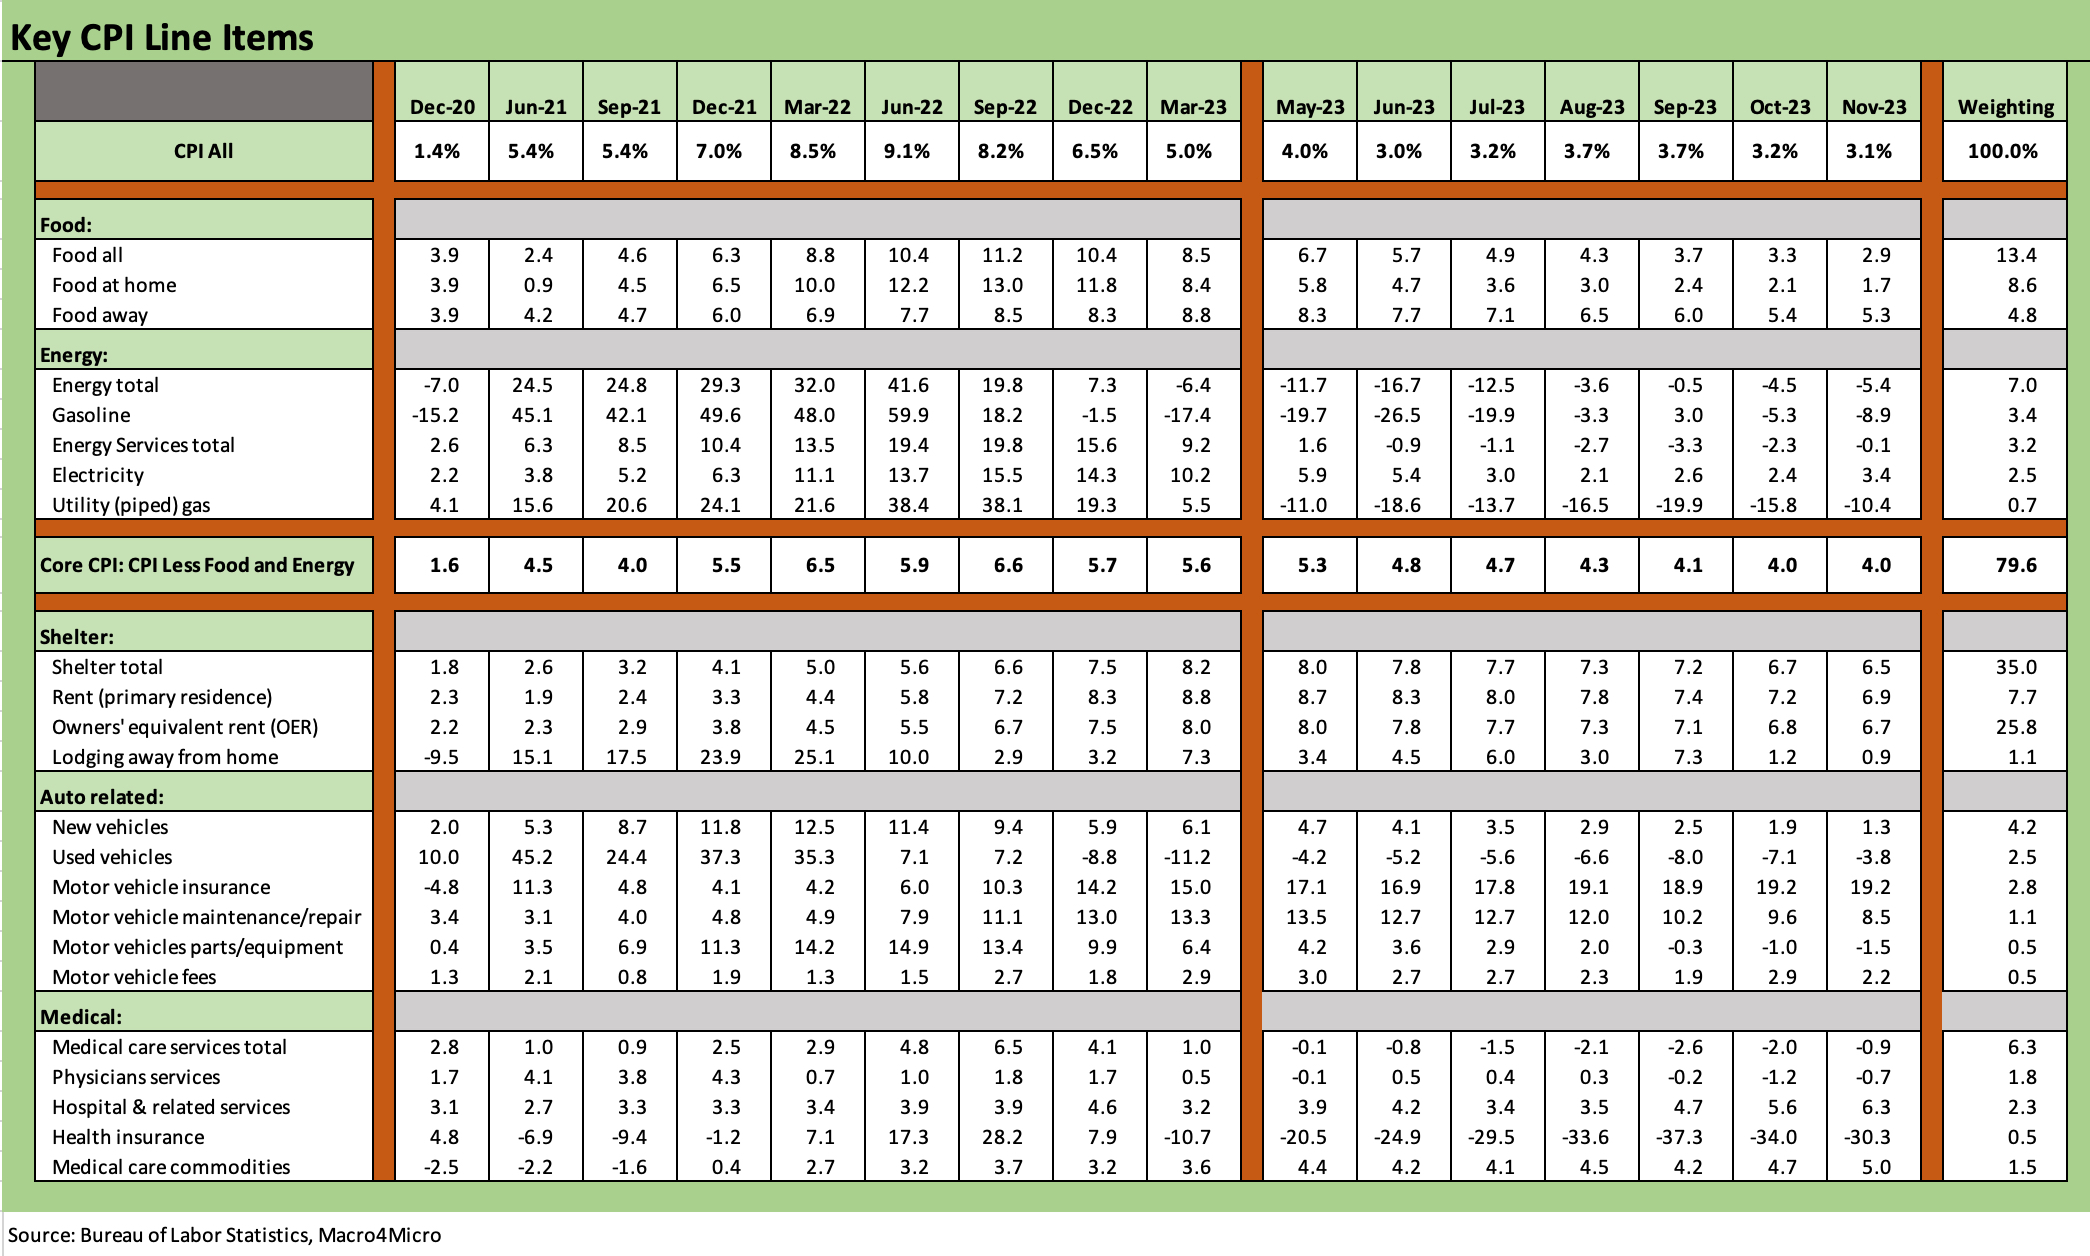
As we look across the Big 5 above, the good news starts at the top with Food inflation lower and Energy deflating even more. The serious beatdown of energy equities reminds us of good news in CPI (see Footnotes & Flashbacks: Asset Returns 12-10-23). Natural gas remains low and both oil and natural gas in the US are running at record production levels.
We look in detail across CPI timelines for Food and Energy and we also review the Shelter and Services histories in our recent drill-down commentary (see Inflation Timelines: Cyclical Histories, Key CPI Buckets 11-20-23). In that note, we also looked at the long and volatile history of Food and Energy. Energy deflation is not hard to come by, but Food deflation is very rare. As a young consumer of spam in my formative years (occasionally nestled in a soft bed of Velveeta), household budgets on Food can be a major problem in election years as we discuss further below.
The Shelter line disappointed the headline CPI watchers this month with a very minor move overall to 6.5% from 6.7%. Given the dominant role of Shelter in the CPI index, that holds the key to getting closer to 2% handles and getting Services ex-Energy below 5%. We are not going to reiterate our views on Shelter as a less-then-useful metric with Owners’ Equivalent Rent (25.8% of CPI) not grounded in the household “cash-in, cash-out” experience, but the ex-Shelter metric still means more to me in economic substance. The objective numbers say impressive progress has been made in bringing inflation down and notably so without the Shelter methodology distortions.
We break out somewhat of a customized Automotive Inflation grouping above to drive home the high cost of owning a car when insurance and maintenance/repair get factored in. Adding those together total an 11.6% weighing in the CPI index. Automotive is almost as large as Food all and higher than Food at home and even Energy and Medical Services. This is a driving nation.
The trend overall in Automotive was favorable, but Motor Vehicle Insurance is in another world at a +19% handle with Maintenance and Repair in high single digits but down from the double-digit highs as detailed in the chart. We believe used car CPI moves get too much attention when the car you are using rather than the used car is the daily and monthly source of household “expense creep.”
Medical care services CPI remains in check with deflation in the numbers again. At a time when Trump is returning to his vendetta against Obama and John McCain in his speeches and looking to repeal the ACA, that medical services inflation line will get more attention into the 2024 campaign season. Medical care services show a CPI weight of 6.3%. Medical care “commodities” adds another 1.5% in the CPI weighting for a total of 7.8%.
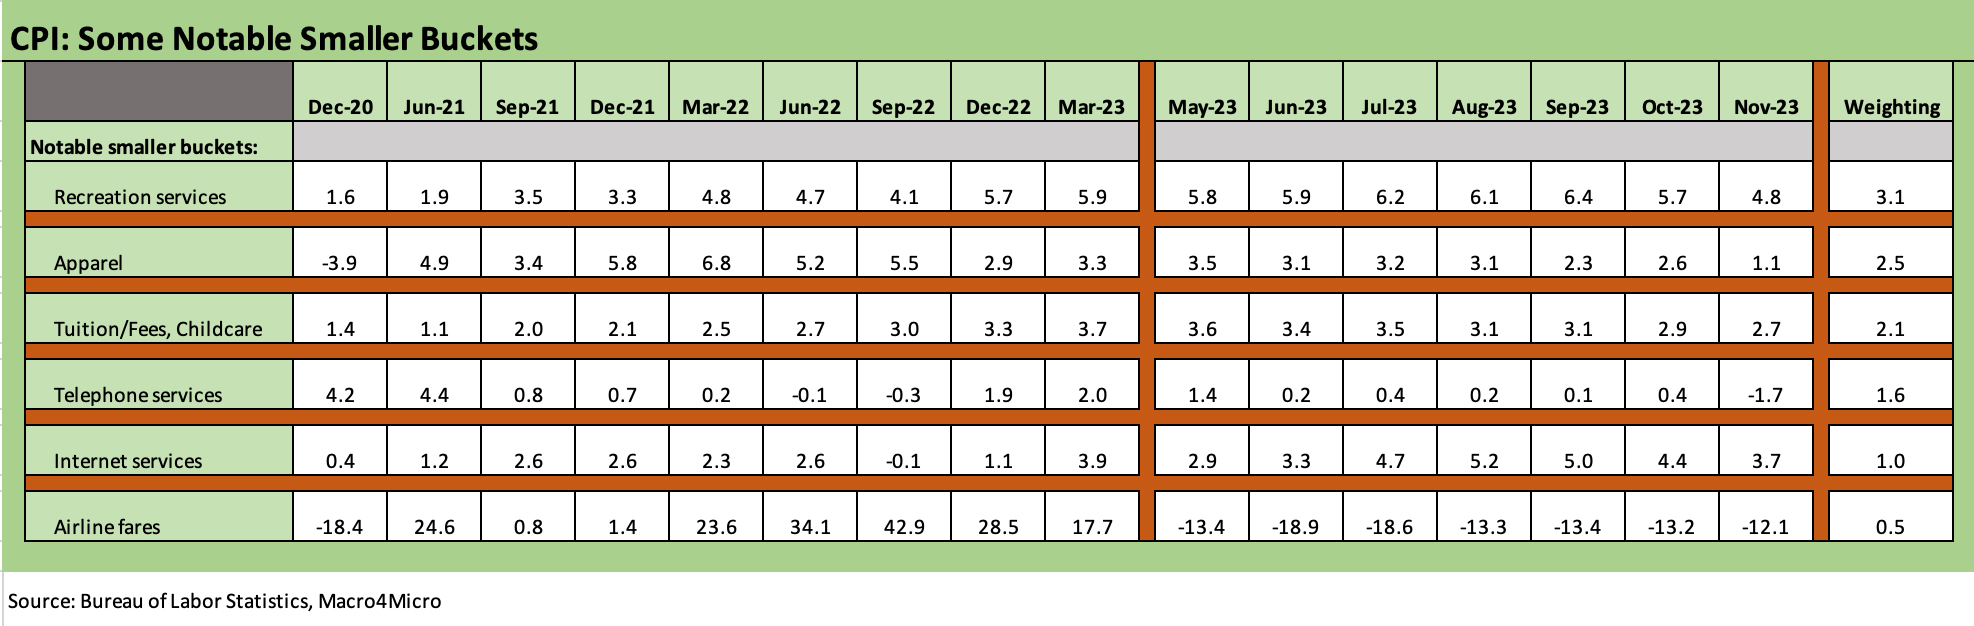
The “Add-Ons” cover an additional 10.8% of the CPI index, and we see 5 of the 6 presented line items lower with only Airline fares not mathematically lower but showing less deflation at -12.1%. Aviation fuel covers a lot of the activity in air fare pricing, but the deflation in air fares is coming down from what were borderline obscene rates on international travel as the Big 3 airlines minted profits amid a consumer “experiences” boom.
It is hard to immediately pivot to consumer weakness and Fed easing after the summer travel numbers followed by strong PCE numbers and a 5% handle GDP quarter. That requires bearish fundamental forecasts starting with consumer spending and negative monthly numbers in payroll trends. It has happened before coming off such growth peaks, but the warning signs are hard to find even with some consumer credit delinquencies. We will see Industrial Production and Retail sales later this week for more input.
Inflation and politics will run alongside easing handicapping…
The Energy swings are the stuff of legend back since 1973, but the consistent repricing of the “food basket” higher can be a political dagger in an election year. Just ask Jimmy Carter, whose employment growth and GDP growth and fiscal management during his one term were vastly superior to that posted by Trump, who traditionally used Carter as one of his clay pigeons (see Employment Across the Presidents 8-15-23, Political Economy: Topics Where Facts Matter 8-23-23). A broad economic pain like inflation or a recession are hard to slip past based on history. Reagan’s 1981-82 recession was a major recovery by 1984.
One -term Presidents always had something go very wrong and usually near the end of their term. Carter had the Iran oil crisis, GHW Bush had a recession after earlier booking one of the highest Gallup Polls in history (neck and neck with his son). Trump had COVID. Biden has experienced a wide ranging and multifaceted inflation shock that opponents want to blame on one stimulus bill as the root cause.
In other words, noisy and partisan days are ahead in a constant twisting of facts and concepts to simplify the root causes of inflation. The Fed’s ability to ease and Biden’s rep are thus somewhat linked. The inflation war is being won, but the aftereffects on the food menu will remain a hangover for many households.
Contributors
Glenn Reynolds, CFA glenn@macro4micro.com
Kevin Chun, CFA kevin@macro4micro.com