Credit Crib Note: Deere & Co (DE)
We frame the financial and operating fundamentals of Deere as a bellwether global industrial.
Credit quality trend: Stable. The exceptional performance of Deere (DE) over the past few years is seen in record revenue and earnings, healthy double-digit operating margins, and sustained high discretionary free cash flow generation. DE posted multiyear lows in net debt framed against a much-enlarged equity base. That performance is set against a cycle that featured a pandemic, massive supplier chain disruptions, and a multi-decade high in inflation along with a tightening cycle not seen since the Volcker years during the 1979-1982 inflation war. The 2023 fiscal year will mark the cyclical peak in revenues and earnings, but forecasts still call for steady double-digit margins in the core equipment segments even in the face of aggregate volume declines with some units facing double-digit declines in revenue.
Operating Profile: As the market leader in global agricultural equipment with a financial services operation that serves as the farm sector equipment and working capital “bank” for many, DE is both an iconic brand (the image of green hats and green equipment) and an operating company that won the multi-decade war for global supremacy against major US, Japanese, and European competitors. Pricing power and a high rate of R&D and reinvestment in its operations has been the result. That all translates into a superior and confident dealer network. With demographics on its side (“more mouths to feed” and “you gotta eat” etc.), the secular demand strength of the business line is intuitive.
Financial trends: With $2.7 bn in net debt at the equipment operation, set against over $106 bn in equity market cap, DE is a relatively easy credit to get very comfortable with for high quality defensive investors and money market funds. DE cash flow leaves impressive flexibility with stock buybacks in 2023 exceeding its net debt at equipment manufacturing. The primary vehicle for borrowing is the John Deere Capital (JDCC) unit across commercial paper, securitizations, and medium term notes along with a mix of backup lines and warehousing facilities. JDCC is a very low risk counterparty.
The headline revenue and earnings trends alone underscore a very strong earnings cycle for Deere across a period that included COVID on the heels of the retaliatory trade war fallout in the farm sector. The record revenues and earnings posted in 2022-2023 came with strong double-digit margins including 20% handle margins in its largest segment, Production & Precision Ag.
The +16.5% increase in revenues and over 42% increase in FY 2023 net income makes a statement even if the 4Q23 performance reflects a mix of flattening and softening both in 4Q23 YoY trends and in negative guidance for 2024 revenues.
Replacement cycles in the ag sector can be very distinct from other pockets of the capital goods sectors, and this latest cycle had supplier disruptions and product availability allocation issues. That supply-demand imbalance added to pricing power for a global leader to further inflate earnings and cash flow.
The strong numbers for FY 2023 (October fiscal year on a 52/53 week cycle) came after FY 2022 posted a +16% revenue increase vs. 2021. During 2022, net income climbed by more than +19% vs. 2021.
Favorable revenue trends came with a demonstration of Deere’s pricing power as volume trends hit a peak and supplier chain challenges and products often faced “restricted availability.”
Guidance from the consolidated level to the segment level frames 2023 as the peak earnings year, but the $7.75 bn to $8.25 bn net income guidance for 2024 would be higher than the second-best year posted in 2022.
In a world with more than its share of trade stress and political risk, Deere benefits from the majority of its revenues being generated in the US markets with over 60% in US+Canada and around 75 % in US+Canada+South America. The fact that US+Canada has demonstrated competitive advantages in the ag sector is another positive factor in terms of the business risk profile of Deere.
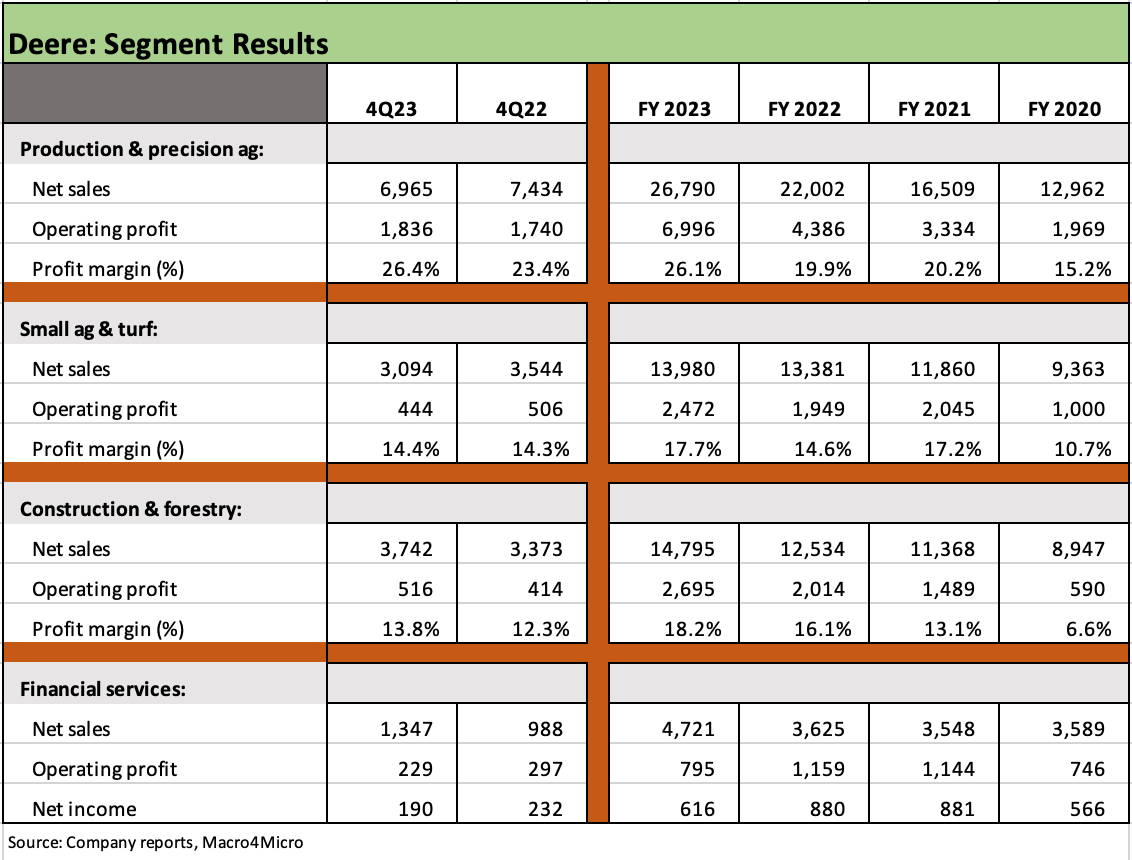
The above chart details the segment results and operating margins for the three Equipment segments and the Financial Services segment.
Production & Precision Ag is the largest segment and delivers the highest margins and strongest growth. Equipment products have evolved into the realm of “smart operations” with increasing technology-based solutions and connected equipment to serve large, production scale growers. DE is well positioned to exploit those changes given its capex and R&D scale.
Production & Precision Ag is guiding to a 15% to 20% decline in segment dollar sales in 2024 but with only a modest narrowing of margins to 23% to 24% as pricing power remains intact but volumes will be down materially. The overall large ag business in the US and Canada is being guided to a 10% to 15% decline in unit sales.
Deere keeps on pressing the advantage in product investment with the Investor Day in 2022 focused on the tech initiatives under the heading of “Leap Ambitions.” Higher capex spending in 2024 look to improve that leading position further.
Small Ag & Turf generates lower margins and is a segment half the size of Precision Ag, but double-digit operating margins are still strong in the context of the broader manufacturing universe and mature capital-intensive cyclicals (Deere is “cyclical” but in its own distinctive world of ag mini cycles).
As with Precision Ag, Small Ag & Turf also saw a decline in 4Q23 sales and earnings after the full year FY 2023 saw sales rise and margins expand. Weaker volumes in 4Q23 signaled what lies ahead for 2024 with the pricing power of 2023 likely seeing a fade.
Volume guidance for the broader mix of “ag and turf” volumes sees a potential decline of 10% to 15% in unit sales for “large ag” in the US and Canada, 5% to 10% for “small ag” in the US and Canada, a 10% decline in Europe, a 10% drop in South America, and a “moderate” decline in Asia.
Construction & Forestry (“C&F”) edged ahead of Small Ag and Turf as the #2 segment by sales in FY 2023 with 18% top line growth and a very solid segment margin over 18%. The 4Q23 results kept the growth story going with +11% sales growth, but like the “small ag” segment, C&F is looking at declining volumes for 2024 at down around 10% with positive but low pricing (+1.5 points) after seeing 6 points of price realization in 4Q23.
C&F sees sustained high-teen margins into 2024 at 17% to 18% on structural changes that unit has in place. Construction will be a mixed picture overall in 2024 with some sectors under pressure on adverse interest rate trends with others (notably the “mega projects”) still running strong.
Financial Services operations are primarily out of the John Deere Capital Corp unit (JDCC) where retail, wholesale, leasing, and revolving charge account operations make that unit the main borrowing entity in the commercial paper, securitization, and bond markets.
The Financial Services segment is expected to post a decline in net income in 2024 to $770 million with tighter financing margins and higher provisions offsetting a record earnings asset base as Deere grows both sides of its balance sheet. That pressure on financing spreads comes after a protracted and extended period of extremely low short-term funding costs.
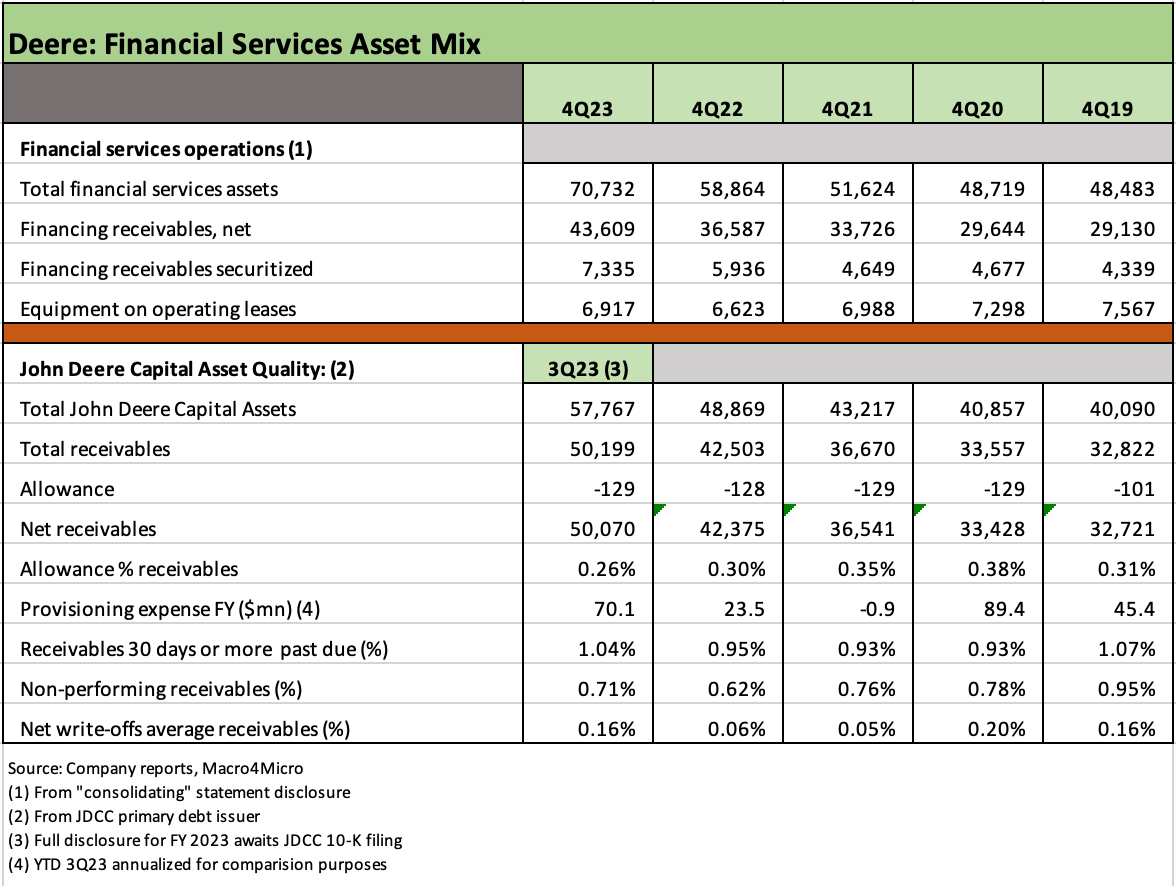
The above chart looks at the asset profile for financial services. The chart shows the details from the “consolidating” disclosure provided by Deere in its 4Q press release. The more rigorous disclosure from the John Deere Capital SEC filings is where the asset quality histories were sourced. Deere’s financial services segment is global in scope and includes such products as extended warranty products to support equipment sales.
The asset quality data above (provisioning, delinquencies, nonperforming assets, net write-offs, etc.) relies on the JDCC 3Q23 interim filing details. We will update for 4Q23 disclosure when JDCC files the 10-K.
Deere boasts extremely strong asset quality in the context of finance companies broadly and captive finance operations more narrowly. The overwhelming base of financial assets are secured by liens on equipment with the exception of small revolving charge accounts.
The trend line for provisioning expense includes the actual annual rates for FY 2019 to FY 2022 but the annualized rate in 2023 uses YTD 3Q23. “Provisions” related to potential credit losses should reflect the much-enlarged base of earnings assets and potential for more erosion of credit quality from the very low base of credit losses seen in 2021-2022. We highlight the reversal of some of the provisioning allowance in the 2021 period.
The provisioning line for credit losses should rise with the size of the asset base. We will also see provisioning rise on normal cyclical pressures and as rising rates hurt borrowers. The mix of factors will lead to a rise in delinquencies, non-performing mix, and higher write-offs in 2024.
The steady weakening in asset quality metrics from a very high-quality starting point has been evident YoY but is not showing disproportionate moves in the context of pre-2022 levels. We would note that 2022 was a year of record farm income and materially improved performance in contrast to the pre-2020 lows when trade war retaliation hit the farm sector hard and required Federal bailouts.
The rise in delinquencies YoY noted at interim was modest and in line with 2019 levels with nonperforming assets rising in the mix but below 2019-2020 based on 3Q23 disclosure.
The trend line in write-offs is likely to remain negative with minimal net write-off rates rising sharply to rates that are still very low. For the 3 months ended 3Q23, we saw net write-offs in nominal terms multiply 5-fold YoY but only to 0.23% of receivables. For a company with Deere’s asset base, liquidity, and track record, rising write-offs can be easily absorbed.
The above chart covers some of the key capital allocation line items across capex and shareholder enhancement.
The trend line demonstrates the impressive financial flexibility of Deere in its ability to sustain a high rate of reinvestment while keeping the balance sheet strong and shareholders happy by returning cash in good times with buybacks and steadily rising dividends since the COVID crisis.
The $7.2 billion in buybacks during FY 2023 jump off the page with buybacks + dividends totaling $8.6 billion following all-time highs in Equipment operating cash flow in FY 2023 and $7.75 bn to $8.25 bn in net income. That cash flow, bottom line, and stellar Equipment unit balance sheet leave Deere a lot of room to maneuver as a strong single A tier name.
For 2024, Deere is guiding the market to $8.0 bn to $8.5 bn in Equipment net operating cash flow and $1.9 bn in capex, so Deere will be pressing its competitive advantages even in a year when the ag cycle will be weaker globally.
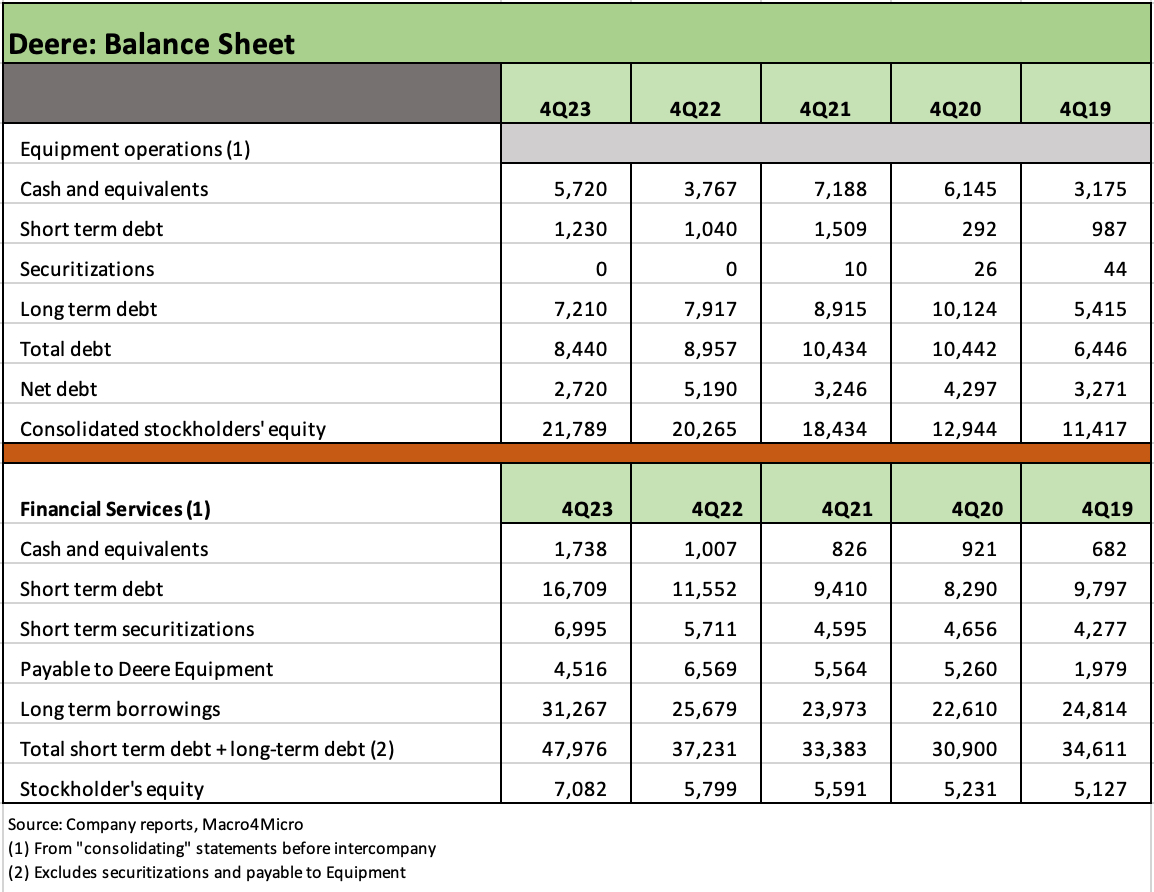
We detail the main debt line items for the Equipment and Financial Services operations above using the “consolidating” financial statement disclosure provided by Deere. We will review the major subset of JDCC disclosure after it files its 10-K. The “consolidating” disclosure lines for Deere’s financial services operations include more than the JDCC entity operations.
Deere’s leverage at the Equipment operations is relatively minimal, and the company’s financial flexibility is impressive. DE benefits from a range of refinancing alternatives that can be tapped against any cyclical or market backdrop as evident during the credit crisis and again during COVID. Both of those periods (2009 and 2020) certainly offer useful “real world” stress tests.
Equipment net debt/cap of 11.1% is very low based on high earnings retention and record results across this cycle with net debt/market adjusted capitalization of 2.5%.
Watching the captive finance operations of major global leaders such as Deere and Caterpillar can give some perspective on the health of some very important end markets (e.g., construction, farm belt) and offers important macro color on key regional economies. DE is one of the anchors of credit availability for major users of ag equipment.
While JDCC is a strong financing operation on a stand-alone basis, the ratings are tied to a support agreement with the parent company. The support agreement is “plain vanilla” in historical context with a fixed charge maintenance agreement and commitments to maintain majority ownership and positive net worth ($50 mn). That is a relatively standard support agreement in commercial paper backstop lines and one that the rating agencies and banks can rely on beyond the obvious qualitative factors that the operations of the parent and finance operation are inextricably intertwined.
The financial services balance sheet is typically around 8x leverage using that ratio of “total interest-bearing debt to financial services stockholder’s equity.” That 8 handle ratio is a sound balance sheet given the high-quality asset mix and parental ties. The finance units are a solid source of profits and a net asset to the parent.
We will update the 2023 pension profile of Deere when it files its 10-K, but the defined benefit plans were materially overfunded by around $2.7 bn in both 2022 and 2021. GAAP accounting allowed for a substantial revision of projected benefit obligations (PBO) lower in 2022 that offset the ugly negative returns on the asset portfolio. The 2022 pension year saw a doubling of discount rates that lowered the PBO by over $4.1 bn. The 2021 overfunding relied on an asset return boom that added $3.2 bn to the plan asset coffers.
Deere is a UAW-based hourly employer, and a new 6-year collective bargaining deal was reached in Nov 2021 after a 6-week strike (the first since 1986). Deere has a mix of pension plans across defined benefit and defined contribution plans.


