

We update the latest UST profiles as the UST rallies despite a spike in oil to $104 and rising CPI and PCE inflation. The FOMC held the line in October, and that might change in December (see Weekly UST Deltas: More Declines, More Inflation 10-31-26, PCE Sept 2026: Inflation, Income & Outlays 10-29-26, CPI Sept 2026: Does Chronic Inflation Need More Treatment 10-15-26).
We frame some timelines across the cycles from the Carter years through today, present various angles on the UST during the post-COVID ZIRP period, then across the sustained supply-demand imbalances that flowed into the Russia-Ukraine oil shock and ensuing inflation effects, and the eventual onset of high tariffs.
We still see mortgages above 7% and shorter rates that have driven up working capital costs for companies and retail financing costs for consumers.
In this commentary, we run through the UST curve collection as food for thought with a lot of inflation moving parts. The questions from skeptics are that a solid macro rebound could be creating some risks of ignoring a renewed CPI and PCE price threat and the FOMC waiting might backfire.
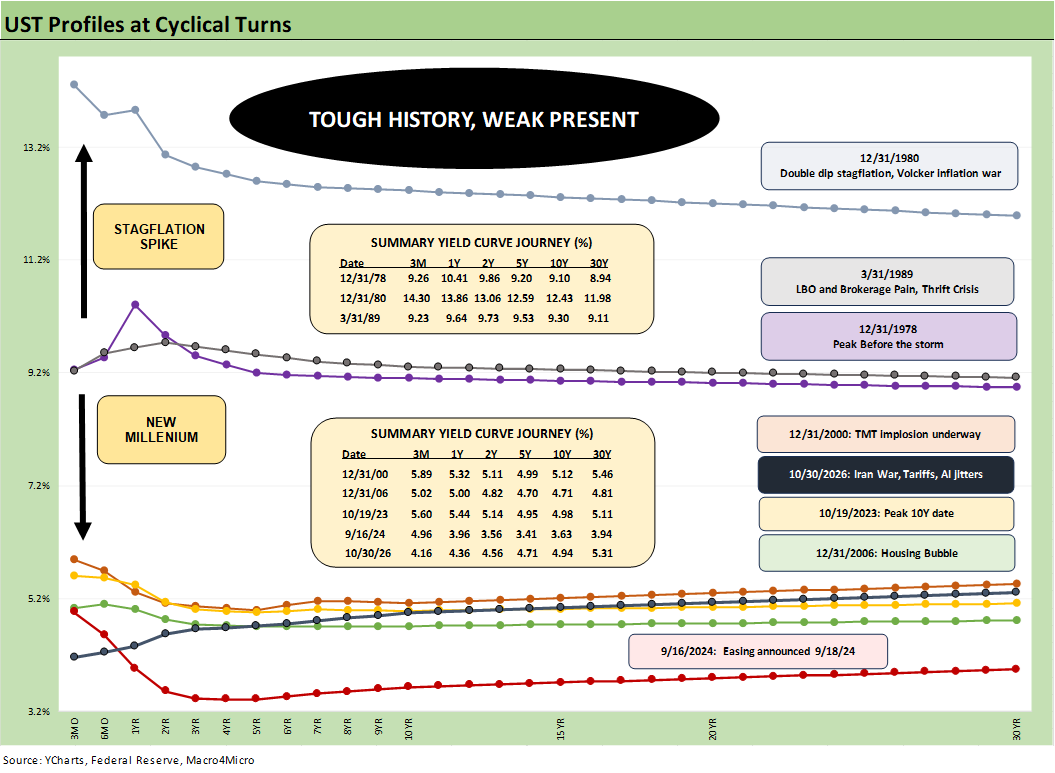
The above chart updates the journey from the Carter inversion peak of 1978 and into the 1979 inflation spike on the way to the 1980-1982 stagflationary double dip. That early 1980s period offers some “I walked to school in the snow” opportunities in the form of a 23% “prime plus” loan. The Misery Index was near 22% in June 1980 when I started working in NYC. That was a real problem. The 5% area 10Y UST and 7% mortgages are today’s muted version of pain.
The 1980 to 1989 period was a different world than what followed the Greenspan ease-a-thon in the early 1990s policy to support banks and once again a 2001 mega-easing to relieve consumer worries after the tech bubble imploded (see Greenspan’s Last Hurrah: His Wild Finish Before the Crisis 10-30-22, UST Moves: The 1990-1991 Risk Factor Pig Pile10-24-23).
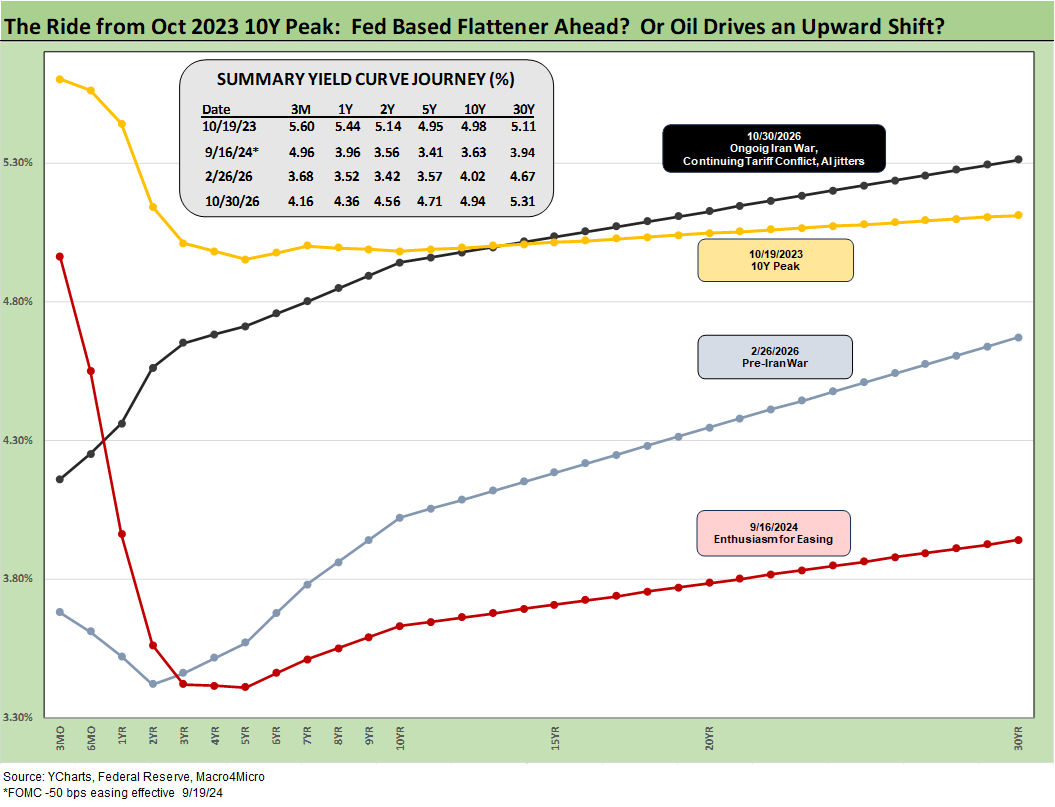
The above chart offers a more recent UST curve view that covers the Oct 2023 peak in mortgages as the 10Y UST briefly hit 5%. At that time, Freddie mortgages crossed above 7.6% while numerous mortgage surveys posted some 8% levels (see Mortgage Creep Continues, Curve Shapeshifting Uncertain 10-4-26, Mortgage Rates vs. UST Curves: Spooky Memories to Ponder 9-20-26).
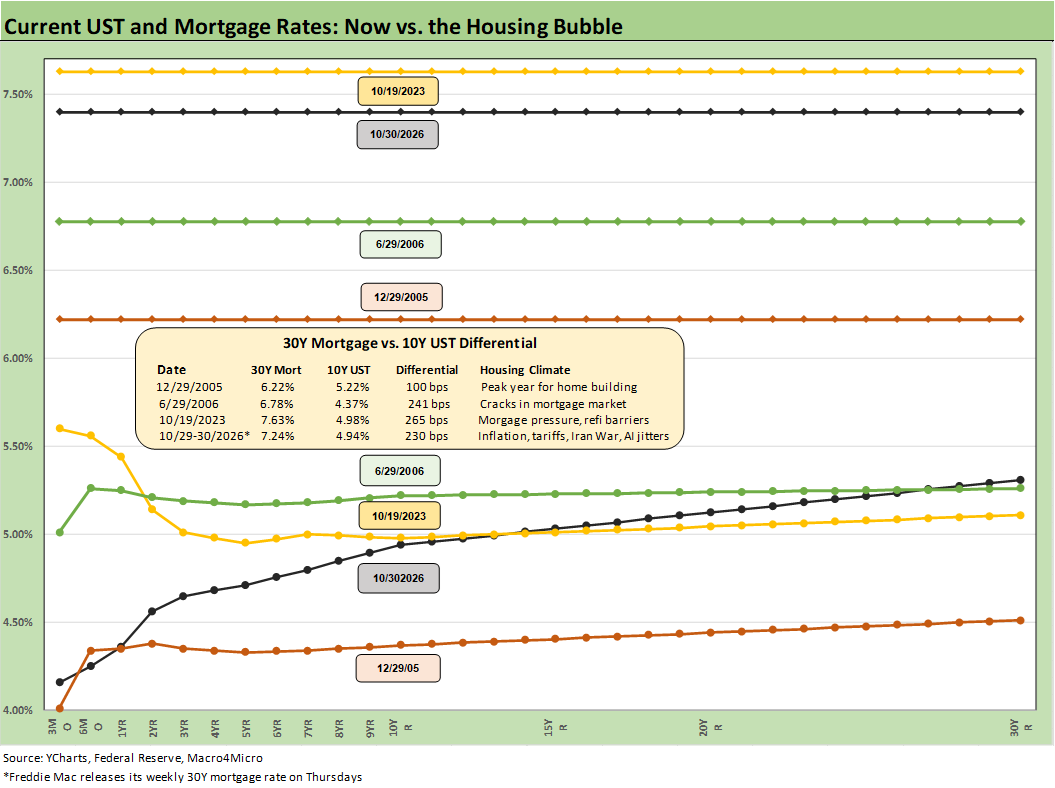
The above chart updates some mortgage rates during recent periods and some others against the housing bubble. These include the peak homebuilder year of 2005 and mid-2006 as the RMBS quality problems were surfacing and raising some alarms.
The Freddie vs. 10Y UST differential still flags some risks relative to the Oct 2023 differential. The FOMC tightening potential and risks of more inflation setbacks ahead could challenge the ability of the UST to sustain this latest rally. That is, unless the AI backdrop gets worse and we see more equity volatility that flows into capex reassessment and ripple effects into GDP growth doubts.
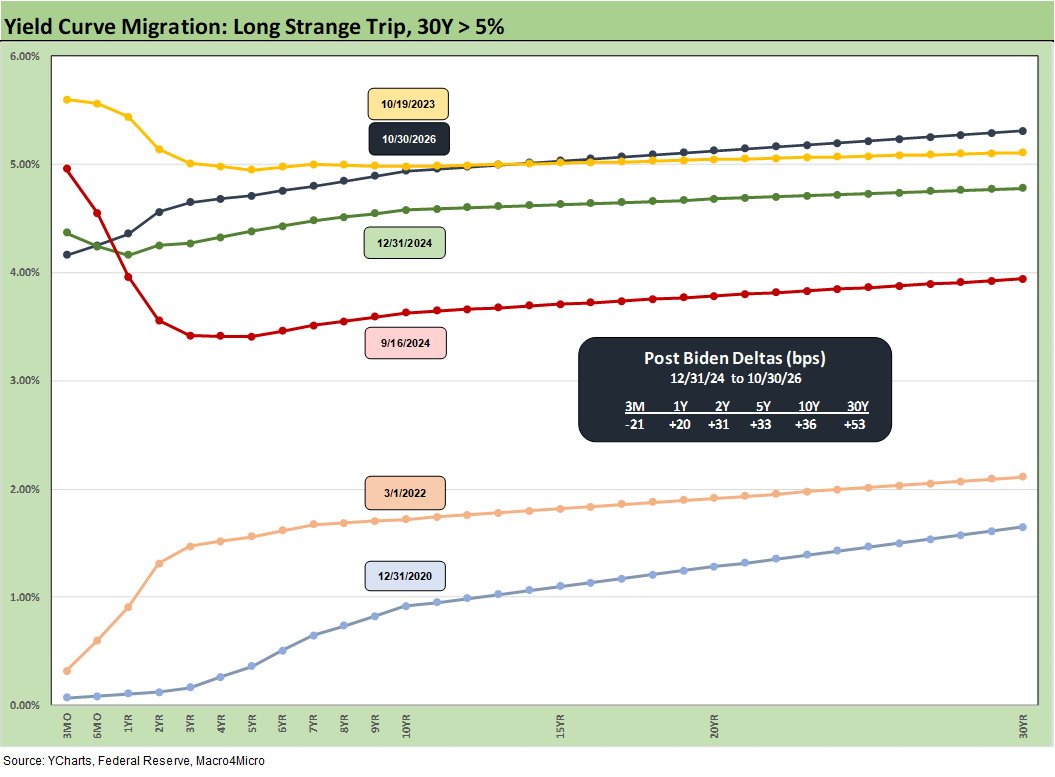
The above chart offers another angle with the migration from 2020 to the start of March 2022 just ahead of the end of ZIRP. We then make the big jump to Oct 2023 at the top when the 10Y and 30Y mortgage saw an earlier cyclical peak before the latest migration in 2026 sent mortgages back above 7%.
The 9-16-24 UST curve came after the UST rally and was just ahead of the start of the easing cycle in 4Q24. That in turn led to an upward move and sharp 2025 bear steepener (see The Curve 12-15-25).
The above chart adds some more information content to the journey from 2020 with the “memory boxes” detailing the hiking and easing cycles.
UST delta timelines…
The following charts update the UST deltas across 2026, which has been a very busy year with the Iran War effects.
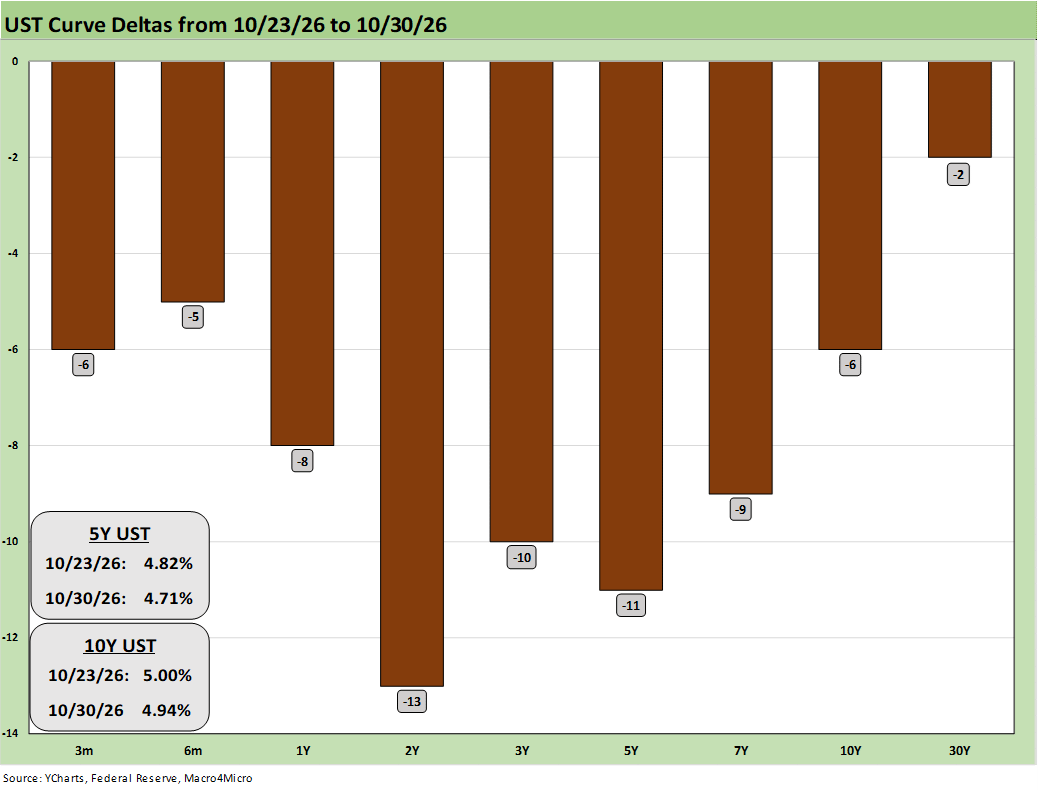
The above chart updates the weekly change in UST in the form of a bull steepener from 2Y to 30Y. We already posted a commentary on the 1-week move in the curve earlier.
See Weekly UST Deltas: More Declines, More Inflation 10-31-26.
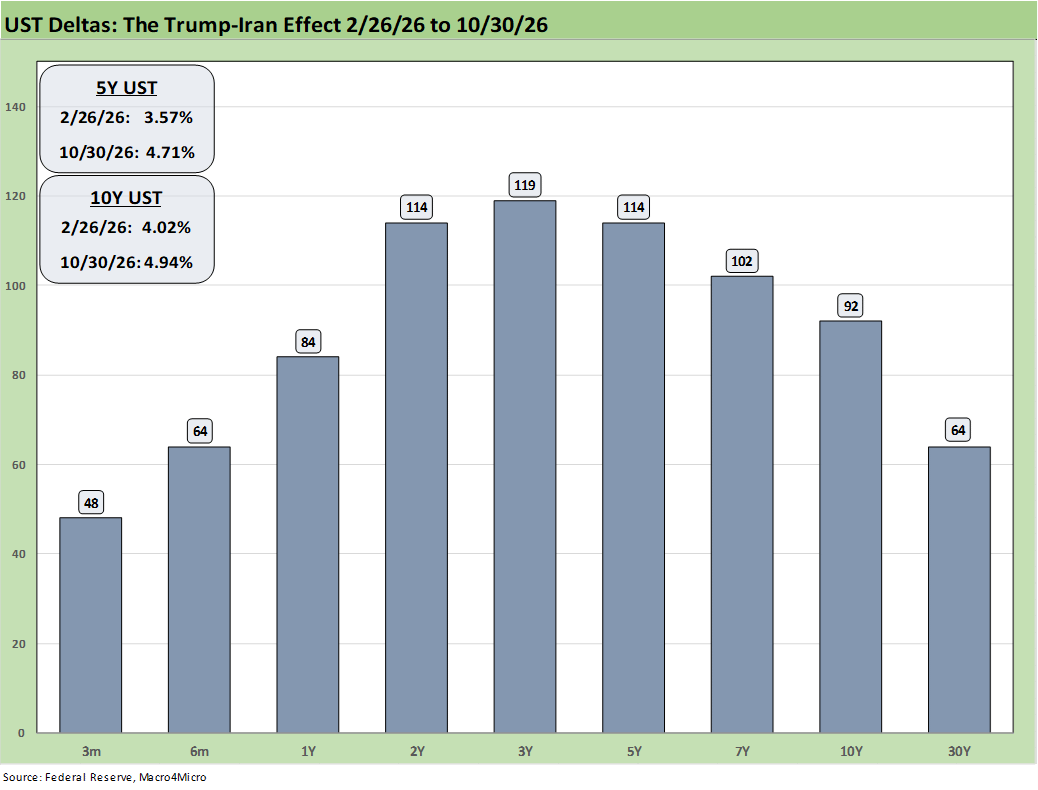
The post-Iran UST deltas quantify the pain delivered to the markets and the economics of borrowing caused by the ill-advised and badly mismanaged Iran War strategy. The Iran War could make a future update of the March of Folly necessary if Trump escalates further after the election (as he has pledged). It takes a lot to qualify for that list of wars and needs to be on the level of “multi-generational dumb.” He is working on it.
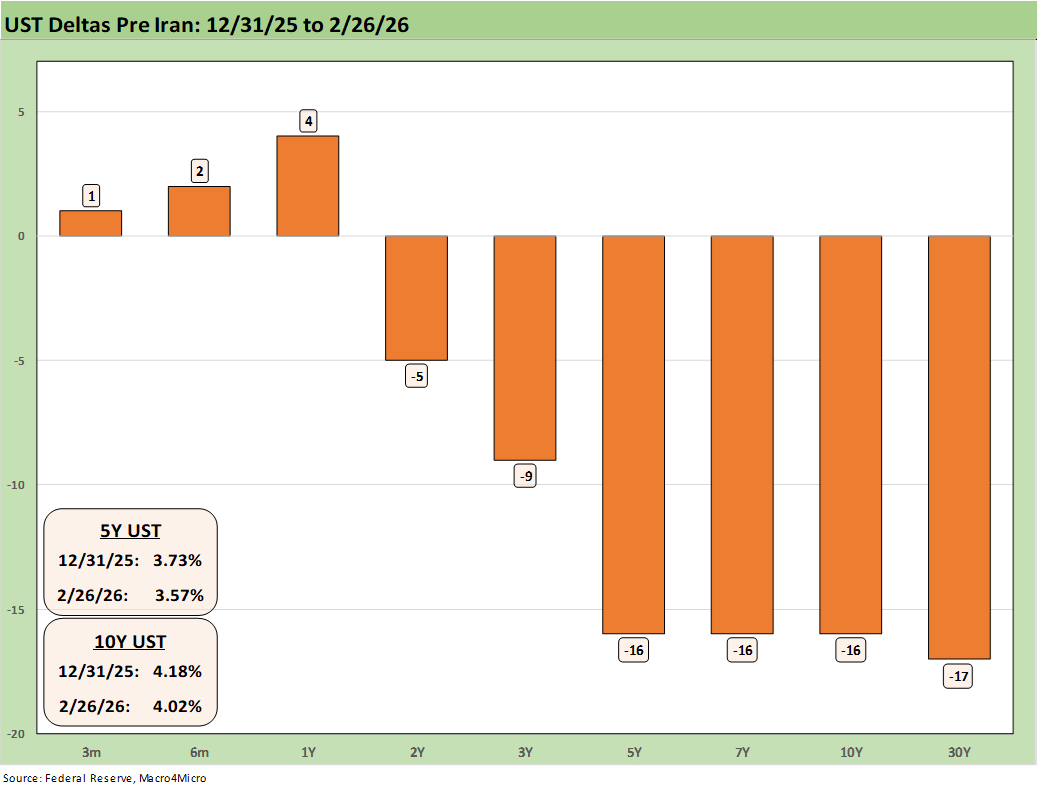
Just to rub it in, the above chart details the UST deltas in the YTD period before the Iranian bombing. The market was shaping up as a bull flattener with some even seeing room for FOMC easing. That ship sailed.
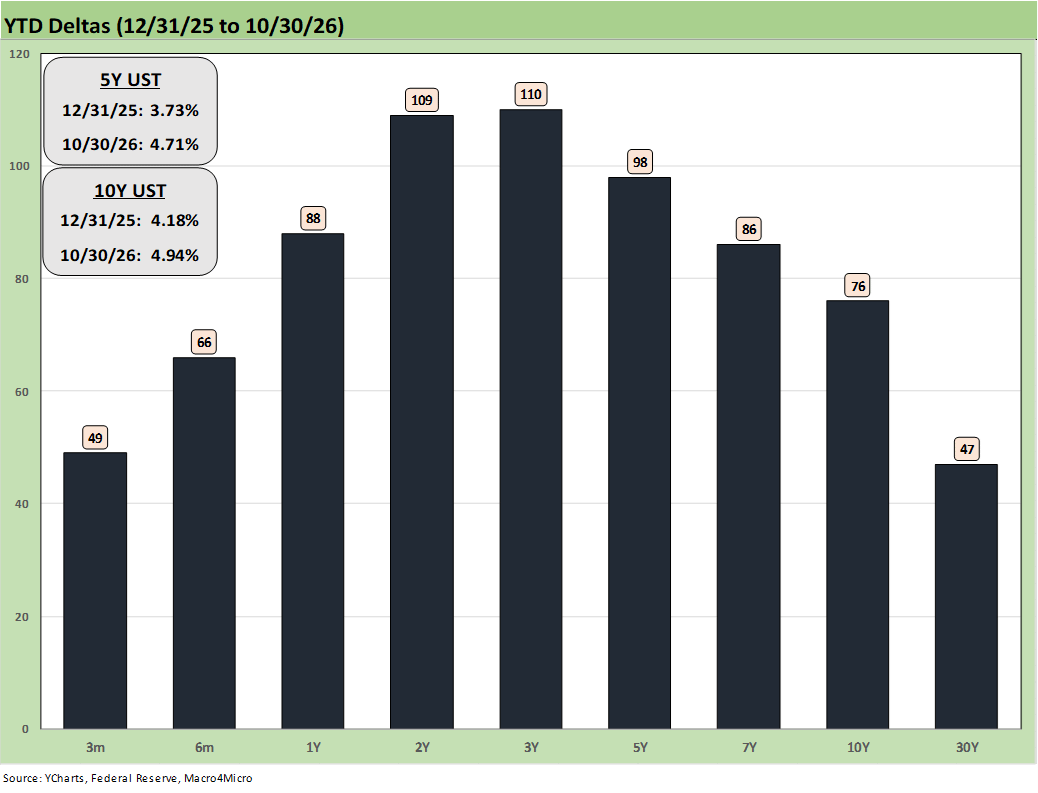
When the smoke cleared on the events of 2026 YTD, this is where the UST deltas stand as of Friday. There is a lot more to come in policy decisions and the moving parts of inflation, asset allocation and government deficit funding needs. The election results will certainly factor in ($5,000 checks anyone? Iranian escalation and more energy inflation?) Stay tuned.