

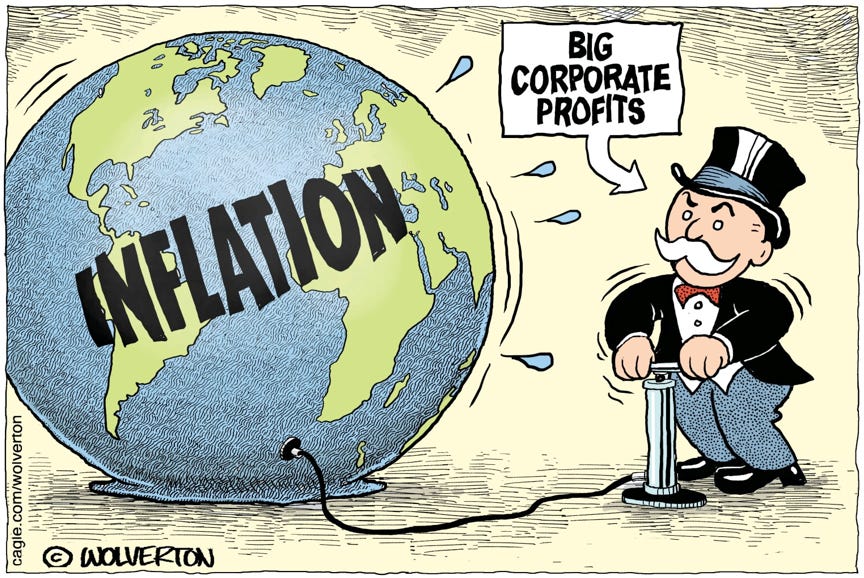
The PCE inflation story tells another cautious tale in September with the UST curve action and the strong 3Q26 earnings sending markets in all directions with some reactions that might seem surprising. With inflation rising and macro demand fundamentals strong as seen in today’s 3Q26 GDP release, the UST rally looks more tied to AI worries and growth questions into 2027 (see 3Q26 GDP: Happy Days? 10-29-26).
The UST curve increasingly appears wagged by a spreading AI neurosis with inflation moving higher and oil still in triple digits. Today saw another tech smackdown with Alphabet down over 13% as go to print. Caterpillar also was getting slammed as a construction proxy. The UST curve is registering mixed emotions as it digests equity market volatility and a new round of FOMC handicapping after this week’s 10-2 vote. As we go to print, the odds of a hike in Dec stand at 79.6%, which interestingly is down from 84.6% over the past day since the FOMC meeting.
The PCE inflation data today was without question unfavorable, coming in north of 3% with 3.6% headline and 3.1% core. The release featured a +21.3% YoY inflation rate in Energy Goods and Services that was up from 16.9% in August and only exceeded in the post-Iran period by May’s 23.7% (Table 2.8.11). Goods at 3.9% and Nondurables at 4.5% made for bad news as was Services at +3.5% YoY. PCE ex-Energy and Housing posted 3.6%. The balance of adverse moves in the MoM lines were also unfavorable (Table 2.8.7).
The relationship of current dollar Personal Consumption Expenditures for the month showed PCE higher than Disposable Personal Income (DPI). The consumer was outspending income with MoM PCE at +0.5% vs. current dollar DPI of 0.2%.That took the savings rates down to 3.8% in Sept from 4.0% in Aug and 5.6% in Jan 2026 to start the year.
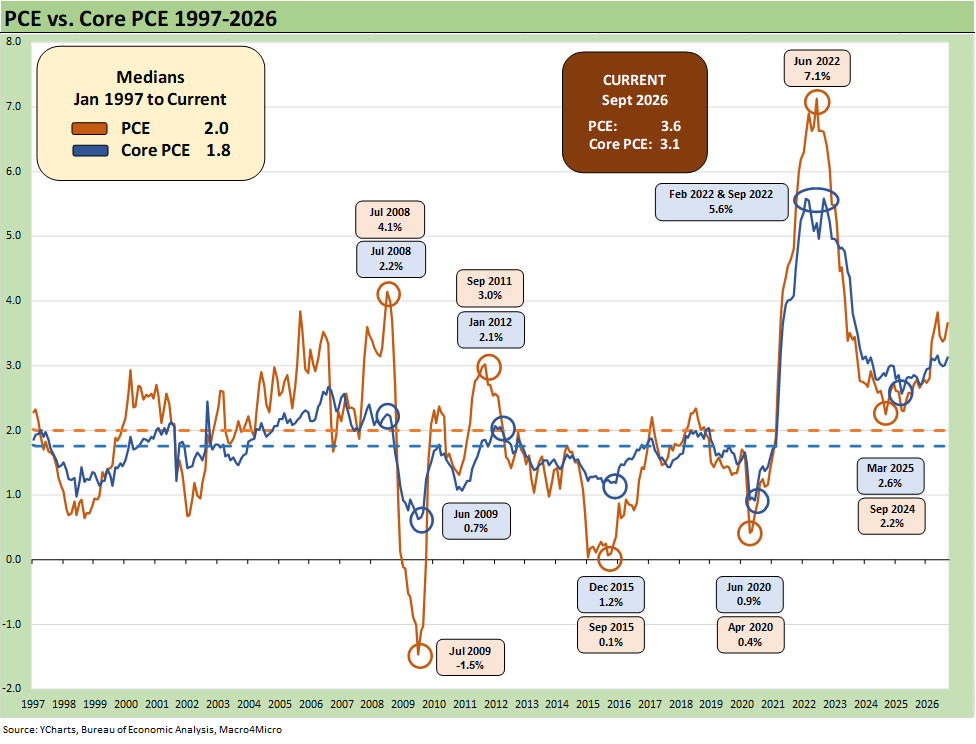
The above chart updates the running PCE inflation history with Sept 2026 weighing in at 3.6% headline and 3.1% core. Both are above the recent hourly wage growth rate of 3.0% that is reported each month with the payroll report. We will get a fresh wage growth number next week. For now, we are talking about negative real wage growth in a year with higher inflation and an Election Day next week. That negative wage growth looks even worse for many households that have a more costly “household basket” of goods and services (long commutes and heavy gasoline use, high home heating oil exposure, reside in an expensive metro area, etc.)
Target of 2.0%?
The 1997-2026 timeline we plot offers a useful frame of reference on the PCE target of 2.0% routinely discussed by the Fed and the markets. The shorter timeline from 1997 offers a better visual scale separate from the wild 1970s and 1980s. This chart is a replay we turn to when we hear the 2% target discussed (which is every FOMC meeting).
The 1997 to 2026 period presents a rare stretch at or below the 2.0% PCE inflation line and the same for the Core PCE median as noted in the chart. It took a lot to go wrong in that time horizon at the systemic level and in terms of macro shocks cross below or reach that 2.0% threshold.
The events along the way included tech bubbles bursting in 2000-2001; oil crashes in the late 1990s and in the late 2014 to early 2016 period; and a bank system crisis from 2008 to 2011 (including sovereign stress) to get us there. The COVID pandemic in 2020 was a new one for the modern capital markets.
That constitutes “2% the hard way.”
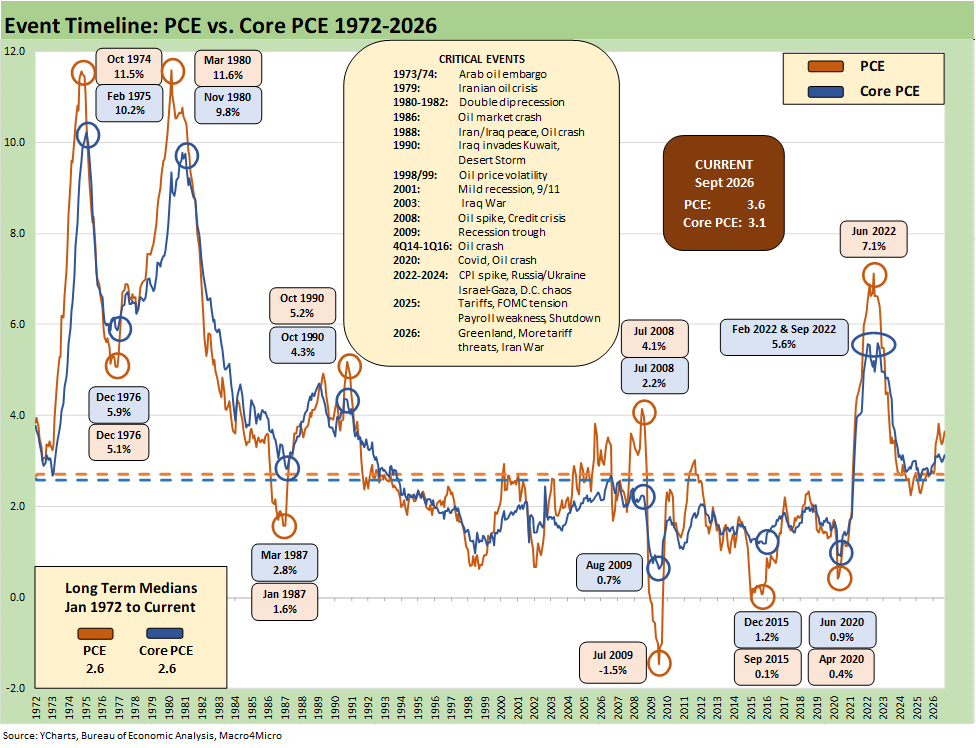
The above chart updates the long-term time series from 1972 for PCE vs. Core PCE across the decades and cycles. We see the 2.6% headline PCE long-term median in the lower left (well below the current 3.6%) and the 2.6% Core PCE median (vs. the current 3.1%).
The 2026 mini-peak 3.8% (as revised) for PCE headline in May 2026 was dramatically better than where we came from in June 2022 at 7.1% PCE.
In the context of 2025-2026, the headline PCE price index was 2.7% in Jan 2026 and was 2.6% to start Trump 2.0 before the ensuing moves higher. It is clearly higher (that is a fact). Iran was the dagger in the lower inflation story after 2.8% in Feb 2026 on the way to the rise above the 3% line to 3.8% in May 2026.
The energy shock, tariffs, and the various materials and commodities turmoil (aluminum, copper, etc.) are flowing into a range of PPI, Goods, and Services lines as the effects reverberate. Oil and downstream effects are pervasive across the economy with the downstream refined products such as diesel grabbing headlines.
The diesel damage is broad based, but that also comes ahead of what could be some less pervasive home heating oil challenges with colder weather ahead. Home heating oil in New England will likely total more than $1,000 higher for the typical household with a normal winter. Maine has one of the highest heating oil shares in the country at around 50%. New Hampshire (over 30% home heating oil) is getting hit hard also. Collins (Maine) and Sununu (New Hampshire) are facing an election with some unhappy voters.
As someone who grew up with home heating oil in Massachusetts, those big bills for filling up early in the season can take a major bite out of household cash flow. It is not like a quick gas station trip off the highway. It might cause some mood shifts ahead of Election Day. It is hard to get through the winter on a single 275 gallon tank.
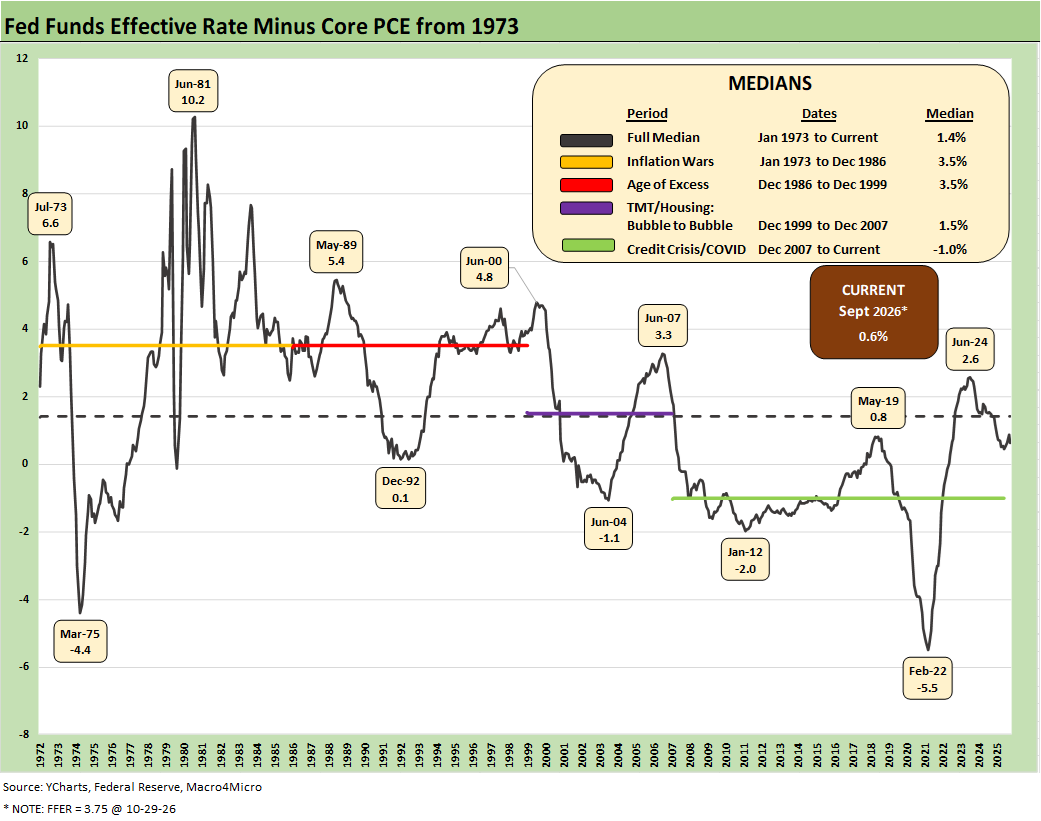
The above chart frames the timeline for “Effective Fed Funds minus Core PCE.” For this latest July measure, we see the differential at +0.6% vs. the long-term median of 1.4%. The current differential is not much of an inflation deterrent. A slight uptick in inflation with the easing demanded by Trump could take the market back to negative real fed funds. That is not much of an inflation fighter.
If one sees inflation moving higher and demands from the White House to take rates lower, historical policy will have been scrapped and inflation discipline abandoned.
The market awaits the Dec 9, 2026 FOMC meeting and what comes next for inflation between now and then. A major Iran escalation would not help.
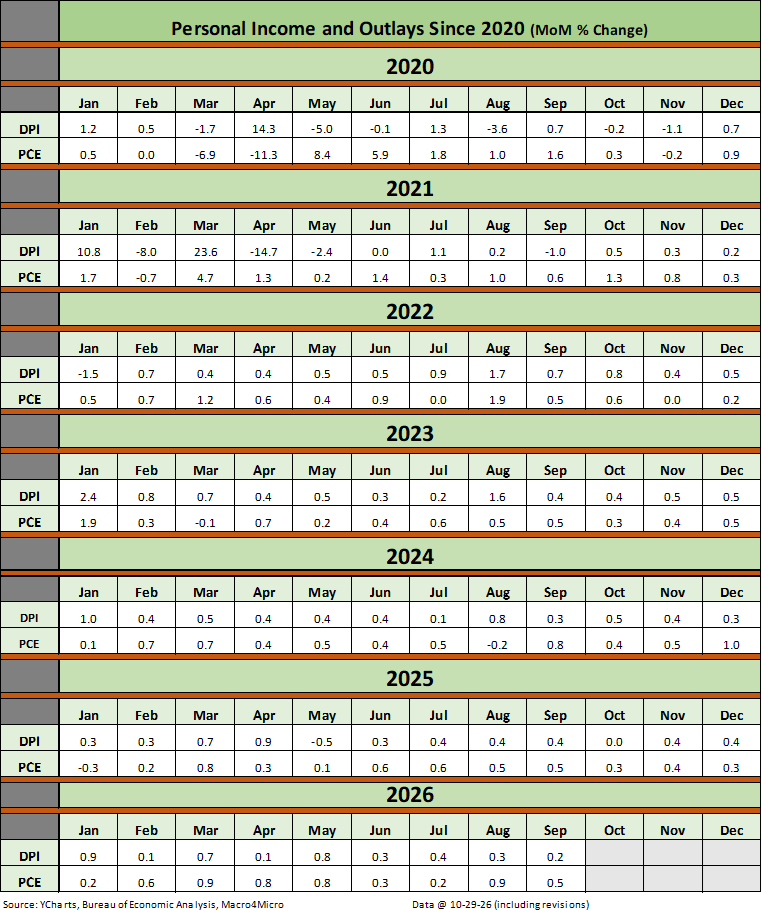
The above table plots the monthly Disposable Personal Income MoM change numbers vs. the Personal Consumption Expenditure MoM numbers across the years from 2020 through Sept 2026. We include a wave of 2026 revisions. It is an easy scan across key time periods for a look at turning points in DPI (e.g. stimulus payments) or PCE. Sept posted a muted move in DPI vs. a more ambitious move in PCE.
Hassett should probably peek at the dramatic monthly moves in April 2020, January 2021, and March 2021. Or he can hire someone to generate a few charts that directly contradict much of what he says. Trump had his signature on 2 of those 3 DPI spikes. Biden tried to get his name on another one but was blocked. Everybody had their fingerprints on the demand turbocharger at a time of severe supply constraints, and that is even without citing the Russia invasion of Ukraine (which Team Trump never cites…instead just repeating, “Biden’s fault” over and over).
Note:
The following is a recurring commentary we roll forward for new readers and students on the history of the COVID relief and stimulus plans and how that rolled into inflation. Please skip this section if you have read it before. The lies and distortion never go away when talking heads in political circles or related media do their soundbite specials.
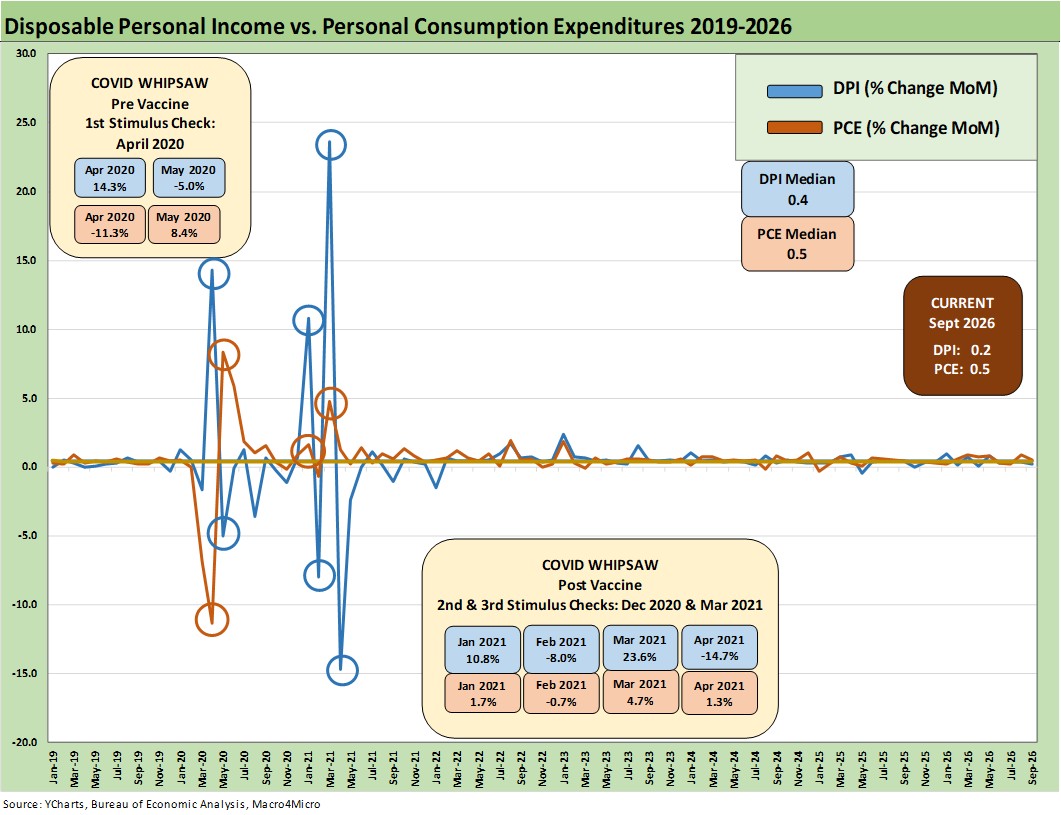
The above chart is a “replay chart” we include in periodic updates as a reminder that political theme-spinning out of Washington on economic cycles and inflation are usually stacked with selective memories, false statements (aka self-serving lies), material omissions, and conceptually anorexic storytelling (like “seller pays the tariffs” and sometimes even “selling country pays the tariff.”).
The chart updates the trend line in disposable personal income (DPI) vs. personal consumption expenditures (PCE) that we get with each monthly PCE release. We like updating this chart occasionally to offer a reminder of what really happened during the wild days of 2020-2021 given the waves of disinformation from the current administration. It is currently a “quarter end” just ahead of an election, so we update it for this month.
Revisionist history is one thing, but it is good to challenge gross falsehoods and misstatements with facts and history.
PCE growth vs. DPI…
When PCE growth exceeds DPI growth (or negative DPI), as we often see, one conclusion is that many consumers are feeling good (i.e., ignore the sentiment metrics). Or perhaps they are tapping credit cards by necessity (e.g. the PCE could include outsized health care premiums put on their credit cards?).
We have been watching the rate of ACA dropouts and premium increases and the shift to higher deductible plans. Health care is a mess and not clearly captured in the headline data. Health care insurance is cited as deflation under the CPI methodology (ponder that one!) It all adds up to less cash flow at the household level, more borrowing (in some cases), and zero-sum effects on other outlays. Any softening PCE numbers in the GDP updates would tell a story on the cycle.
We saw trouble in personal consumption in 1Q26 (see GDP 1Q26 Final: PCE Growth Plunge 6-25-26). As detailed in 2Q26 and 3Q26 GDP, we are seeing a rebound (see 2Q26 GDP: Good Underlying Numbers Despite Headline 1.5% 7-30-26, 3Q26 GDP: Happy Days? 10-29-26).
The stimulus overload of 2021…
Talking heads in Washington will “play pretend” around what happened in the COVID tunnel of 2020-2021 and what unfolded coming out of that tunnel. There were a lot of structural imbalances and supply-demand dislocations for the economy to absorb.
The 2021 period was a big macro rebound in GDP off the COVID peak period. The strong macro backdrop in 2021 and heavy dose of fiscal accommodation did not mesh well with residual supply-side shortages in goods broadly as 2022 saw the end of ZIRP and a material inflation spike ensued.
Oil was a problem after the Putin invasion of Ukraine in late Feb 2022, and inflation hit a high in June 2022 at +9.1% for CPI as a headline grabber (headline PCE at +7.1% in June 2022) before the steady inflation slide to under 3% by the end of 2024. Core PCE had dueling peaks at +5.6% for Feb and Sept 2022.
Try to get Team Trump to even mention the oil price spike in 2022 as a factor in the 2022 CPI numbers. The questioning on the topic by mainstream media is also lame. The CNBC team does not push such Q&A since they are looking to take GOP interview share away from Fox. They need the GOP guests to keep coming back. Tough questions don’t help that priority.
The COVID relief binge…
The above chart plots MoM Disposable Personal Income vs. PCE and offers a read on how wild things got during and right after the pandemic peak. The DPI swings highlight the effects that came with the three COVID relief/stimulus packages. That included two COVID relief bills under Trump and one under Biden.
As a reminder, Trump signed the CARES Act in March 2020 (shows up in the DPI in April 2020) and Trump also signed the Dec 2020 legislation disbursed in Jan 2021 (Trump seldom mentions that Dec 2020 one since it is easier to blame Biden and Powell). Biden signed the America Rescue Plan (disbursed in March 2021) that was a demand pile-on (we would argue it was over the-top-stimulus) in a supply-constrained environment (thus inflation). The DPI and PCE wave tied to each of those shows up in the chart above.
As a reminder, the COVID vaccine was announced in early Nov 2020 just ahead of two stimulus actions. That was soon to be a factor in PCE patterns and lag effects. The quarterly GDP numbers in 2021 on the post-COVID bounce were numbers generally not seen since the Reagan and Clinton years (see Presidential GDP Dance Off: Clinton vs. Trump 7-27-24, Presidential GDP Dance Off: Reagan vs. Trump 7-27-24).
COVID was a distinct period for supply chains and supply-demand imbalances. With tariffs and potential trade wars, it will remain important to look for similar imbalances whether in narrow product categories or in broad commodities and materials areas. We clearly face some supply pressures in the post-Iran period for oil and gas, refined products, fertilizers, aluminum, and numerous other inputs generating headlines (helium, sulfuric acid undermining copper production). Some shortages also undermined military readiness.
Tariffs, unit costs, and pricing decisions…
In terms of tariffs, the major trade partners have not initiated much in retaliation with the exception of a brief China spat. Canada only recently fought back and set off a fresh trade clash. A “peace at all costs” strategy by the EU and USMCA partners had mitigated the damage, but that de facto submission could come back to haunt some major trade partners if other leaders run for office with a “get tough on Trump” election pitch. Caving in to Trump on tariffs is getting less popular in the EU and Canada. Trump is also pushing his luck after Iran in attacking allies on trade. The USMCA is likely to die a cruel death. That lies ahead.
Jacking up aluminum, steel, and copper on the materials side and seeking even more tariffs on lumber was not and is not a great idea for keeping prices and costs contained. Auto tariffs under Section 232 are extreme even after the array of “deals” and could go higher if the USMCA fully breaks down into 2027.
We saw semis, pharma, and aircraft/engines/parts added to the Section 232 pipeline although most of the aircraft/parts risk was mitigated in EU talks. EU talks are always on the ledge, and Trump makes routine threats. Other actions brought in commercial vehicles, branded pharma, cabinets, and a range of targets on national security grounds including upholstered furniture (seriously, upholstered furniture).
The most important development in the tariff area was the SCOTUS decision on IEEPA. Trump then launched tariffs under Section 122 laws that had a “game clock” and initiated more Section 301 actions (unfair trade) to maximize his flexibility with Section 232 (national security) also in the playbook. He has already been hit with setbacks in court. Trump’s goal is tariff revenue maximization for his discretionary deployment and not economic efficiency.
Trump’s latest gambit uses a Smoot Hawley (1930) provision (Section 338) that allows him to use legislation on the books without consulting Congress. Smoot Hawley is viewed in most circles as one of the most self-destructive pieces of legislation in US history.
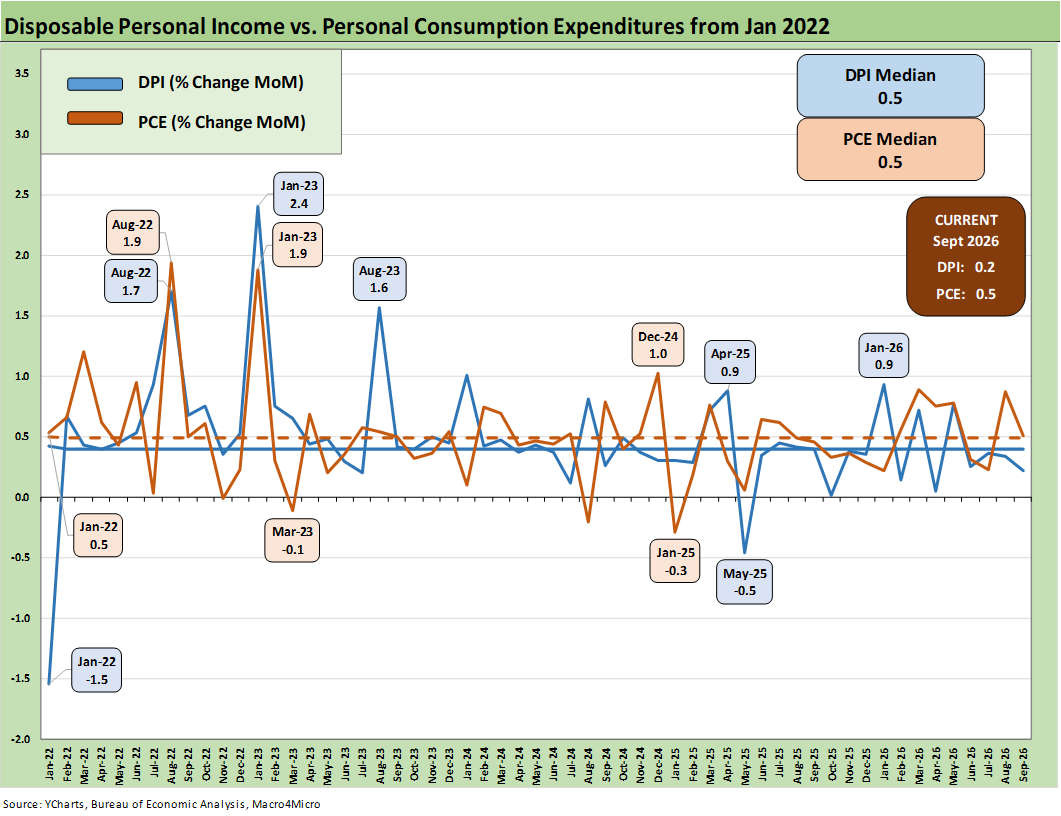
The above chart covers the time horizon for DPI vs. PCE from early 2022 as the tightening cycle kicked into gear after March 2022. Life in Jan 2022 was still quiet for Disposable Personal Income relative to the chaos of 2020-2021.