


“Maybe we should have skipped the Sunday shows on the grounding…”
We update the running timeline returns after a period of volatility in the AI ecosystem trade and along the UST curve.
As we move toward the home stretch of the year with a few potential air pockets ahead, 2026 appears likely to end as a very good year for equities – but not a great year – while bonds are heading toward a bad year.
The tech rally of the past week after some weeks of AI ecosystem turmoil offers a reminder that record revenues, pre-capex cash flow, and backlogs do not simply disappear into the arms of a Chinese spy. The risk of de facto credit contraction (loans, leases, third party guarantees, vendor financing etc.) will be a risk to watch.
The election beatdown changes the rules of the game for January and beyond, and a behavioral forecast for the White House will be easier than what to expect in Congress. The opportunity to “force votes” on critical economic issues such as tariffs and healthcare could bring macro tailwinds – in theory.
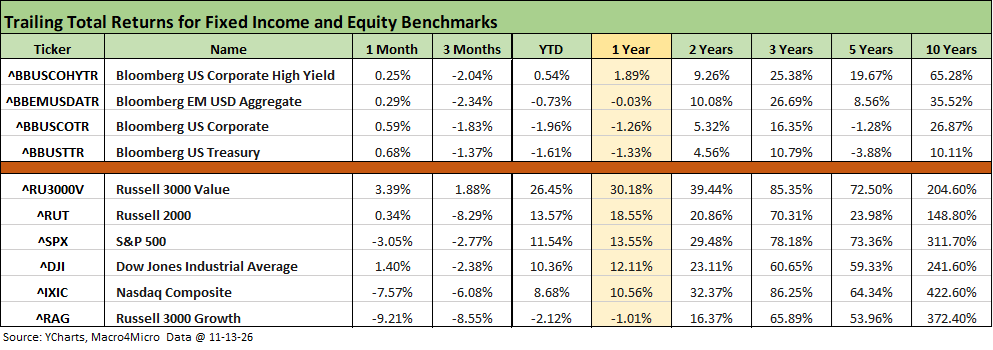
The above table updates the running returns for the bond and equity benchmarks we monitor. The rally in UST earlier in Oct was followed by this week’s spike along the UST for positive 1-month returns (see Market Commentary: The UST Curve 11-14-26). The 3-month bond returns show 4 bond ETFs in negative territory. This past week was an ugly one for duration that comes after what in many ways was a counterintuitive UST rally period that saw lower rates despite higher oil and high inflation (see Weekly UST Deltas: More Declines, More Inflation 10-31-26).
The 3-month returns show all 4 bond benchmarks in negative range on a mix of adverse UST moves and in some cases spread widening with HY OAS moving more than 50 bps wider over the time horizon. HY spreads are still dramatically inside longer term medians.
Equity benchmarks have had a rougher ride on AI ecosystem volatility and notably wild swings in semiconductors the past few months. The recent AI stock beatdown gave way to a material rally this past week (See Weekly Asset Returns: Tech Check 11-15-26). We look at the narrower mix of ETFs and some single names further below.
We see 5 of the 6 equity benchmarks in negative range over 3 months. The Russell 3000 value index at +1.88% stands out relative to growth benchmarks.
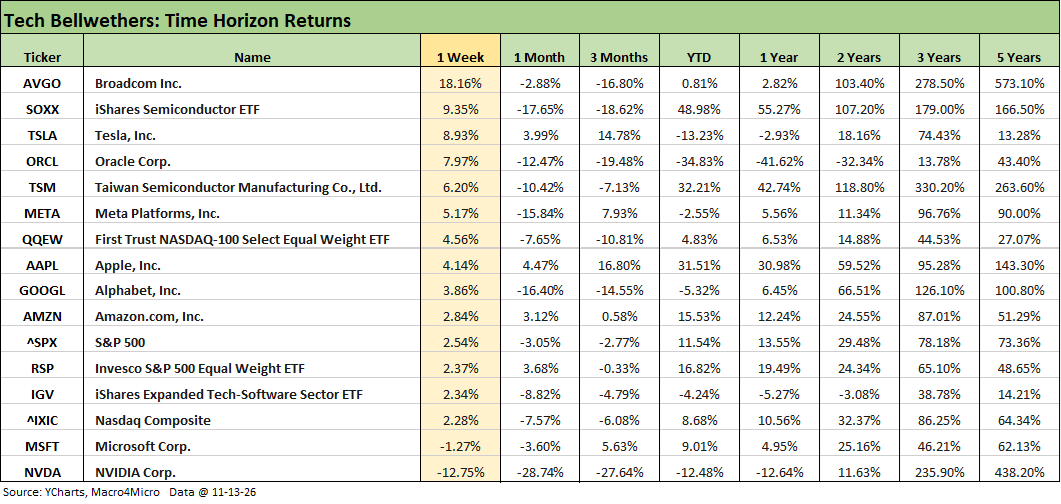
The tech bellwethers and benchmarks had a rebound week with only NVIDIA (NVDA) and Microsoft (MSFT) in the red. Broadcom (AVGO) was well out in front at +18.16% for the week with the Semiconductor ETF (SOXX) a solid #2 at +9.35%, well ahead of the Software ETF (IGV) at +2.34%.
We highlight the +49% YTD return on SOXX in the chart that comes even after the latest headline turmoil. The IGV YTD return is -4.24% as we have covered along the way with software/SaaS names lagging. We cover that in more detail below in the Tech Check YTD results.
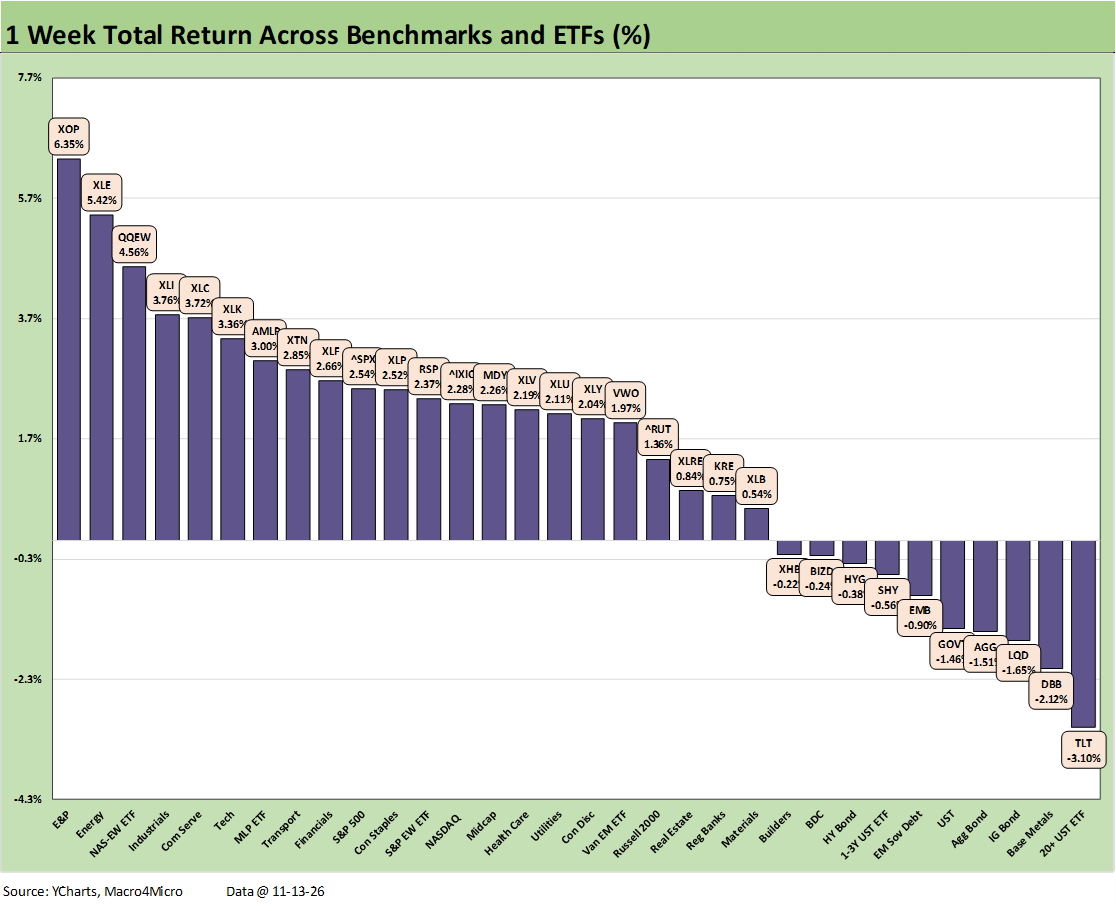
We already covered the 1-week returns for the broader mix of 32 benchmarks and ETFs. See Weekly Returns: Benchmarks and ETFs 11-14-26.
The 22-10 positive vs. negative score made for good news, but the UST shift left all 7 bond ETFs in negative range with the long duration UST ETF (TLT) in last place. Energy placed 3 ETFs in the top quartile with Tech-heavy ETFs also performing well.
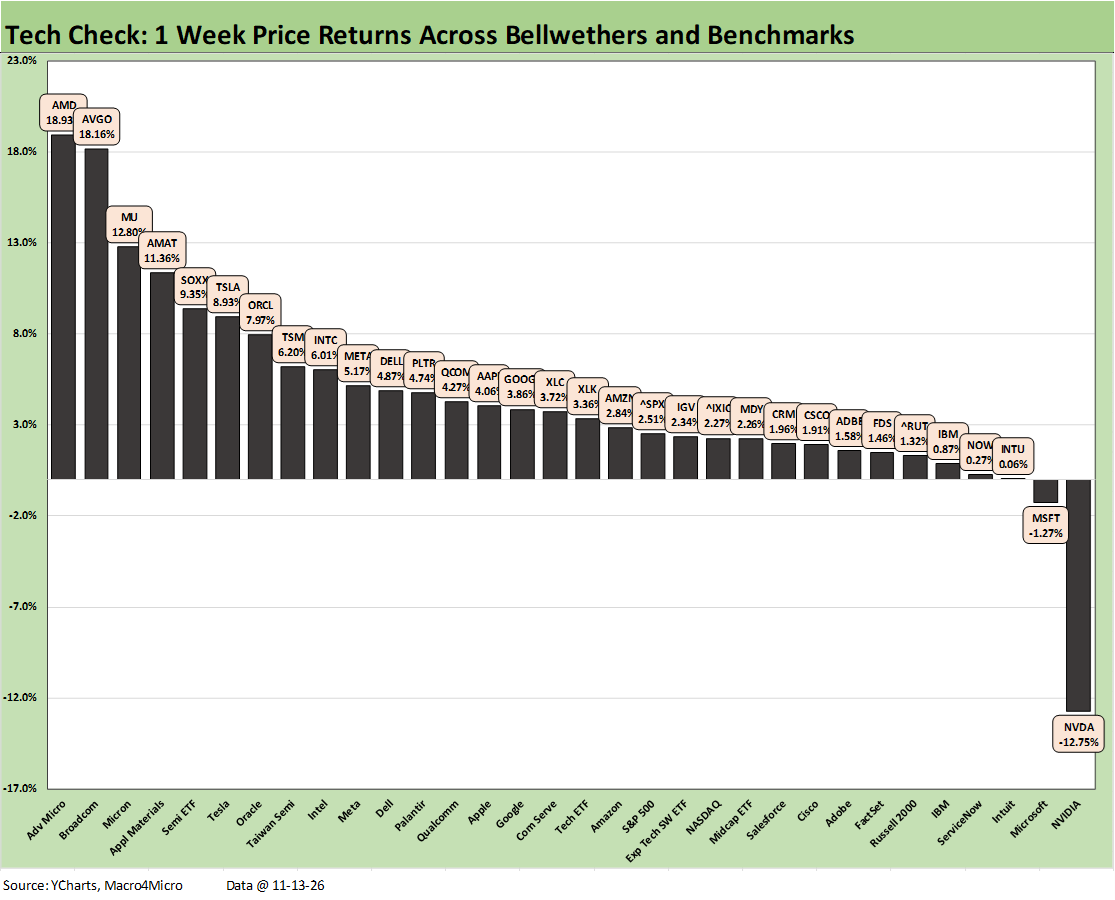
We already covered the 1-week returns for the Tech Check mix of benchmarks, ETFs, and single names. See Weekly Asset Returns: Tech Check 11-15-26.
The 30-2 score saw semis dominate with NVIDIA the outlier in last place.
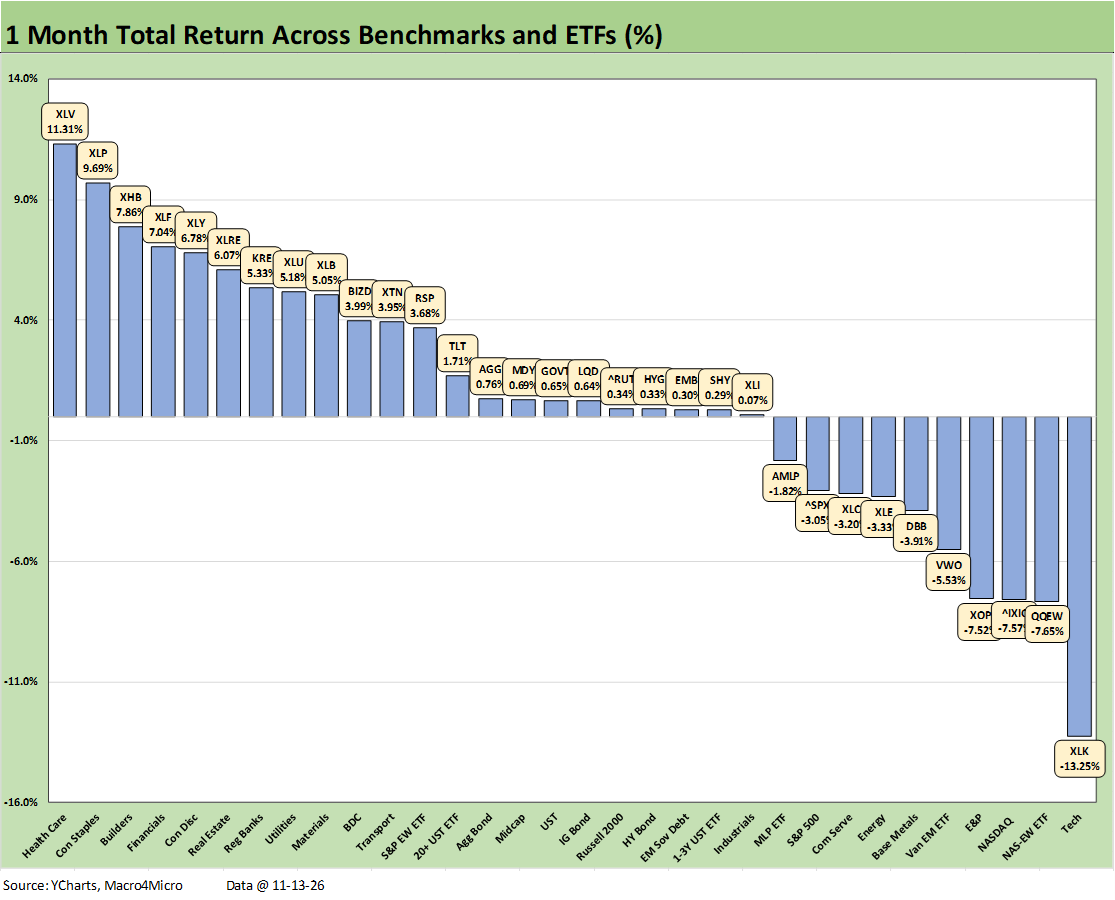
The 1-month score was 22-10 for the broader mix of benchmarks and ETFs. The Hi-Lo range for the month was a lofty 24.6 points with the Tech ETF (XLK) on the bottom and defensive Health Care ETF (XLV) on the top.
The top tier saw defensive and higher quality, dividend focused ETFs in the mix. That included Health Care (XLV), Consumer Staples (XLP), and Utilities (XLU).
Rate sensitive equities (XHB, XLRE) made the top tier for 1-month on the earlier UST rallies despite the brutal UST shift this past week (see Market Commentary: The UST Curve 11-14-26).
Financials (XLF, KRE) made the top tier after a good earnings season that reaffirmed the market consensus that asset quality risk is sound at this point in the cycle.
The 7 Bond ETFs we monitor were all positive but with minimal returns clustered around the median sub-1% return level on the chart.
The bottom tier was diverse with tech-related ETFs in the bottom 3 joined by some energy and commodities names. In energy sectors, E&P (XOP), Energy (XLE), and Midstream were all in the red.
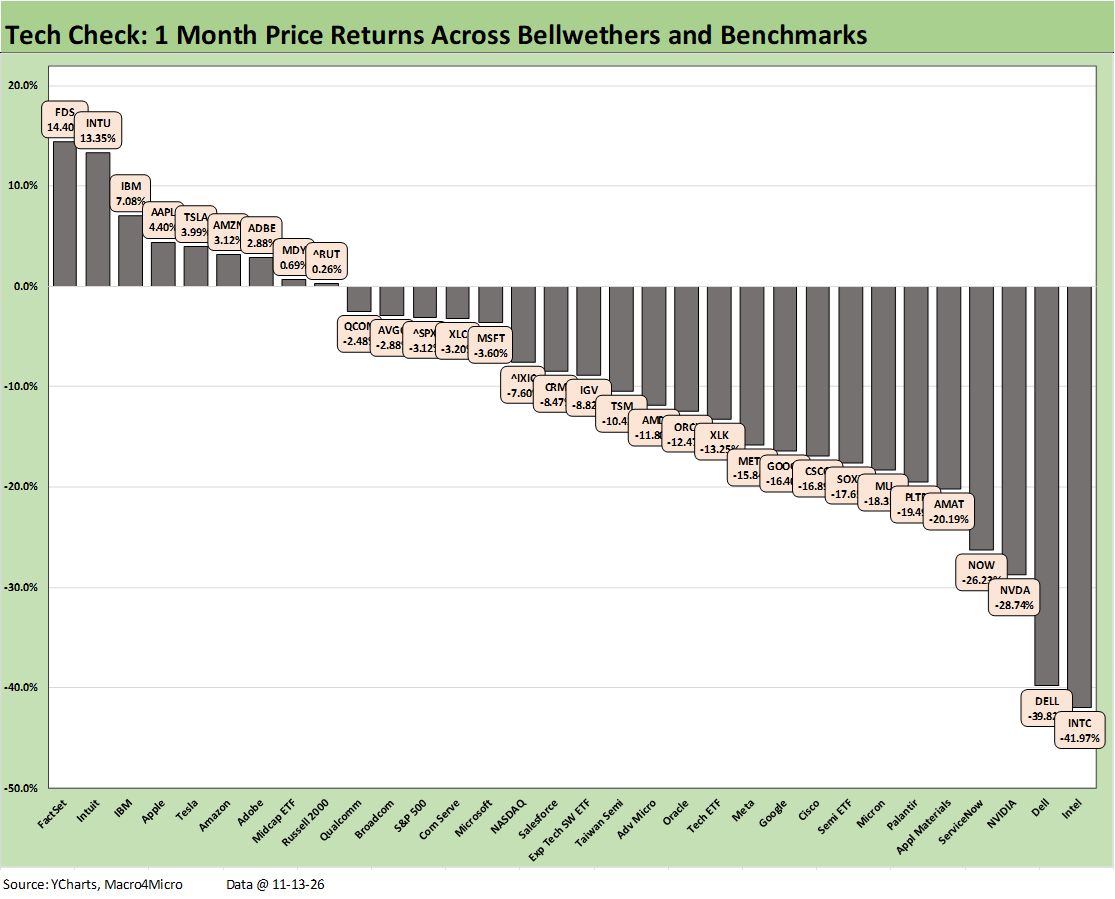
The Tech Check mix faced a rough month as we covered along the way with a score of 9-23 for the rolling month.
The top tier shows 3 Mag 7 names (AAPL, TSLA, AMZN) with 3 software/SaaS names including FactSet (FDS) at #1, Intuit (INTU) at #2, and Adobe (ADBE) at #7. Of those 3, INTU and ADBE are still in negative range YTD with FDS positive. IBM made the top 3 but remains negative YTD.
The bottom tier for the month is heavy on the AI ecosystem names with Intel (INTC) at -42% on the bottom and Dell (DELL) a close second to last at -39.8%. SOXX posted -17.6% to lead the low quartile joined by Micron (MU), Applied Materials (AMAT), and NVIDIA after its troubling week that took the 1-month NVDA return to -28.7% and the YTD return to -12.6% as detailed in the YTD chart later in this commentary.
The bottom tier for the month also includes software names Palantir (PLTR) and ServiceNow (NOW).
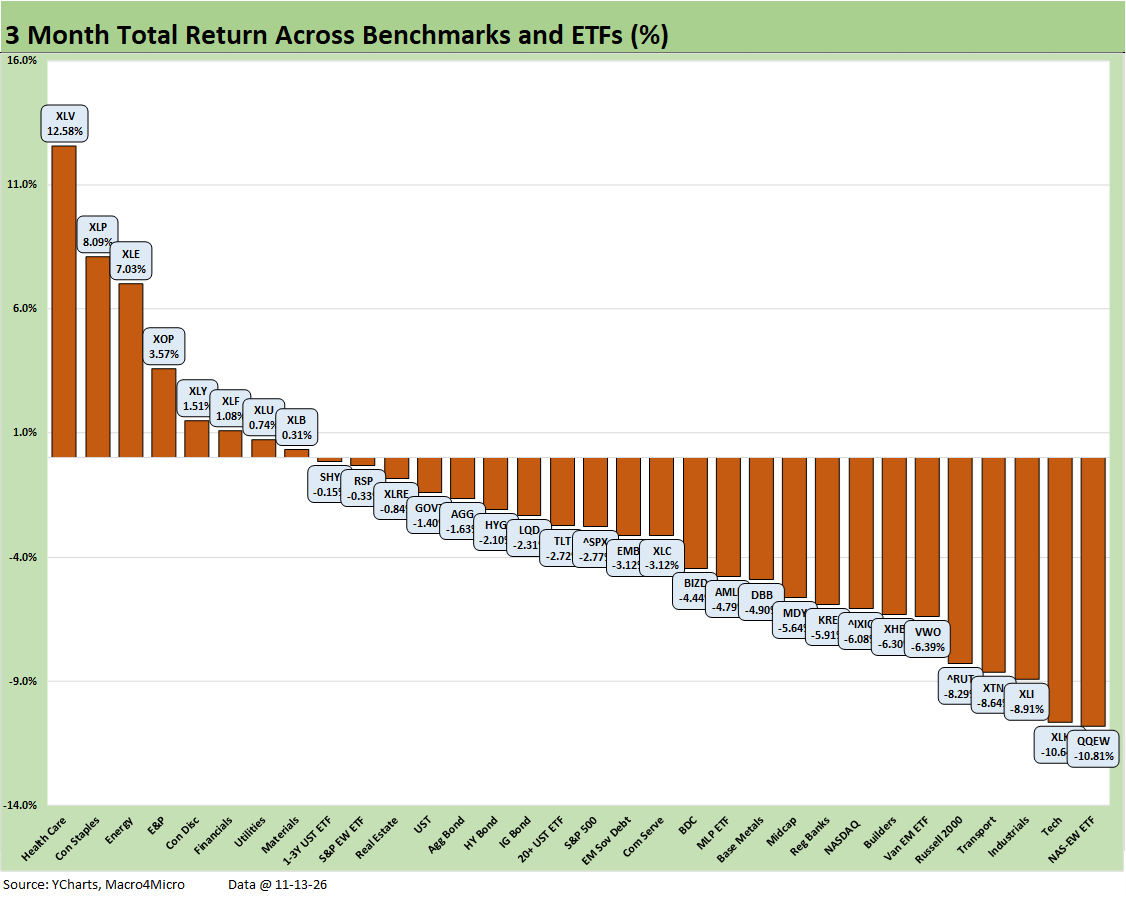
The 3-month returns for the 32 benchmarks and ETFs show a score of 8-24 that highlights a challenging stretch both for bonds and the AI trade. We see all 7 bond ETFs we monitor in negative return range.
The top quartile theme was again about defensive and quality equities with Health Care (XLV) at #1 and Consumer Staples (XLP) at #2. Energy (XLE) and E&P (XOP) made the top 5 along with Consumer Discretionary (XLY), rounding out the top 5.
While the quality defensive stocks make sense and the energy market hitched a ride on Iran and downstream supply-demand imbalances, the Consumer Discretionary (XLY) story is more diverse.
XLY is a diverse mix across a range of retail subsectors, automotive industry names, and travel & leisure among others. We looked across the top 25 XLY holdings again with some major winners and a mix of losers. Returns were firmed up over 3 months by a few company concentrations such as Mag 7 bellwether Tesla and travel and leisure names such as Marriott and Hilton. Amazon had a minimal effect in this period.
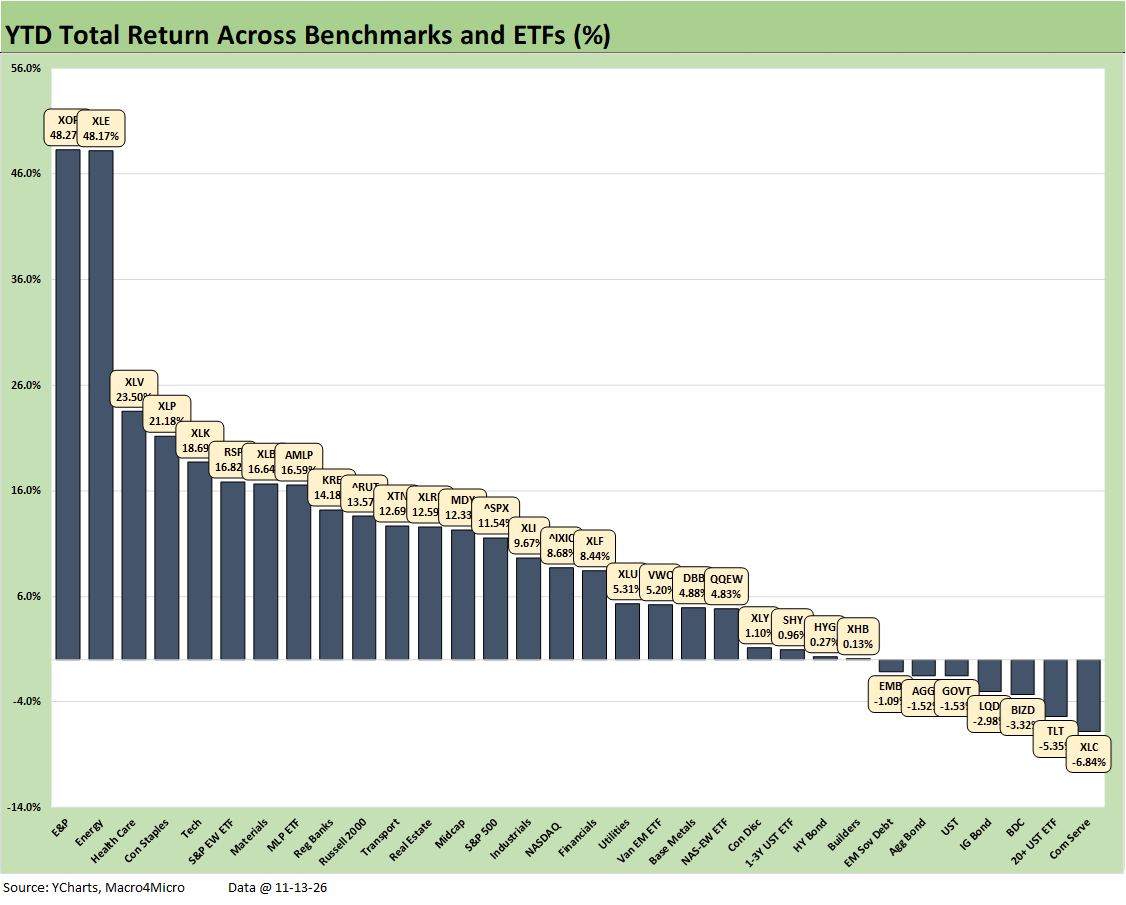
The YTD score of 25-7 for the 32 broad benchmarks and ETFs reflect the strength in energy, tech, quality dividend stocks (XLP), Health Care (XLV), and Materials (XLB). The broad benchmarks from large caps (S&P 500, NASDAQ) to Midcaps (MDY) and small caps (Russell 2000) were all positive in the 2nd quartile. The Equal Weight S&P 500 ETF (RSP) made #6 in the top quartile with the high-tech concentrations in the S&P 500 smoothed out.
Bond ETFs felt the negative effects of the UST curve with 5 of 7 bond ETFs on our list in negative range. Only the short duration UST 1-3Y ETF (SHY) and short duration HY ETF (HYG) made it into positive return range (below 1%). Communications Services (XLC) sat in last place. BDCs (BIZD) were in the bottom tier with Homebuilders (XHB) the only positive return (barely) in the bottom quartile.
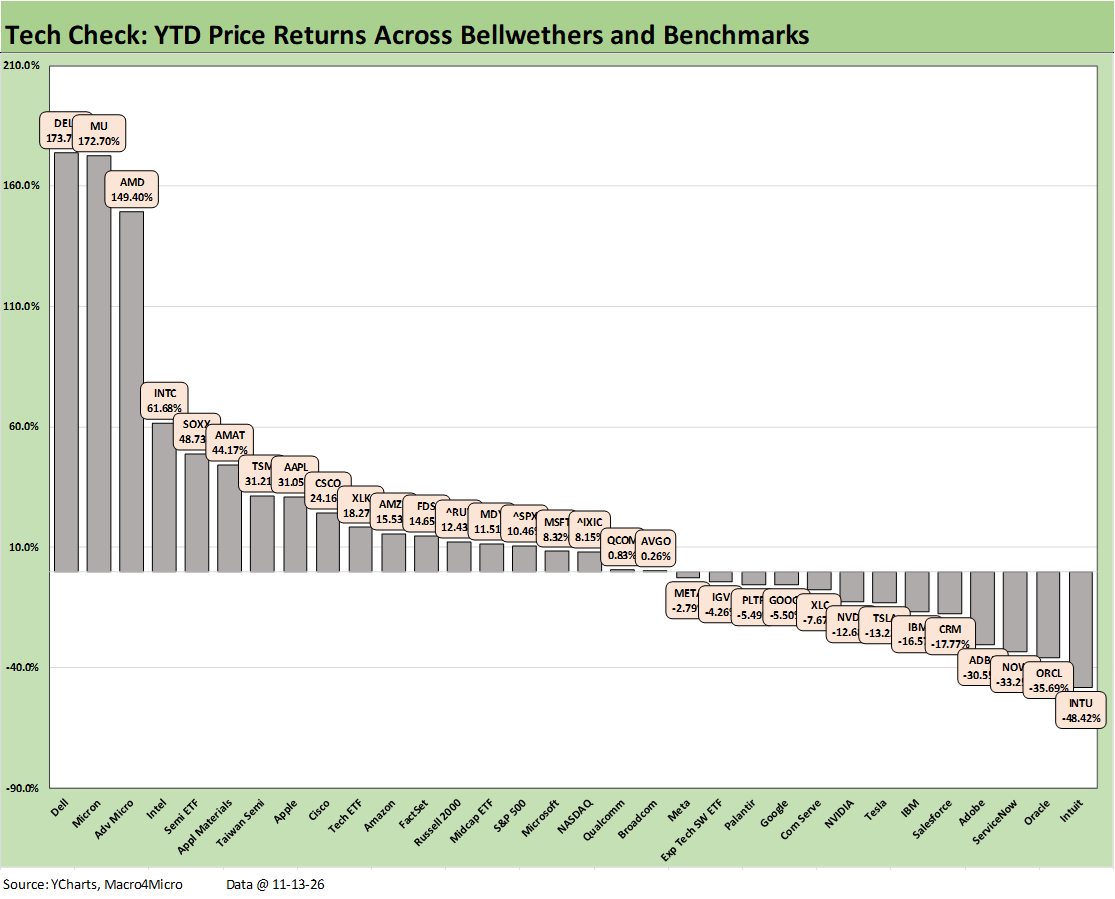
The YTD Tech Check mix shows a score of 19-13 with the bottom tier heavy on software and SaaS names. The Hi-Lo range is still otherworldly with the return differential at 222 points between Dell (DELL) vs. Intuit (INTU). If we toss out the Hi and Lo, we get a 208 point differential between Micron (MU) and Oracle (ORCL). The median performer in the group is slightly over 8%.
We see Intuit (INTU) in dead last YTD. The rest of the bottom 5 was comprised of Oracle (ORCL), ServiceNow (NOW), Adobe (ADBE), and Salesforce (CRM). Those bottom 5 are bracketed on the high end from CRM at -17.8% at 5 from the bottom to INTU at -48.4% in last place.
In the top tier, the top 7 are all AI based with 6 names in the semiconductor category and the winner (DELL) with the pole position in Servers.
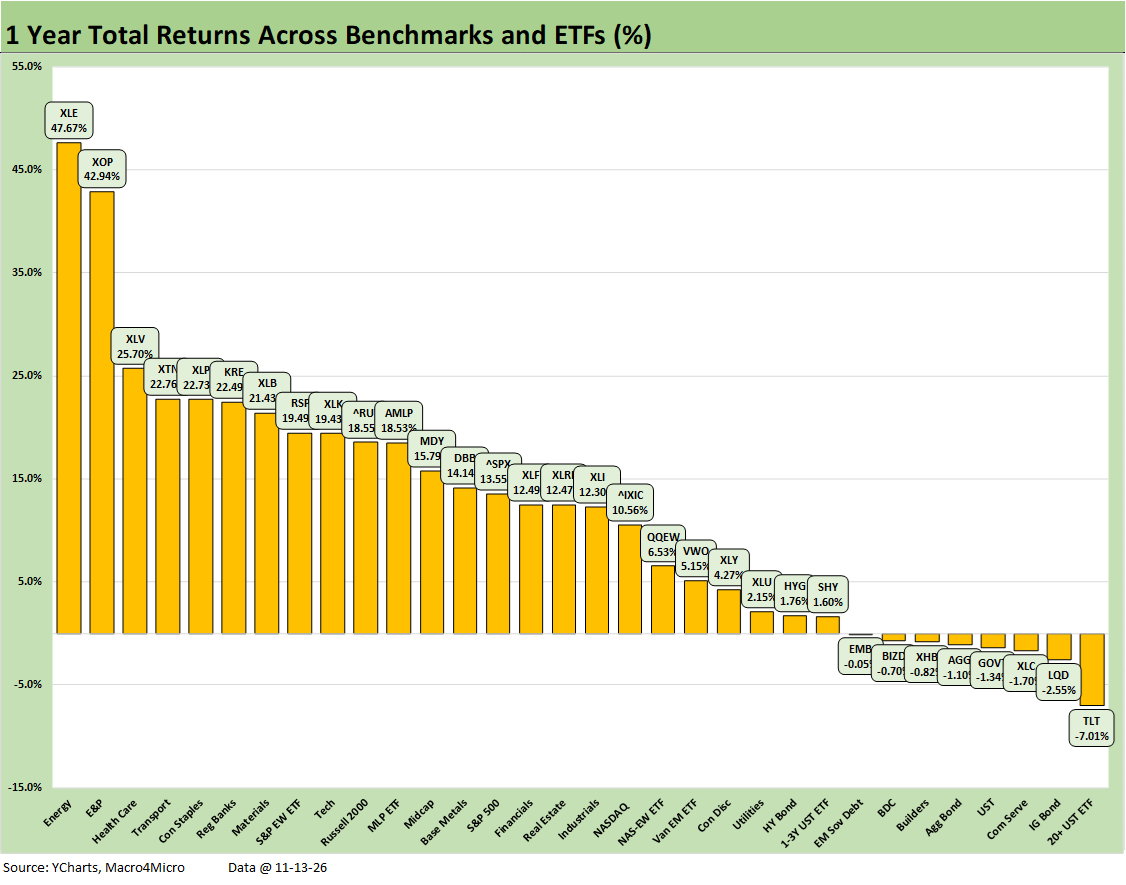
We will retire the LTM chart for 2026 after today as we get ready to wind down the year using YTD numbers. The score of 24-8 tells the story that 2026 will still likely be a very good year for equities - but not a great year. There is still time for mischief in tech and AI valuation assumptions, and there is always the geopolitical wildcard of a White House mood swing on Iran.
The record capex and economic multiplier effects across the GDP lines remain alive and well, and the nocturnal peccadilloes of a semiconductor CEO is not going to derail broader growth even if threats lurk that a de facto modest credit contraction could flow into the space with NVIDIA so immersed in investments, lending support, trade credit, and third party guarantees.
As we go to print, the NASDAQ and semiconductor space had another awful day with Micron and Intel off by over -7%, Advanced Micro at -5.6%, and SOXX at -5.4%.
The FOMC and economic growth rate could face more questions, but the investment lines in GDP have room to spare (we get a 3Q26 GDP update next week) and PCE growth has been in a solid rebound so far since the 1Q26 lows (see 3Q26 GDP: Happy Days? 10-29-26, PCE Sept 2026: Inflation, Income & Outlays 10-29-26).