

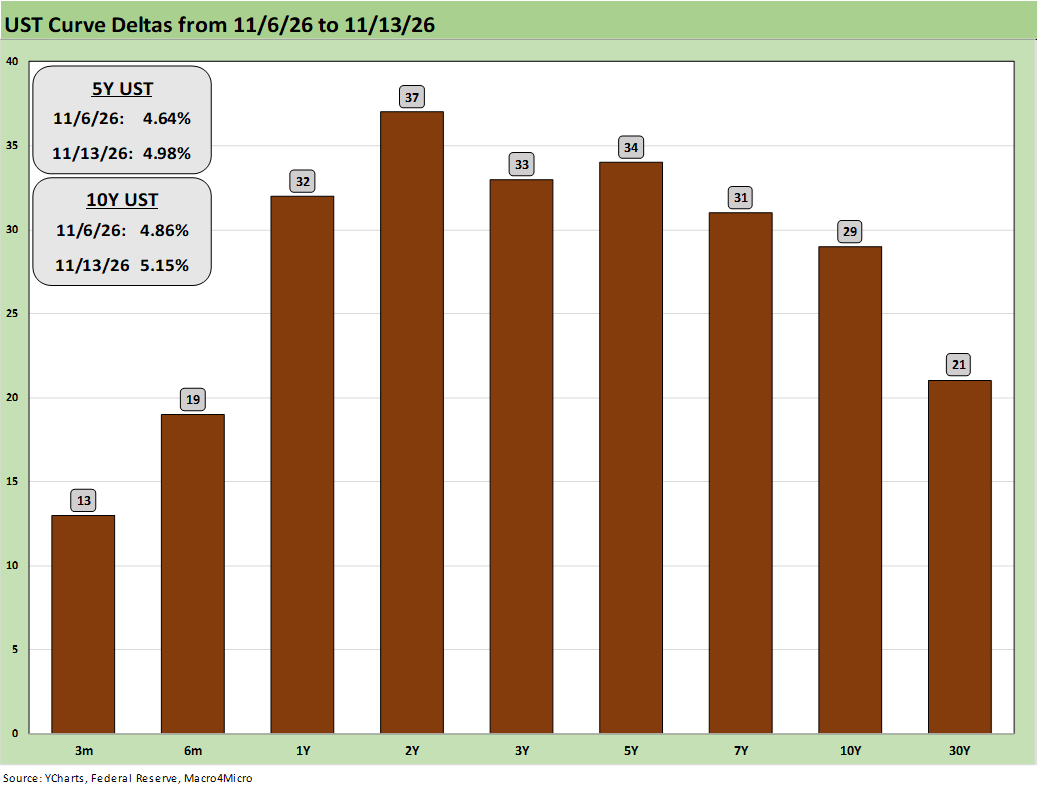
The sharp move higher in the UST curve is self-evident in the chart with the main culprit being a troubling CPI report (see CPI October 2026: Stubborn, Unfriendly Food Metrics 11-10-26). The +37 bps in the 2Y UST can be tied to FOMC expectations. The 10Y UST at +29 bps is retracing some of the rally after the 10Y started to move lower after crossing the 5.3% handle at the beginning of October.
The PPI report on Friday in the abbreviated holiday week (bond market closed for Veterans Day) elicited a milder reaction of a few bps wider on the 10Y UST. We found the underlying moves across the PPI report to be relatively grim (see Producer Price Index Oct 2026: Inflation Shadows Still Lurk 11-13-26). The YoY PPI of 6.5% was cited as the “highest since 2022” and that covers it.
Away from the UST deltas in the chart, the mortgage market also took a beating with a 32 basis point rise over three days in the Mortgage News Daily survey to 7.50% as of Friday close. The lagging weekly Freddie Mac benchmark (Thursday release) was 7.11%, down from 7.18% the prior week and 6.24% the prior year. The worst existing home sales numbers since 2010 was another headline with direct ties to mortgage rates. We get home starts this week.
The FOMC is back in the debate for 50 bps even if 25 bps is much more likely. The FedWatch CME odds are at 88.5% for one hike (400-425) at the Dec FOMC meeting with the odds of 2 hikes (425-450) at 11.5% as we go to print. One Fed governor (Waller) citing 50 bps for the Dec meeting rattled the markets. The January 2027 FOMC meeting shows FedWatch odds of 425-450 bps at 68.1%. This coming week, the market will see Retail Sales, Industrial Production, and FOMC minutes for more input.
The UST curve has been a tough call in recent weeks with the curve heading higher even when oil rose to $104 with inflation higher (see Weekly UST Deltas: More Declines, More Inflation 10-31-26). Last week, the UST curve had another rally, but at least investors could point at flight to quality in the AI turmoil and lower oil (see Market Commentary: The UST Curve 11-7-26). The inflation playbook usually says, “higher inflation, stronger economy = FOMC tightening,” and that seems to be coming back into play after some strange weeks.
The 10-year moving to 5.15 percent is the number that matters most for homebuyers, since that is where mortgage pricing takes its cue. The 32 basis point move in mortgage rates in a week shows how quickly a payment can change while a buyer is still deciding. This is a useful reminder to watch the bond market, not just the headline rate.