

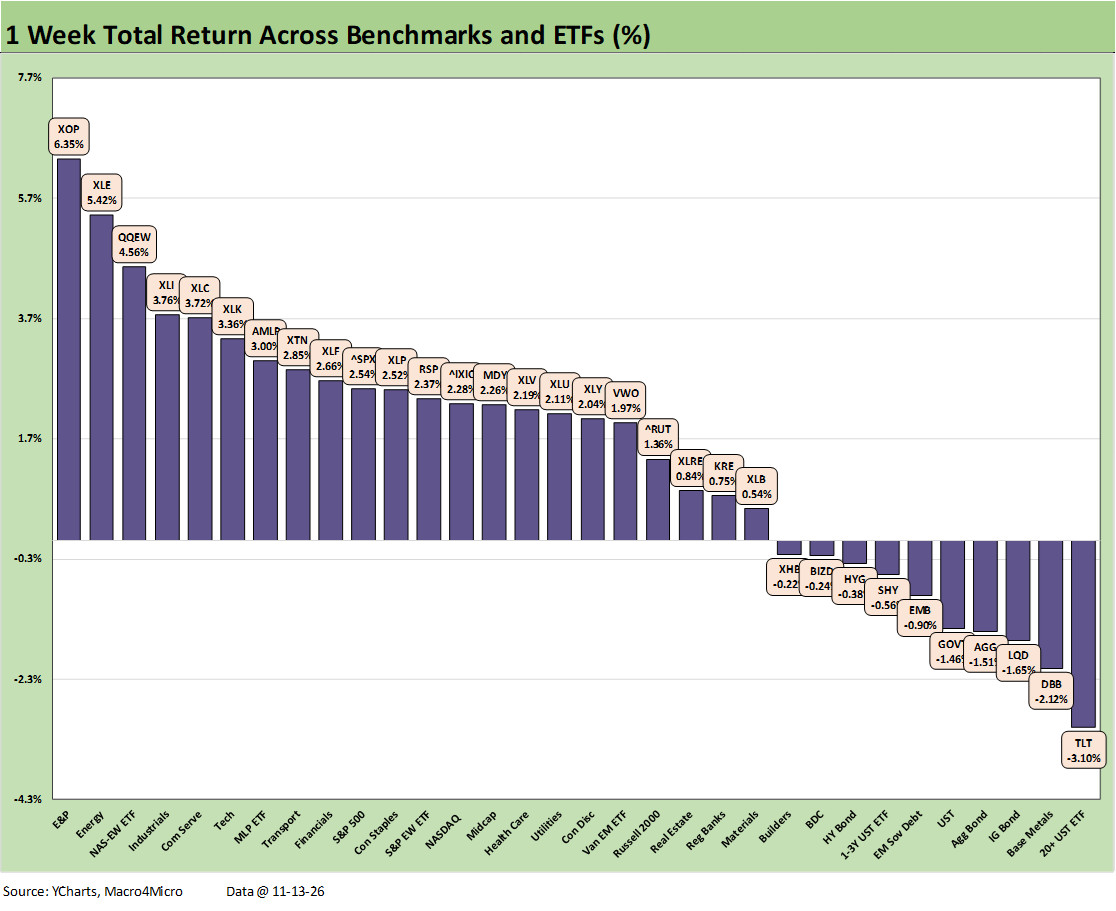
The returns for the 32 benchmarks and ETFs we monitor show a score of 22-10 this week with 7 of the 10 in the red being the bond ETFs we monitor. Bond ETFs were also 7 of the 8 asset lines in the bottom quartile with the Base Metals ETF (DBB) joining the bond ETFs. In the bottom of the 2nd quartile, we also see Homebuilders (XHB) and BDCs (BIZD) posting slightly negative returns.
The sharp move higher in the UST curve was brutal on duration with the long duration 20+Y UST ETF (TLT) in dead last. The UST curve posted major moves higher across the curve with the 2Y at +37 bps and 10Y at +29 bps (see Market Commentary: The UST Curve 11-14-26).
The winners in the top quartile include 3 energy ETFs with E&P (XOP) at #1, Energy (XLE) at #2, and Midstream (AMLP) at the low end of the top tier. The energy performance was not about oil prices and instead tied to the reality that Trump is giving up on an Iran deal. At the same time, Iran is clearly stating they will not give up any uranium and that none will leave the country. That could go under the heading of “emboldened by US election results.” Trump also took JD Vance off negotiations, so limbo rules.
The top quartile reflects a rally in tech this past week (covered separately) with the Equal Weight NASDAQ 100 ETF (QQEW) in the top 3 and Communications Services (XLC) in the top 5 with the Tech ETF (XLK) at #6. On a favorable cyclical note, we see industrials (XLI) in the top 5 also.
The broad benchmarks were clustered in the 2nd quartile with the S&P 500, the Equal Weight S&P 500 (RSP), NASDAQ, and Midcaps (MDY) posting steady weeks. The Russell 2000 was in the upper end of the 3rd quartile in positive range. Interest rate sensitive ETFs such as Real Estate (XLRE) and Homebuilders (XHB) were in the 3rd quartile.