
Footnotes & Flashbacks: Asset Returns 12-16-23
Pleasantville comes to the markets and everything goes right.


We look at returns in a very strong week in a very strong month in a very strong quarter as the year is “being made” over a short time frame for numerous debt and equity benchmarks and ETF industry groups.
The running returns across our 31 benchmarks and ETFs keep showing returns shifting toward more sectors positive and with higher running returns.
The homebuilder ETF (XHB) being in the lead YTD ahead of half a dozen tech and Mag 7 heavy ETFs is quite a statement on how builders navigated the mortgage rate spike.
HY is at an equity-like return YTD while IG bonds turned in a month that puts them in high single digit YTD returns.
There is not much mystery to the latest rally off all things risky, all things not so risky, all duration-heavy debt, and some of the troubled interest-sensitive equity sectors that lagged for much of 2023 (notably real estate).
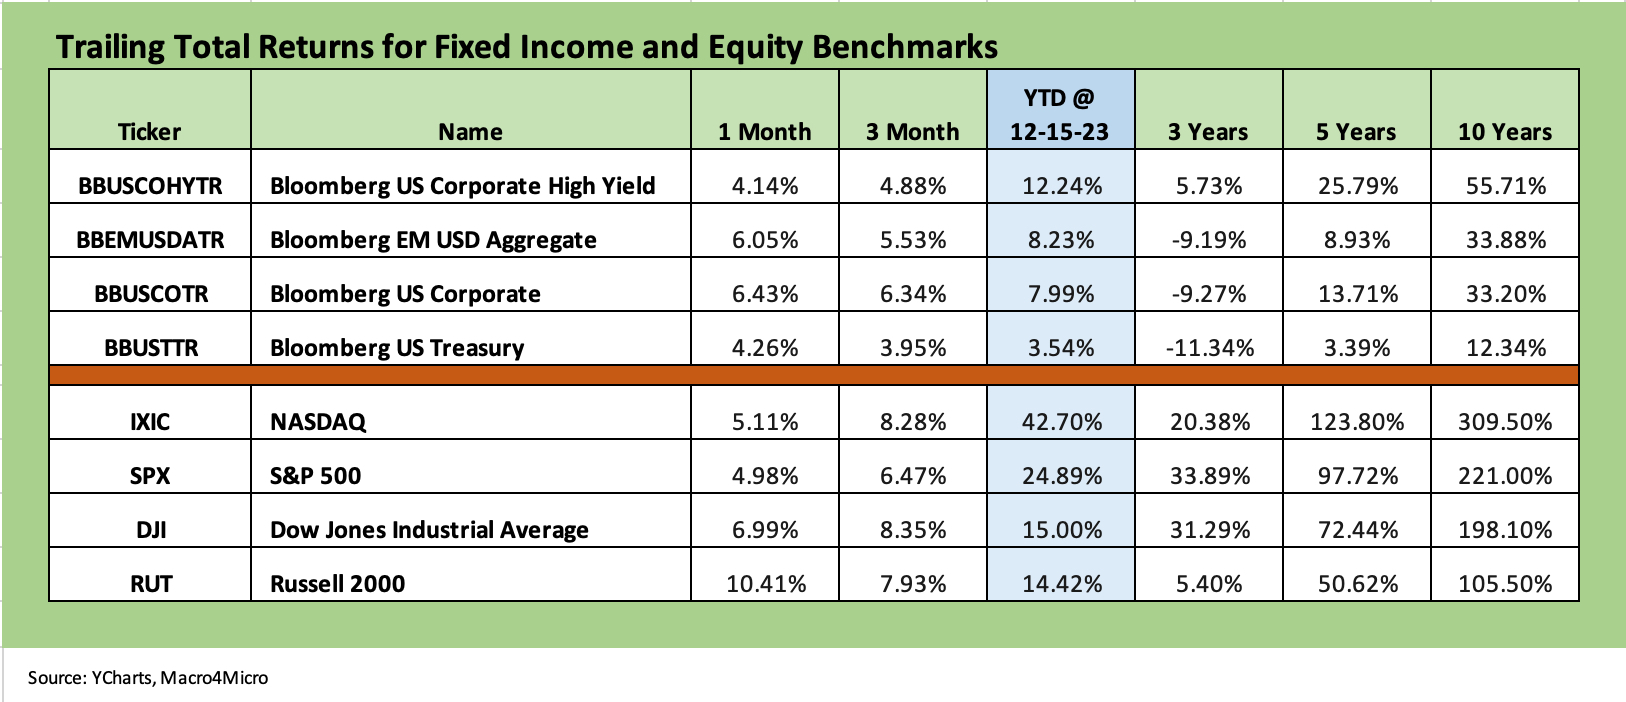
The chart above frames returns for the mix of debt and equity sectors that we watch closely. We see some 1-month returns for ETFs and asset lines that a few months ago seemed like they might not reach for the full year. We see HY at over 12% YTD with an equity-like return and IG in high single digits after a 6% handle month. The UST index posted a 4+% month and is now winding down the year in style but still only posting a 3.5% YTD return.
Equities do not need a lot of detailed explanation with the amazing year for Tech and the Magnificent 7. The most notable move over the past month was the soaring small caps delivering a 10% handle trailing 1-month after running negative at -5.9% YTD near the end of Oct 2023. That breadth factor was missing across 2023 generally, but this latest risk rally extended the breadth down into the US-centric Russell 2000.
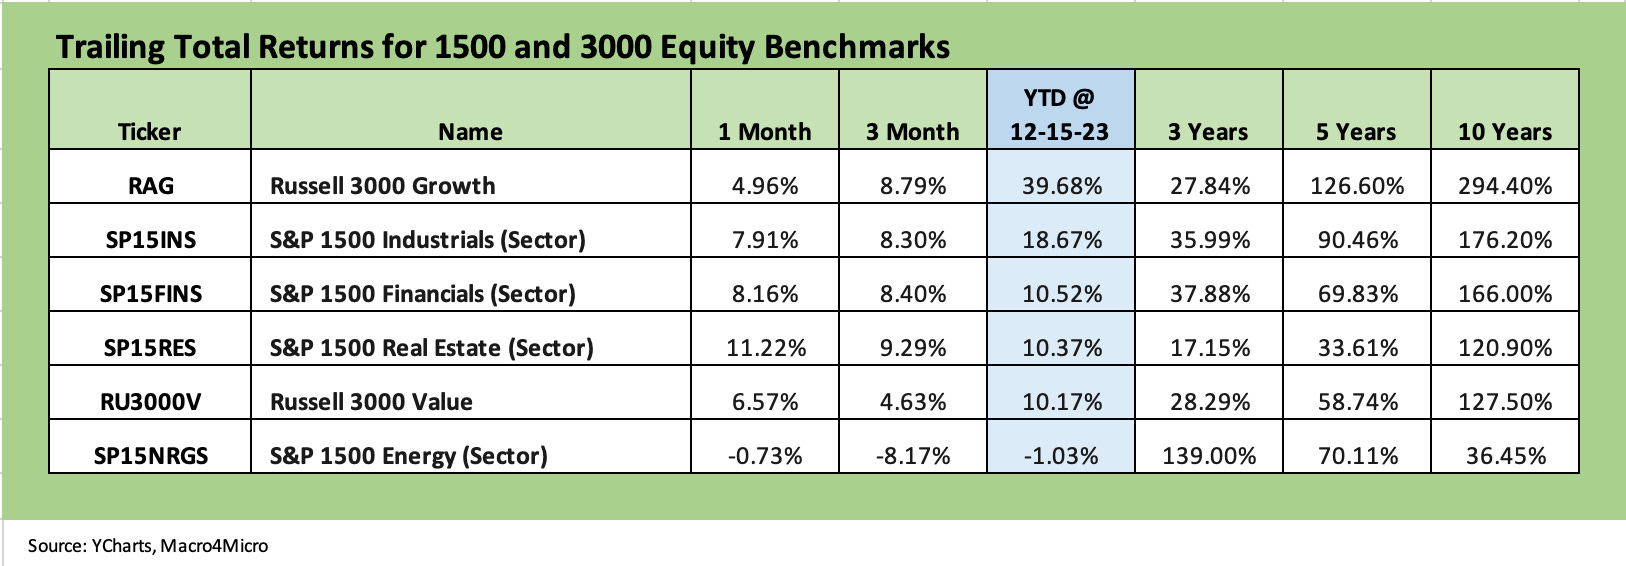
The update on the 1500 and 3000 series extends that reflection of much-improved performance and wider breadth with the notable exception of Energy. Oil and gas as a group was the darling of the 2022 Russia-Ukraine anxiety but has become the dog of 2023 on an oil price slide and weak natural gas pricing.
The UST impact is very much in evidence in the 11% month posted in real estate in a month that puts the 1-month return ahead of the YTD return. Financials are also making a strong comeback with the UST rally and speculated easing by the Fed on the front end that could offer relief on margins and deposit costs and perhaps offer some tailwinds to borrowers and protect asset quality.
With real estate so frequently in the bears’ crosshairs, a more friendly UST curve could translate (in theory) to less downside in the commercial real estate market and how that flows into defaults and provisioning needs. A soft landing would also mitigate tenant stress.
Other side effects of the forward-looking interest rate optimism in the financial sector equity valuation could be some improvement in mortgage activity if the existing home sales markets loosen up. A 6% handle mortgage rate is still brutal for monthly payments as we covered in the mortgage section of our separate Footnotes publication on yields (see Footnotes & Flashbacks: State of Yields 12-16-23). The ability of the builders to top off the advantage with mortgage buydowns has been well documented at this point. Existing home sales still have a much tougher road even if 100 bps can bring less bumps.
The return snapshot with a quick visual…
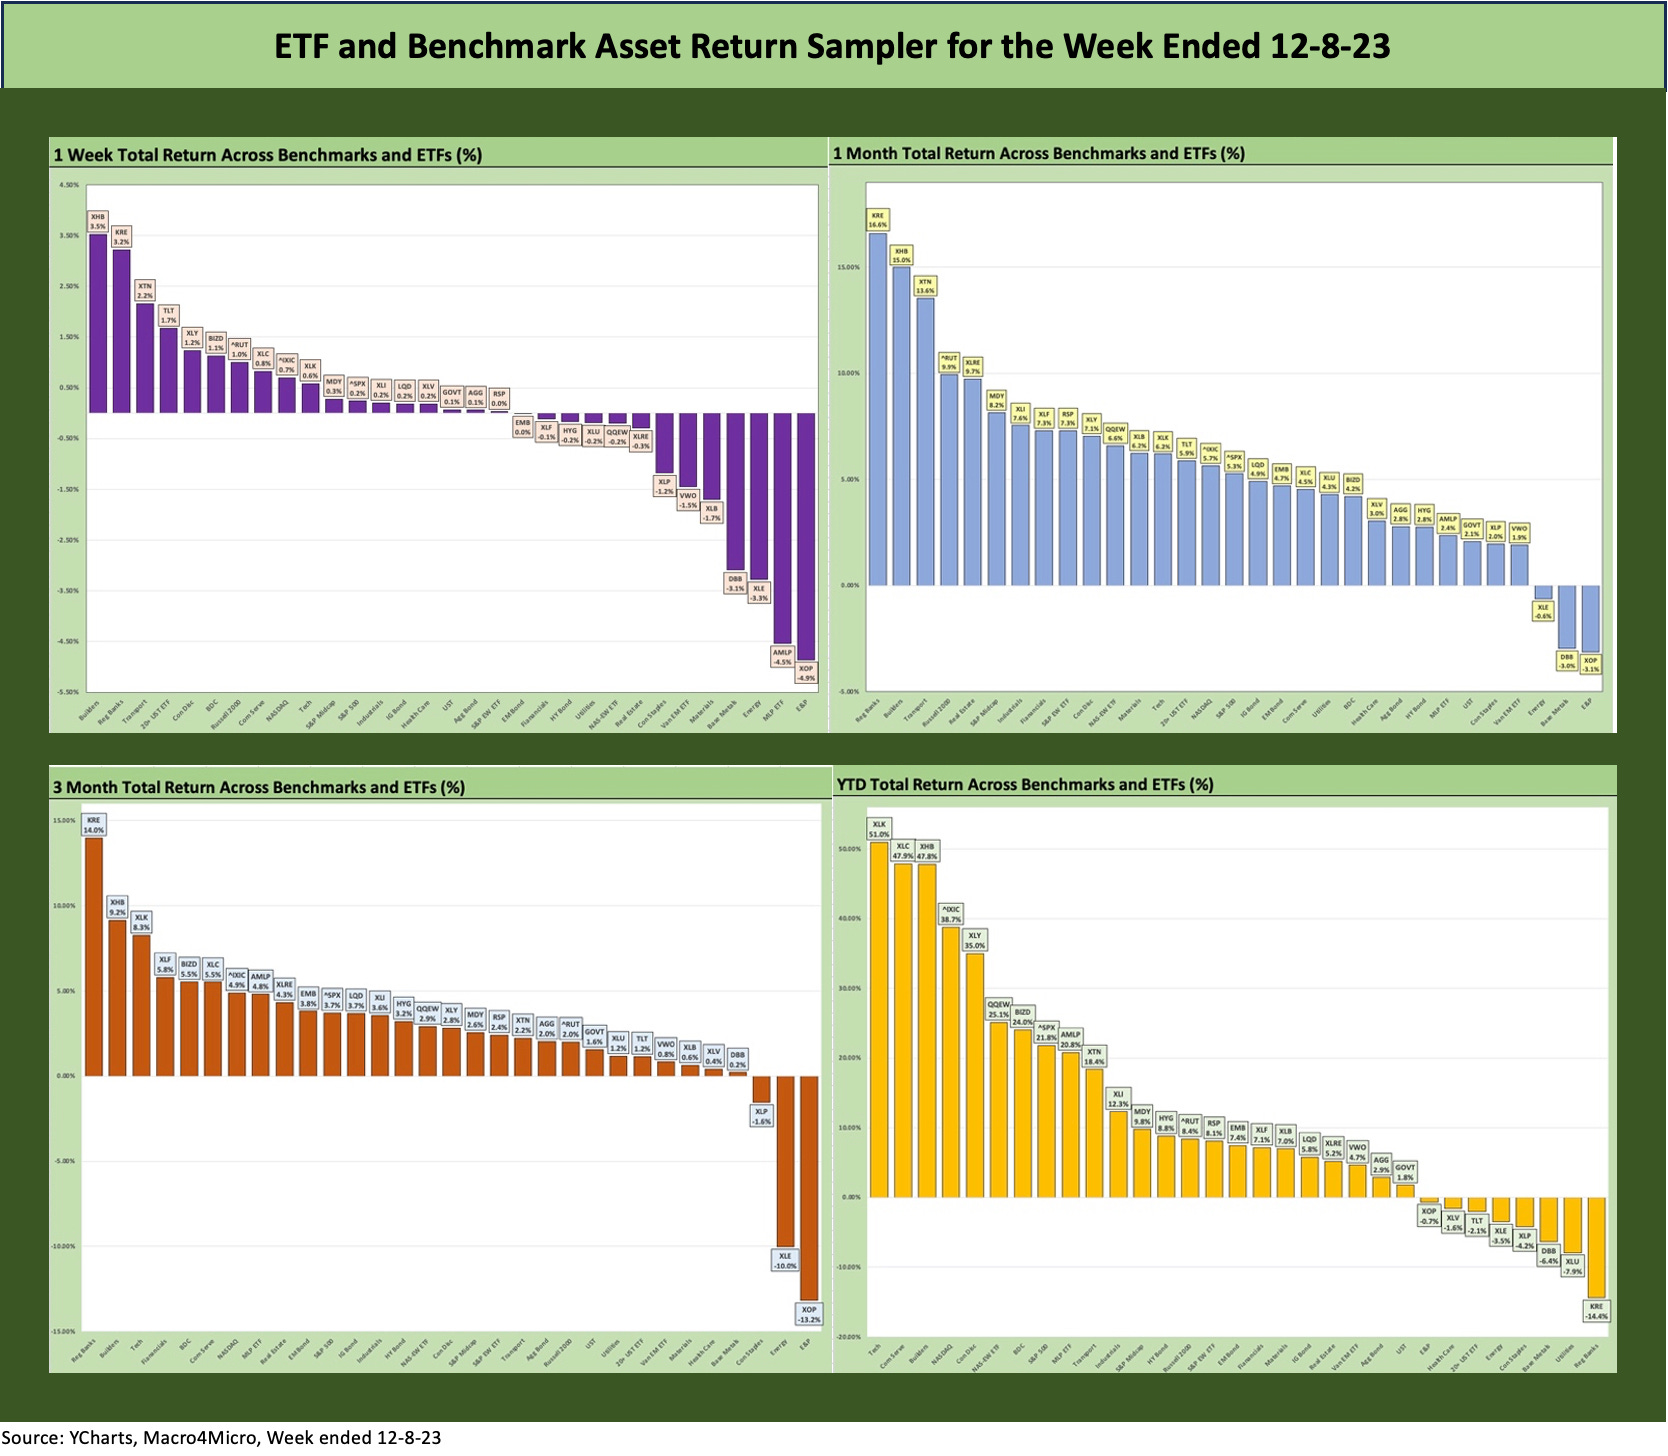
The chart grouping below allows for an easy view of the shape of returns for each period (1-week, 1-month, 3-months, and YTD). We occasionally see all negatives or all positive, but we found it to be an easy way to look at the current configuration and how it may have reshaped in just a week. First, we show the box of 4 for this week and then we show one for last week.
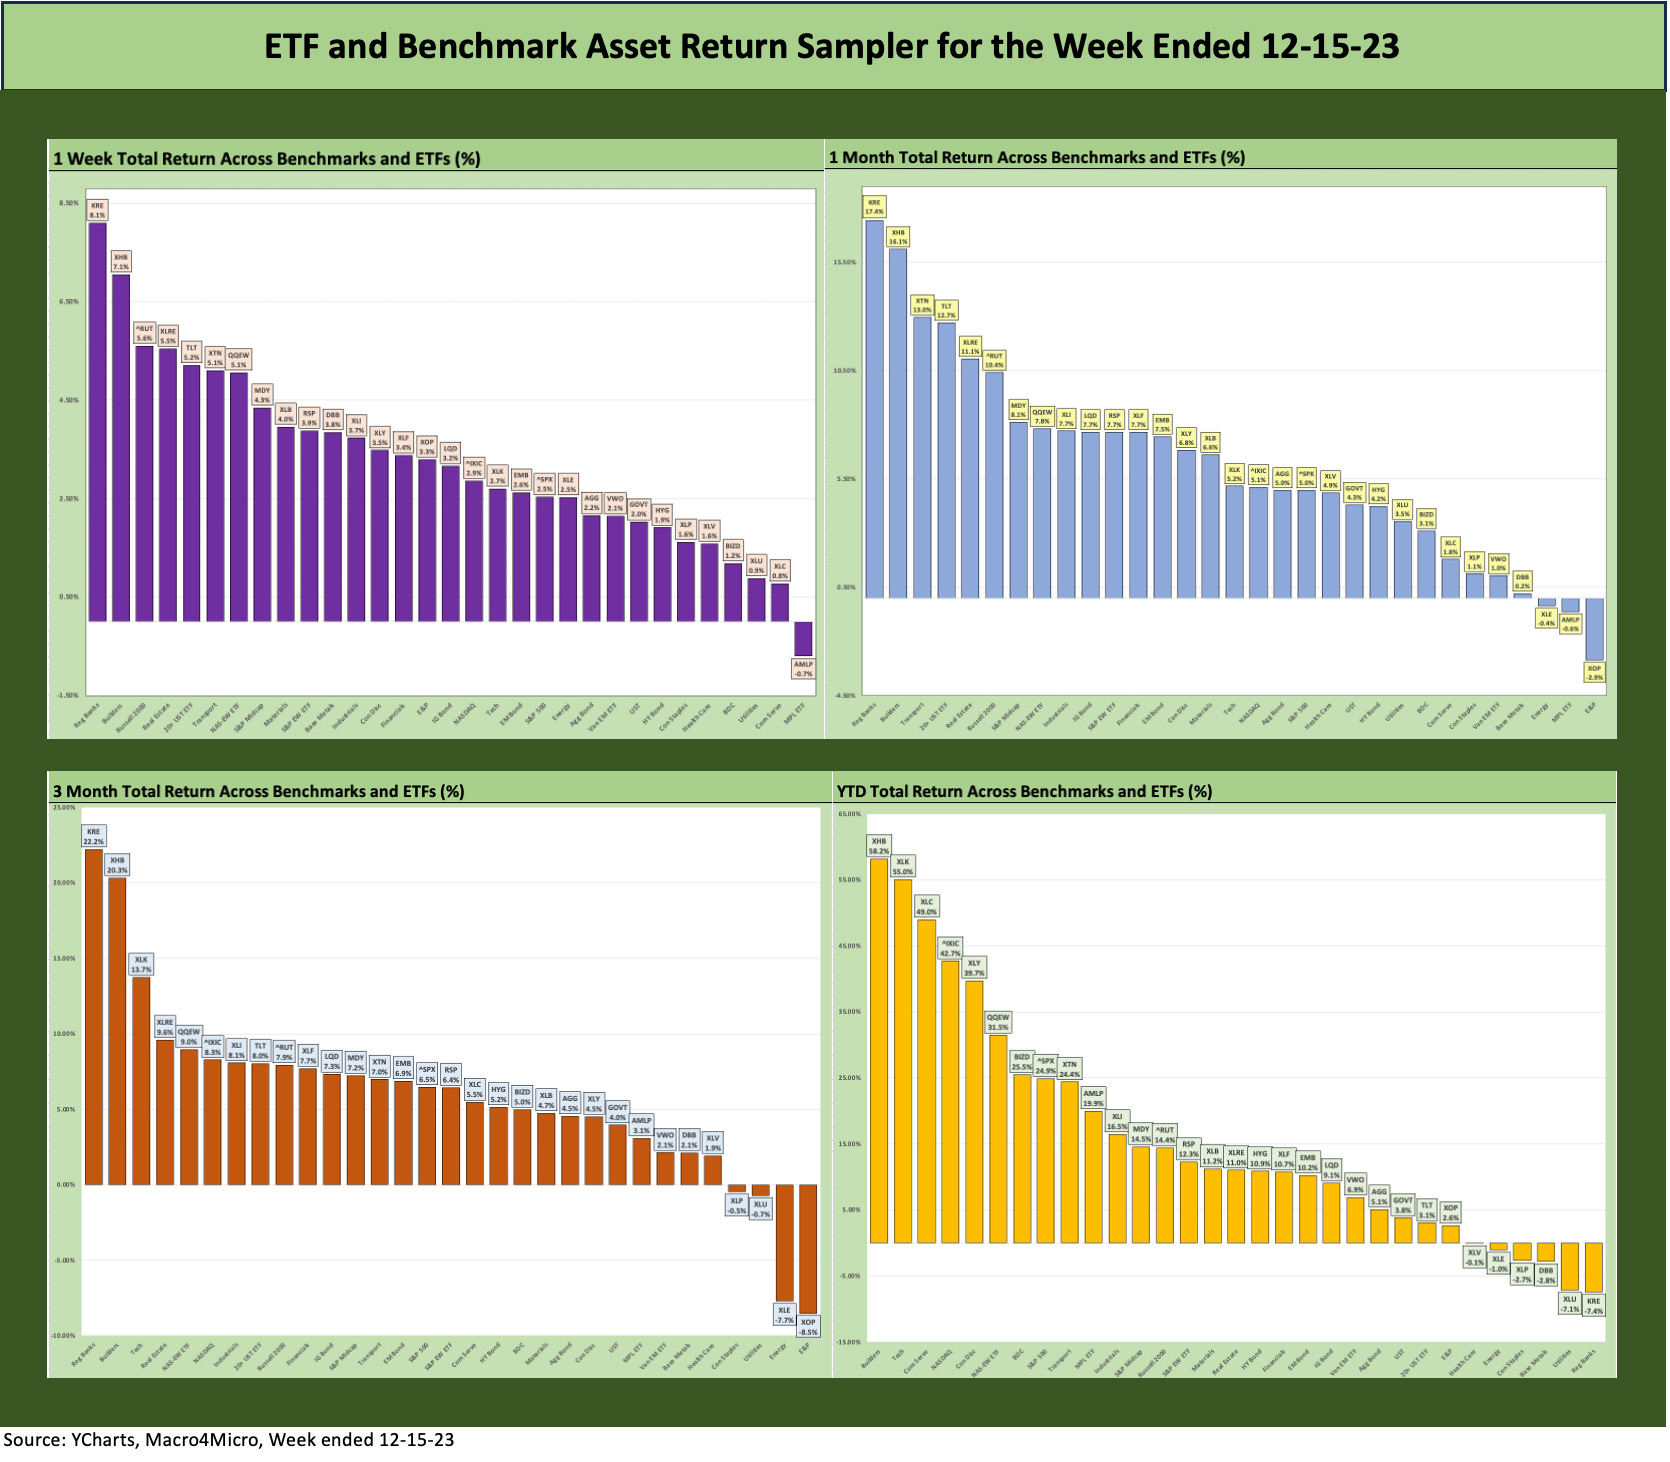
The above chart shows the steady shift left and higher with the lowest buckets lower and the highest higher. That is not a bad trend line in what is one of the more impressive finishes we have seen for a while but especially being 7 quarters into a tightening cycle that saw mortgage rates hit 8% and oil hit triple digits in 2022 including a high WTI tick over $123. We then saw ample time in the $90 oil range in 2023. High oil is always an economic tax on the consumer, so the consumer tax effects are at least trending down now.
The period of 2022-2023 also features the largest land war in Europe since WWII, a threatened UST default that was being heartily endorsed by a former president, and a slowly unfolding train wreck of retaliatory impeachment hearings when there are a lot of other priorities. The US faces the potential for more government shutdowns ahead and the continuation of what is now 4 to 5 years of tariff distortions that are more likely to increase than be removed.
We have seen supplier chain disruptions and reshoring campaigns overlap with skilled and semiskilled worker shortages that have been a catalyst for upward pressures on wages and more aggressive union demands to exploit their stronger hand at the negotiating table. These are good for the workers but still have to work through the system on price increases or margin pressure.
Time horizon asset returns…
In our next four asset return charts, we cover 1-week, 1-month, 3-months, and YTD time horizons for a range of ETF and benchmark returns. We look at 31 different benchmarks and ETFs that cut across a wide expanse of the economy.
We recently added 3 more ETFs to the mix, including one for the SPDR S&P Midcap 400 (MDY), one for Emerging Markets Equities (Vanguard FTSE Emerging Markets ETF), and one for the iShares JPM Emerging Market USD Bonds (EMB). We needed some EM representation in EM equities and bonds as well as a benchmark to connect the large caps and small caps.
Midcaps have a wide variety of valuations with both growth companies and old school value plays across the diverse mix of industry groups. Midcaps also have a fair amount of overlap with the HY issuers base and credit-intensive sectors generally with less of the narrow issuer distortions that we see in the broad market large caps.
The Magnificent 7 heavy ETFs…
Some benchmarks have a few issuer concentration elements that leave them wagged by a few names. When looking across some of the bellwether industry/subsector ETFs, it is good to keep in mind which narrow ETFs (vs. broad market benchmarks) get wagged more by the “Magnificent 7” including Consumer Discretionary (XLY) with Amazon and Tesla, Tech (XLK) with Microsoft, Apple, and NVIDIA, and Communications Services (XLC) with Alphabet and Meta.
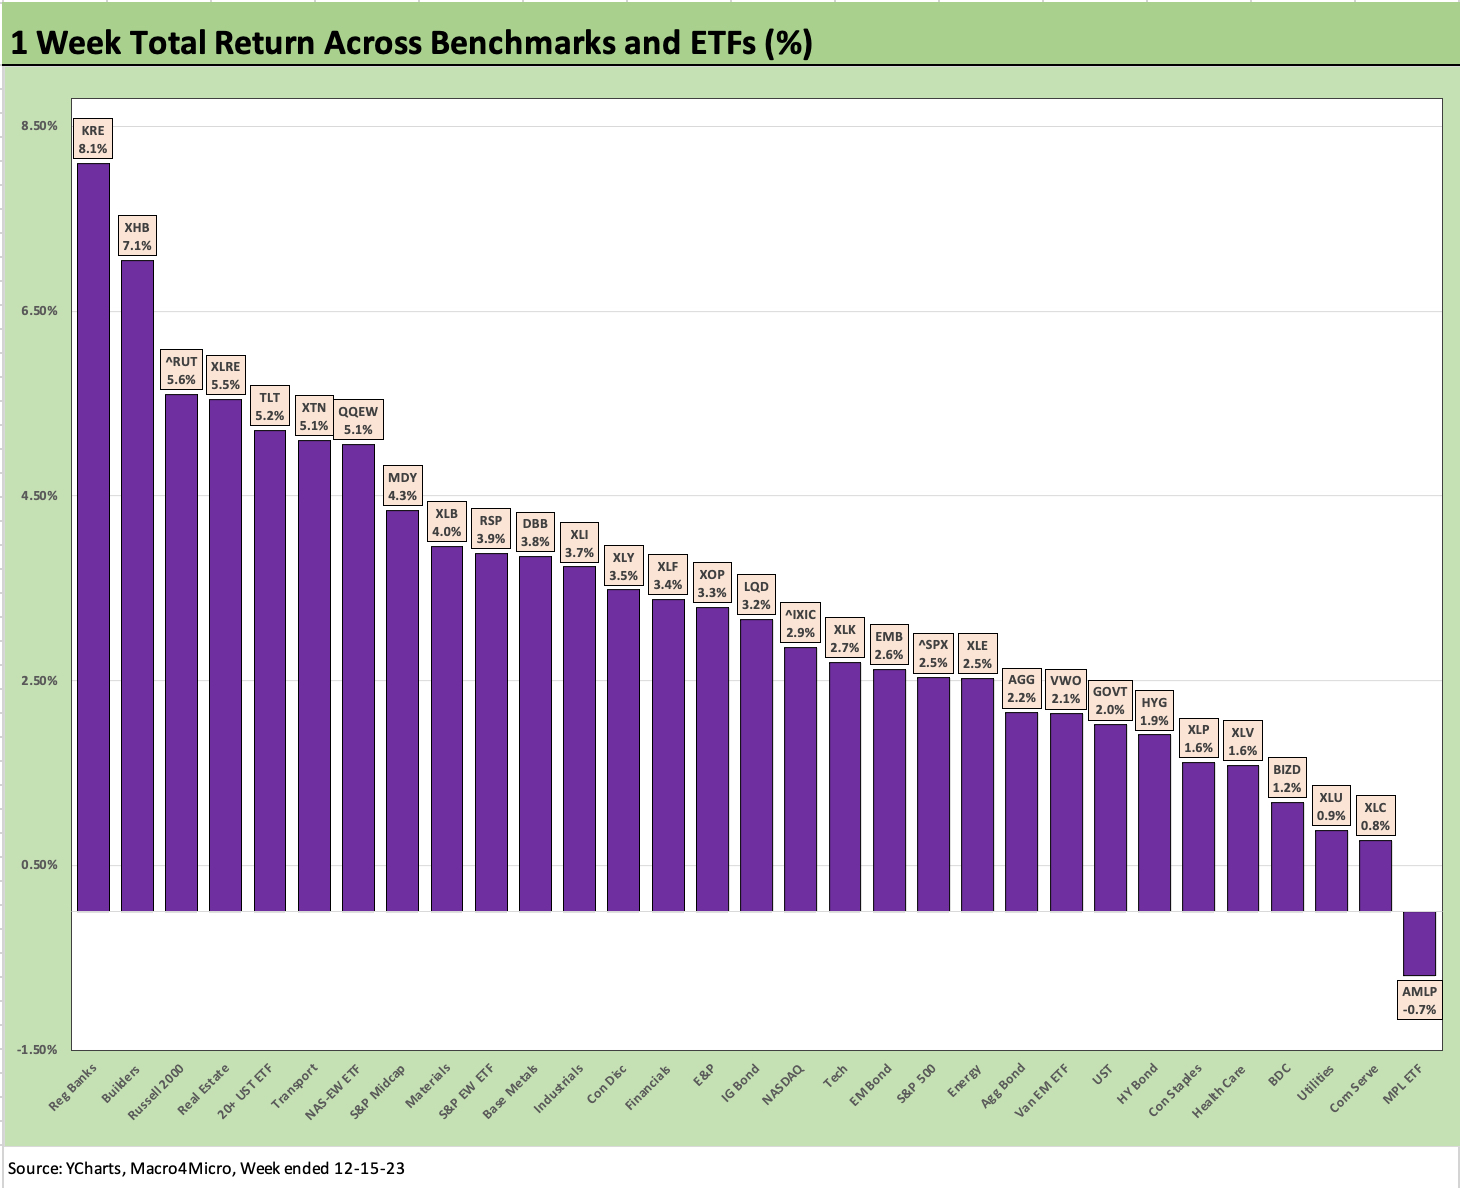
The 1-week return scoresheet is 30-1 positive with 4 of the top 5 heavily tied to interest rates across Regional Banks (KRE) at #1, Homebuilders (includes suppliers, ticker XHB) at #2, Real Estate (XLRE) at #4, and the long-duration 20+ Year UST ETF (TLT) at #5. Breaking up the interest rate driven group was the Russell 2000 small caps (RUT) at #3 with a +5.6% on the week.
In another nod to the breadth of the rally, we see small caps at #3 but Midcaps on the cusp of the top quartile at #8 (+4.3%), only two notches ahead of the equal weighted S&P 500 (RSP). The broad market cap weighed S&P 500 was #20 of 31. NASDAQ and the Tech ETF (XLK) were down in the third quartile, but the equal weighted NASDAQ 100 made it into the bottom of the top quartile. IG corporates (LQD) materially outpaced HY in the rankings as LQD rode its longer duration profile.
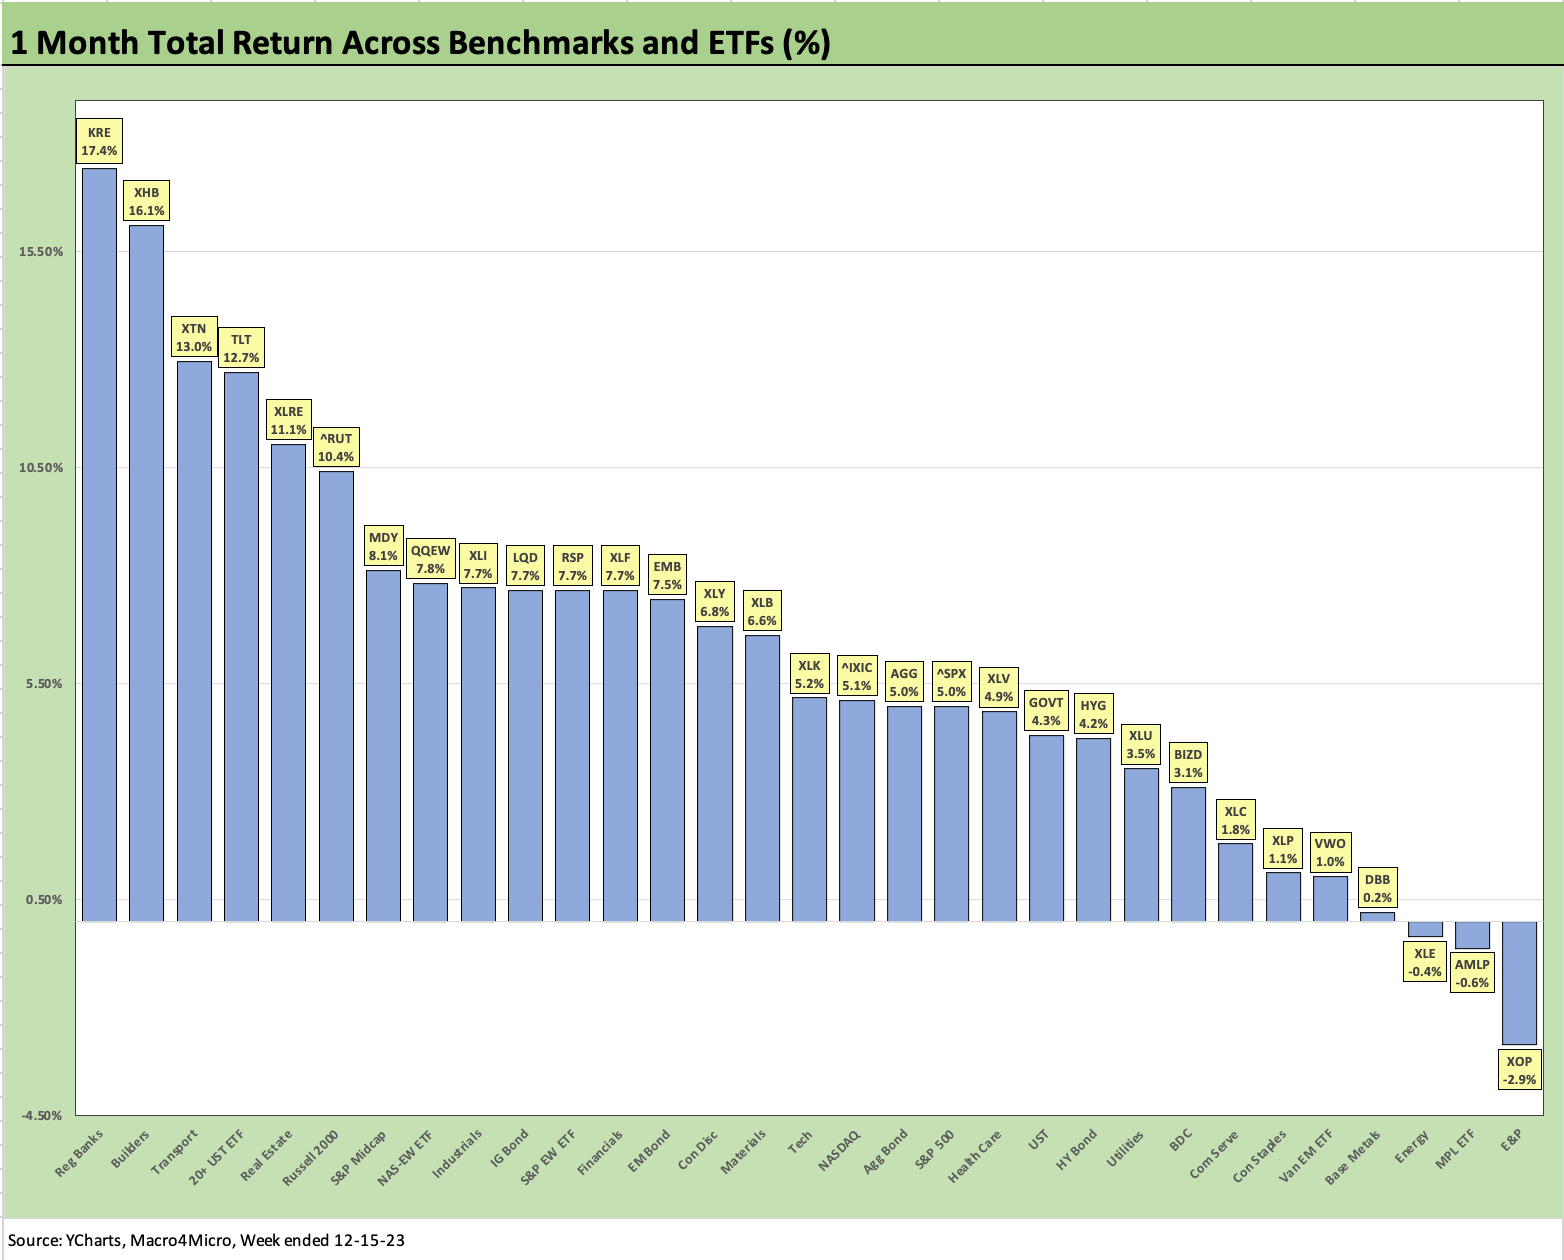
The rolling 1-month was 28-3 positive with the 3 energy ETFs in the red with E&P (XOP) on the bottom at -2.9% and Midstream (AMLP) and Energy (XLE) just above with negative returns under -1%.
The comeback of Regional Banks (KRE) continues on the back of the Fed color and UST bullishness as KRE ranked #1 on the month at an impressive +17.4% just ahead of builders (XHB) at +16.1%. We updated the running equity returns and relative performance of the major builders in conjunction with our 4Q23 commentary on Lennar (see Lennar 4Q23: Buyer Buzz, Curve Support 12-15-23).
The builders are among the stories of the year at this point alongside the Magnificent 7 and the regional bank meltdown. Investors would be ill-advised to put those regional bank deposit runs too far back in the memory banks even with a friendlier curve. The reactions to any potential shocks will keep that in the risk management thought process.
Other big winners for the month included Transports (XTN) as a cyclical proxy that had seen some volatility along the way. We also see the long duration UST ETF (TLT) which is a function of the yield curve dynamics. Real Estate at #5 is a function of a beaten-up victim of yields and asset quality worries getting relief from the curve. Real estate is also getting a lift from the perception of real estate values and collateral protection that come with lower rates.
We find the relative strength of small caps and midcaps vs. large caps an interesting highlight along with the relative advantage of the equal weighted S&P 500 ETF (RSP) over the market cap weighted S&P 500.

The 3-month trailing returns has rallied from only two positive for the 3-months with the end of October Footnotes piece (see Footnotes & Flashbacks: Asset Returns 10-29-23 10-29-23) to seeing 27 positive and 4 negative as of this week. That was a radical shift. The 4 negatives included 2 energy-related (XOP and XLE) and 2 very interest sensitive dividend defensive plays in Utilities (XLU) and Staples (XLP) which generally have been laggards all year with an occasional boost.
The winners over 3 months are much like the 1-week and 1-month with the same overriding drivers of the UST curve and FOMC handicapping set against inflation updates such as Real Estate (XLRE) and 20+ year UST ETF (TLT). We do see a better ranking for tech-centric and Magnificent 7 heavy ETFs in the 3-month period with the Tech ETF (XLK) at #3, equal weighted NASDAQ 100 (QQEW) at #5, and NASDAQ (IXIC) at #7.
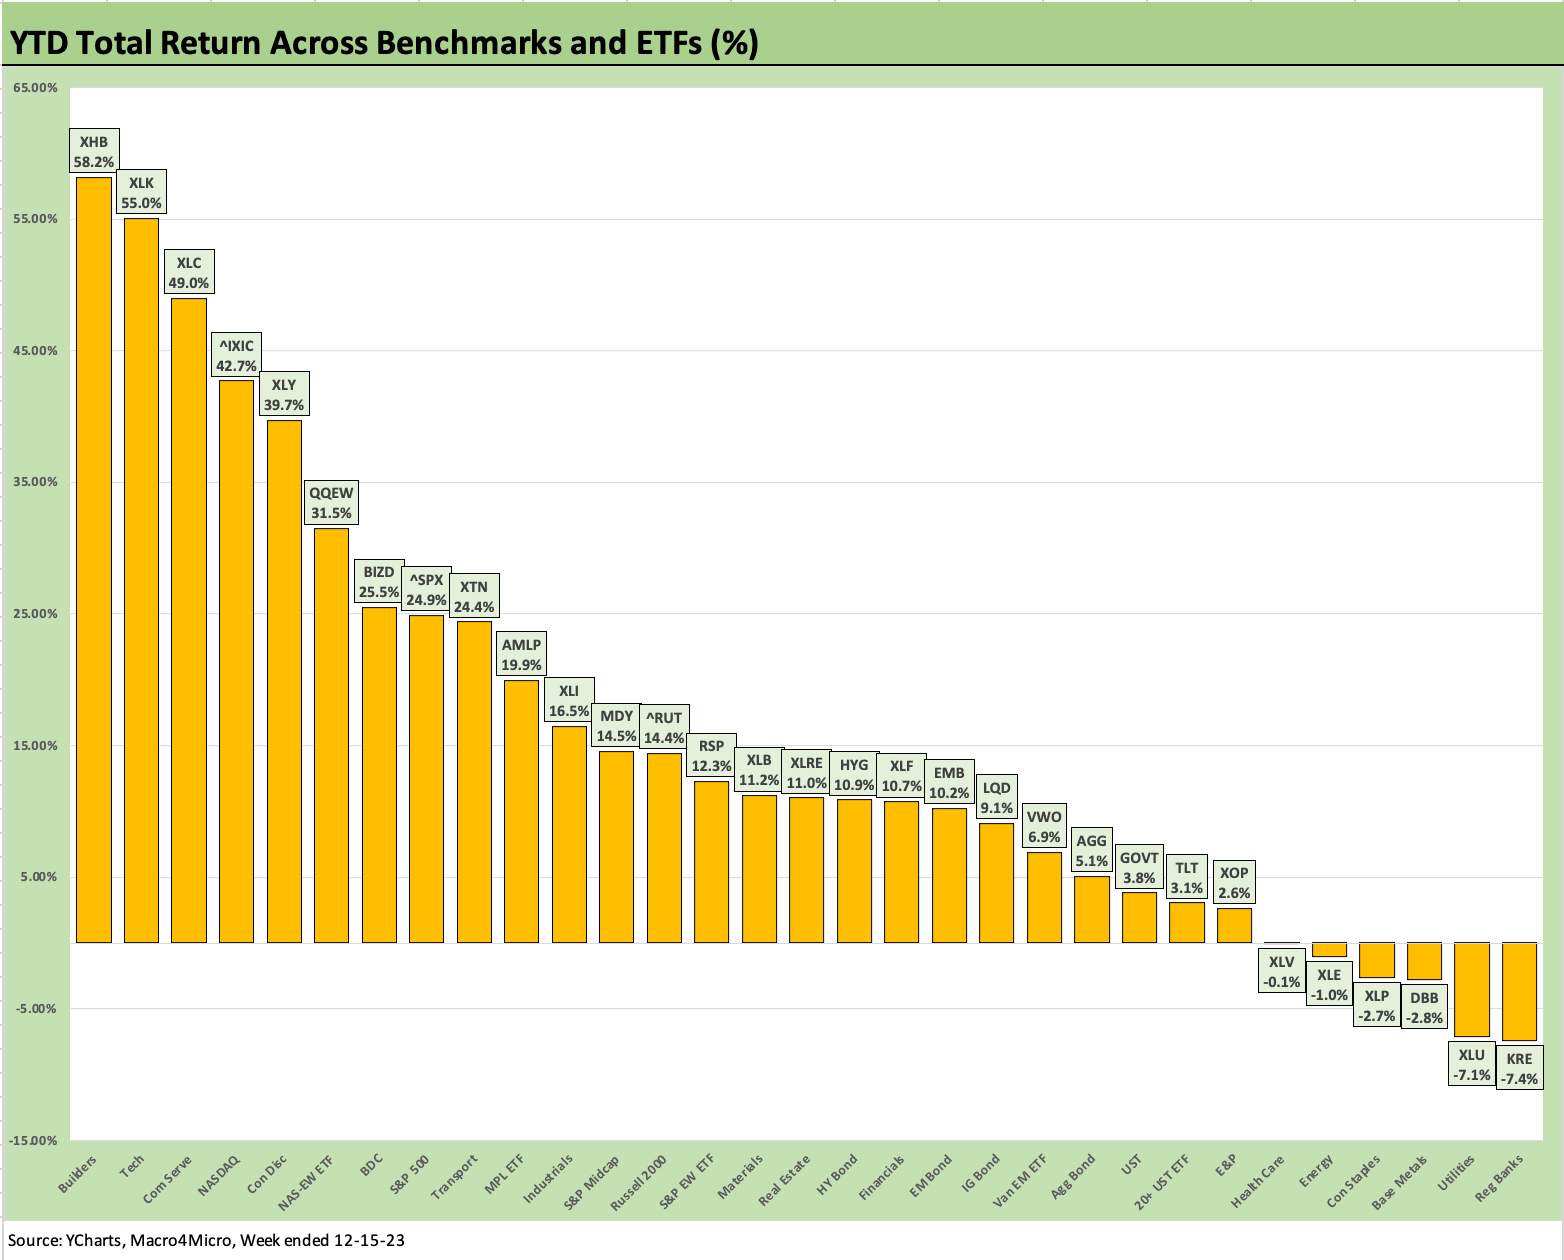
The YTD rankings have some real eye-openers on the “Who?” and “How high?” list since the highs are very high. The fact that homebuilders are #1 on the list with a +58% return, just ahead of the Tech ETF (XLK), was quite an achievement when considering mortgages hit 8%. After XHB, the next 5 ETFs or benchmarks are tech, tech-centric, or Magnificent 7 heavy.
The BDC ETF is still top quartile at +25.5% just ahead of the market cap weighed S&P 500 index and Transport ETF (XTN) and Midstream Energy (AMLP) with its less volatile earnings stream and high dividends. Both BIZD and AMLP pay out high dividends in line with their legal structures.
With a few weeks to go, we have a few major releases including PCE inflation this coming week with personal income and outlays. We also get another round of monthly housing stats as the XHB ETF tries to hold its lead vs. the wave of Tech benchmarks and ETFs right behind it.