Home Starts - Will Housing Nerves Infect Multifamily?
Starts/permits numbers raise questions on the forward supply of multifamily vs. single family supply/demand.
The housing market recession continues with sliding total permits down even more than housing starts, underscoring that builders are hunkering down.
While multifamily starts are up sharply, a double-digit decline in multifamily permits (5+ units) should be watched closely as that market – a robust one to date in 2022 – faces rising interest rates and some anxiety over valuation.
Multifamily is supposed to benefit from strained single family affordability, but higher rates and recession fears are hard to ignore.
The housing starts numbers have been less about whether the YoY numbers will decline (they will) but instead whether the starts decline will be above or below expectations. The material declines YoY will be here for a while. We looked at the historical timelines and median in detail last month (see Market Menagerie: Homebuilder Fits, Starts, and Permits), and the main themes are still in play this month.
The outlier that jumped out in this release was the sharp drop in multifamily permits (5+ units). The sequential decline was -17.9% and the YoY decline was -10.7%. The old rule that one month does not make a trend applies, but the drop does reinforce the idea that forward rental trends will be a tough call and income projections for properties more of a challenge to frame. Rising interest rates also typically shorten the real estate cycle and the valuation expectations face pressure.
The economics of multifamily properties and how that will dovetail with rent projections or “rent vs. buy” decisions is very sensitive to the macro top-down variables. The news on where apartment prices and rentals are heading is anything but set. In fact, the recent Redfin rental index is still up mid-single digits for November at 7.4%. That is the smallest increase in over a year, but it has room to decline without a major cyclical swoon. The debate over where the economy is heading and where the 10Y UST (key mortgage benchmark) will end up in 2023 is seeing a considerable amount of disagreement in the market. Dialing back permits would make sense. Multifamily starts and multifamily under construction are running at 2022 highs in November.
The chart below tracks the history of multifamily permits. The current run rate of 509K is still well above the long-term median of 381K. We also highlight the medians and highs and lows across various time segments from the 1960s through current times. The buildout of multifamily across the 1960s and early 1970s and in the 1980s after Volcker cracked inflation show some impressive peaks.
Overall, rising rates will do damage in the months ahead to valuations and prices, but a manageable housing recession and overall decline in most major macro variables (employment, manufacturing, consumer/corporate asset quality, etc.) does not have to be a long and dark tunnel. Reductions in permits is a leading indicator to more downsizing of balance sheets and investment ahead.
Hiding from a broader economic contraction in 2023 is going to be an optimistic outcome since higher unemployment and wage expectations cannot be jawboned away. It takes real layoffs. That said, the 2024-2026 optimism is still running high in the trade rags for rentals and more affordable apartments. The 2022 investment levels in multifamily highlights that confidence, but the yield curve is perhaps promoting some reassessment. That will take more data points ahead since this was just one month.
Multifamily sneezes: a light cold or something serious?
For multifamily, we already plotted the permits trend above. Below, we plot the long and wide-ranging history of multifamily starts. We see the bouts of major protracted downturns and demographically driven highs. As noted above, permits were off sharply, but the fact that 915K multifamily 5+ units under construction are running at +26.2% higher YoY takes the edge off that. 5+ unit starts were up +24.5% YoY to 584K. It not too early to be nervous about more weakness, but the absolute run rates now and the supportive intermediate term case for demand still holds.
The air pocket in multifamily permits does not change the fact that 2022 has been a very good year for multifamily as highlighted in the starts and construction underway. The earnings guidance and planning from the builders and Apartment REITs will be very interesting in coming weeks. Markets will stay on edge broadly due to the noise month-to-month on CPI and the Fed and what the flow-through to employment looks like. The calming factor is the multiyear shortfall in housing supply.
Single family downward trend stays the course…
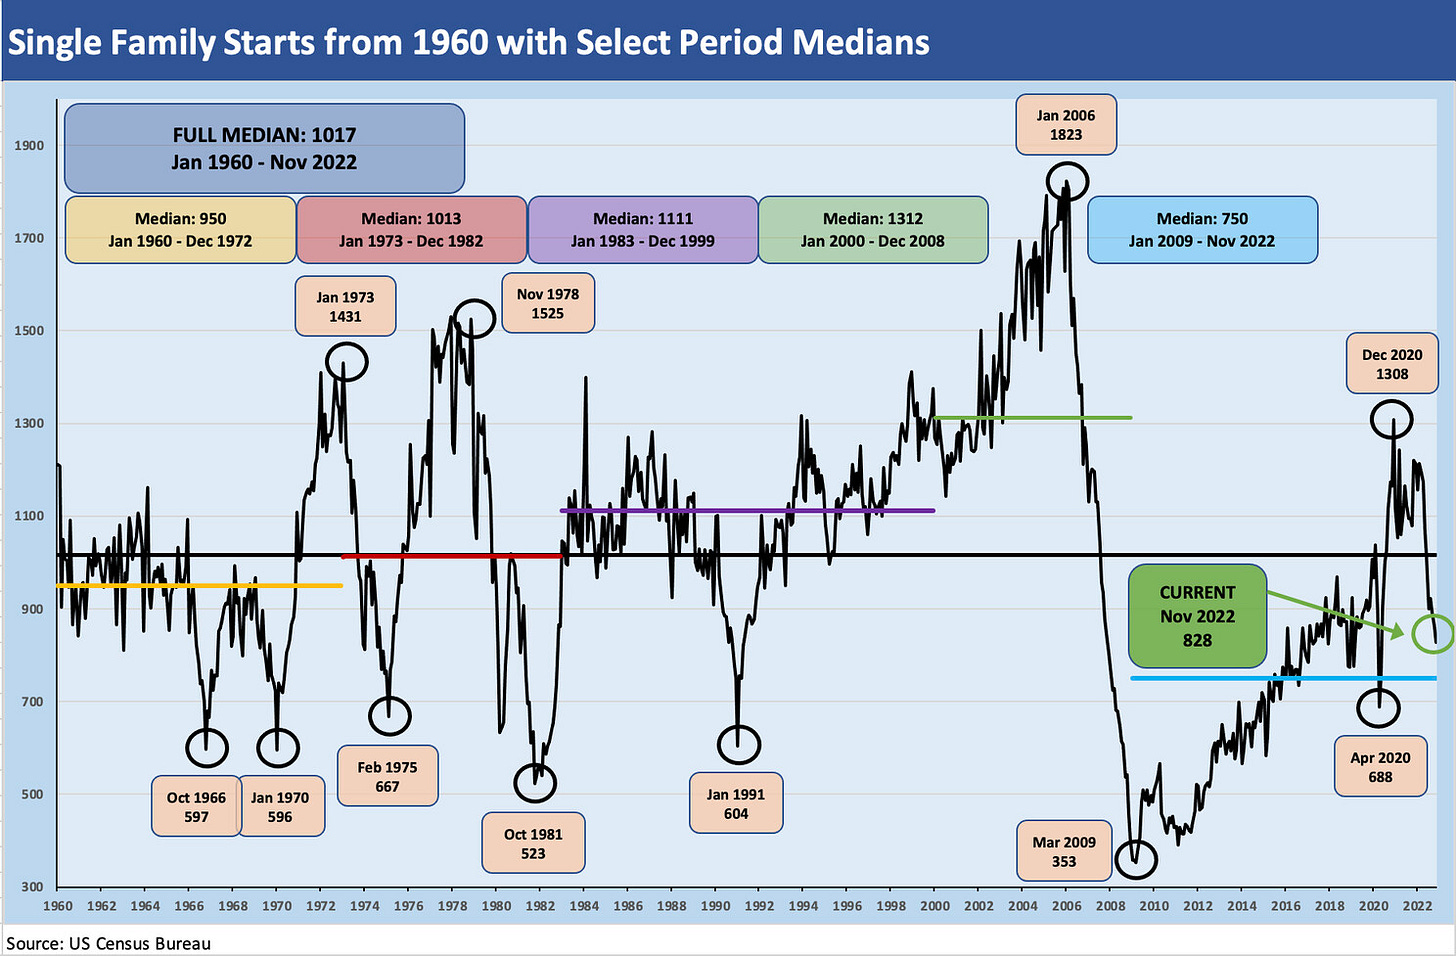
Below we update the long trend line in single family starts since 1960. The run rates now still pale in comparison to some earlier cycles. With rates higher, there will need to be a hit to the soaring home equity values in single family that we have seen in this post-crisis cycle. The trade rags are already full of stories of 2021-2022 vintage home sales that are underwater. The 3% handle mortgage rates that dominated the recent, pre-hike refi boom make for a very different monthly payment schedule, so the swing factor is price in an existing home sale.
There are quite a few 3% and 4% handle mortgages (and some 2% handles) locked in out there, but homeowners are less likely to sell into this market unless there is a specific need (see Market Menagerie: Existing Home Sales – Supply Swing Factor). The moving parts on home supply (new and existing) is going to complicate the assumptions on rental rates by regions. The newly employed will need a place to live. Where is that supply-demand balance going to play out in rental rates? That will be one more monthly data watch exercise.
Today’s markets vs. 2005 housing peak shows lower unemployment today…
The moving parts are not only around inflation fighting and the UST curve effects of mortgages (will the 10Y UST have a 3% or 4% handle by the end of the year? Or worse?) but also around how bad the employment backdrop will be. The old replay of “you can’t get a mortgage or a lease without a job” is still a reality, and the very strong employment picture runs counter to the idea of weaker rental demand. The 3.7% employment rate in November 2022 is well below the 4.9% that was in place at the end of the peak housing year of 2005. That was after starting the year at 5.4% unemployment. The Fed forecast for 2023 is for a 4.6% unemployment rate, which was considered full employment area during the later 1990s market boom. Mortgages in 2005 ended the year at a 6% handle. The market is only a small notch above that now. Home prices were obviously in a different zip code in 2005 than today.
In other words, there is some history here that contests the scenarios of housing Armageddon. Low unemployment and the chance for lower mortgage rates is supposed to be about a fresh debate on “How much house can I buy?” for consumers and the pricing and mix strategies of rental unit owners and homebuilders. Those issues will get fleshed out in coming weeks and builder earnings season. We will get an update on existing home sales on Wednesday.
Construction in progress still buys the economy some time…
The fallout from the Fed tightening takes time to flow through. In the meantime, the high construction rates keep some of the worst of the multiplier effects out of the economic picture near term. Single family construction in progress shows an economically vibrant placeholder for homebuilders and suppliers on a current run rate. The big swing factor into peak selling and building season will be about employment and mortgage rates. Total homes of all types (single family and multifamily) are up +14.5% YoY, so the construction teams are busy. Most of the increase is in multifamily at +26.2%.
The fear of a topping and adverse trend in 2023 is understandable. The 2024-2026 rebound in rentals is a common theme, but the 2023 variable across rental assumptions are being battled the same way we see in disagreements between the market and the Fed on inflation and the state of the economy (see Fed Funds vs. CPI: Narrowing of the Gap).
The Freddie Mac Multifamily Apartment Investment Index has posted a weaker trend line all year despite growth in Net Operating Income and still resilient Property Price Growth in over half the markets. The index dropped by 5.4% in 3Q22 sequentially and -23.5% YoY. That -5.4% came after dropping by 11.7% in 2Q22 and -17.9% YoY. The income trends remain solid (but a mixed range across areas). Higher rates and slowing property price trends get cited as the negative drivers.
The flavor from the trade rags is more about the “slowing” and weaker investment economics on higher rates. Very low unemployment and housing shortfalls still arm the more optimistic market watchers who can see a soft 2023 but solid fundamentals on the other side of a cyclical weakening next year. All those employed people need to live somewhere. Demographics and supply-demand profile support longer term optimism. The affordability shock is the enemy short term.


