Footnotes and Flashbacks: Week Ending May 28, 2023
The debt ceiling process has higher hopes that the “splinter groups” scenario might actually work out after all.
"Damn that's a lot of debt."
This Week’s Macro: Debt ceiling dynamics; asset returns; yield curve migration and deltas; BBB vs. BB quality spreads.
This Weeks’s Micro: Homebuilders still feeling the love.
MACRO
The debt ceiling drama is not over yet. Biden and McCarthy struck a deal that they now need to take to their respective parties. We anticipate a lot of complaining, loud objections, and triple-jointed posturing from here on. The wacky left and crazy right need to make sure they can point to their strenuous objections later as they seek to satisfy their voting groups – whether the “Progressives” (known as Anti-gender Marxist Maniacs to the Hard Right) or the MAGA-heads (known as Neofascist Insurrectionist Racists to the Far left). It is a warm and fuzzy environment in Washington.
When I was little league age watching political conventions on the rabbit-eared black and white TV in 1968, I did not think it could get weirder, but the political freak show in Washington has most definitely dipped below those depths. My father voted for Nixon, my mother voted for Wallace, and my older sister thought McCarthy was the greatest. Ah, the memories of youth.
From here, the end game presumably is to get the “sane” 75% between the extremes (or is it down to 60%?) to push the agreement through. The hope is that the Progressives complain bitterly. Whether that anger is sincere or a part of psyops, gripes from the Left will likely promote votes from the Right. That said, we expect no votes from the hard core Right and the AR 15 crowd who are too busy impersonating Private Pyle in the mirror (“there are many others like it, but this one is mine…”).
The good news…
The ability to get a 2-year reprieve on the debt ceiling was better outcome than many expected and will allow the Biden team to redeploy without facing a disorderly rout and the need to deal with emergency economic conditions. The rational right can move on with their plans for election priorities. They will have a better shot to win back independents than they would have had after a default crisis and self-inflicted wound by the GOP.
The “blow it all up” Right will now either disrupt Congress or realize that their spell may be broken as they lost their last chance for a cataclysm until after the election. We can dare to dream that a group of center-right and center-left House Reps can see eye to eye on some legislation. If this bill gets a bipartisan house vote with more GOP than Democrats and a lot of Nays from the Left, the precedent would be the Clinton administration years in the 1990s. That might be too much to expect in the age of clone voting and straight party line requirements.
If the debt deal clears the hurdles this week and gets past the House and Senate, the market can then take solace in the “low bar” of not facing an imminent default threat until after the next election. That was a priority and odds are now much better to clear Congress and the Senate. If we would pick the one thing that was better than a rational person would hope for, it would be the two-year hiatus in default threats.
What happened?
We looked at the sad state of affairs in last week’s issue (see FOOTNOTES AND FLASHBACKS: Week Ending May 21, 2023 ), and the main context was the hard liners had signed off terms that could not conceivably be accepted outside of a political Jonestown pact by the Democrats. There was no chance the bulk of the proposed terms could be accepted. Biden could not run if he accepted those terms, and he would have seen a real Progressive opponent surface. He also would have been hit with the “Hillary effect” as many Progressives stayed home (after her Bernie Sanders issues).
The scenario that played out over the weekend was the positive splinter group scenario. We did not dare think that would work in our last comments (“The center-Right stays quiet but toes the line even though they might be the best hope. Alternatively, the center Right can join in on something that saves the day and gives some concessions.”). I admit I set that outcome at lower odds.
The risk was Speaker McCarthy would serve as an obstacle to that outcome given his rhetoric. We can only guess what was driving his game plan after he was held hostage by the Right in the Speaker vote. A single vote can make a “motion to vacate” so that left him exposed to aggressive action by any one of the hard cores. That will be an event to watch from here. That sort of embarrassing disruption would spill over into the primary season and create a lot of chaos for the GOP. It would seem dumb, but the extreme GOP players are not exactly on NASA’s recruiting list.
It seems like McCarthy picked the lesser of two evils since that crowd does not appear to care about him and even dislike him. McCarthy would inevitably have been tagged as the man who made America default. He forced Biden to the table by getting the bill passed and that required the extremists on board for the finishing touches. Whether the hard right will feel “played” remains to be seen and their response could get ugly for McCarthy.
The ability to get enough votes from Democrats is enhanced by the absence of disaster in the bill terms and a semi-clean run into primary season and the potential for winning or retaining independents. The hard liners in the GOP get disproportionate attention given the small majority in the House. In a floor vote across parties, their numbers are small. The Progressives may draw straws to see who gets to vote against it for branding purposes, but the numbers should be there across both parties. There is talk of committee games and legislative committee tricks in the House and Senate, so the next few days will be important to say the least. I may get my June 1 and June 6 T-Bill maturities after all.
Comparative Asset Returns…
Below we run through a range of market benchmarks and proxies for asset class subsectors and industry groups. Much of the market action has been transfixed by the debt ceiling and related handicapping of outcomes. The asset performance showed a mix of indecision with more than a few days of flying lazy circles around the topic. We saw some small equity moves on relatively constructive cyclical data in a range of industries as we lay out in the ETF performance review further below.
The above chart updates some of the benchmark asset returns for debt and equities across a range of trailing time horizons. We line them up in descending order of total returns over the trailing 3-month period. The past month still shows a relatively grim set of returns in debt with all four asset class subsectors in the red. Duration was negative this past week with negligible moves in spreads in IG or HY.
Looking back 3 months, there is little excitement but at least all are positive with UST in the lead at 1.42%. In other words, recently credit risk has not paid off with the post-SVB UST migration as one of the key movers of the UST curve (see yield curve charts below). On a YTD basis, US HY is the only debt asset class to score north of a 2% total return at +3.3% with the January rally still being a key stretch for US HY after the material widening in Dec 2022.
In equities, it is the same old song with growth stocks and tech the big rebound story and S&P quite respectable for the range of 2023 time horizons across 1-month, 3-month, and YTD. Tech is crushing it as seen and heard every day with NVIDIA dominating the headlines over the past week.
The above chart updates the 1500 and 3000 series with the trend line underscoring the poor breadth of the stock rally, the material outperformance of tech and growth vs. value, and weakness in financials, real estate, and energy. On a 3-month basis, we see a 23 point Hi-Lo total return differential between Russell 3000 growth and S&P 1500 financials. Over 3 months, we see only Growth in positive territory. Russell 3000 value is negative each time horizon presented back to 1 year.
ETF and benchmark index returns…
Below we look at total returns over the trailing 1-week, 1-month, and 3-month periods for 24 categories of industries, asset class proxies, and broader market benchmarks. That covers a wide range of industries and fixed income assets for perspective on the rolling time horizons.
1-week ETF returns…
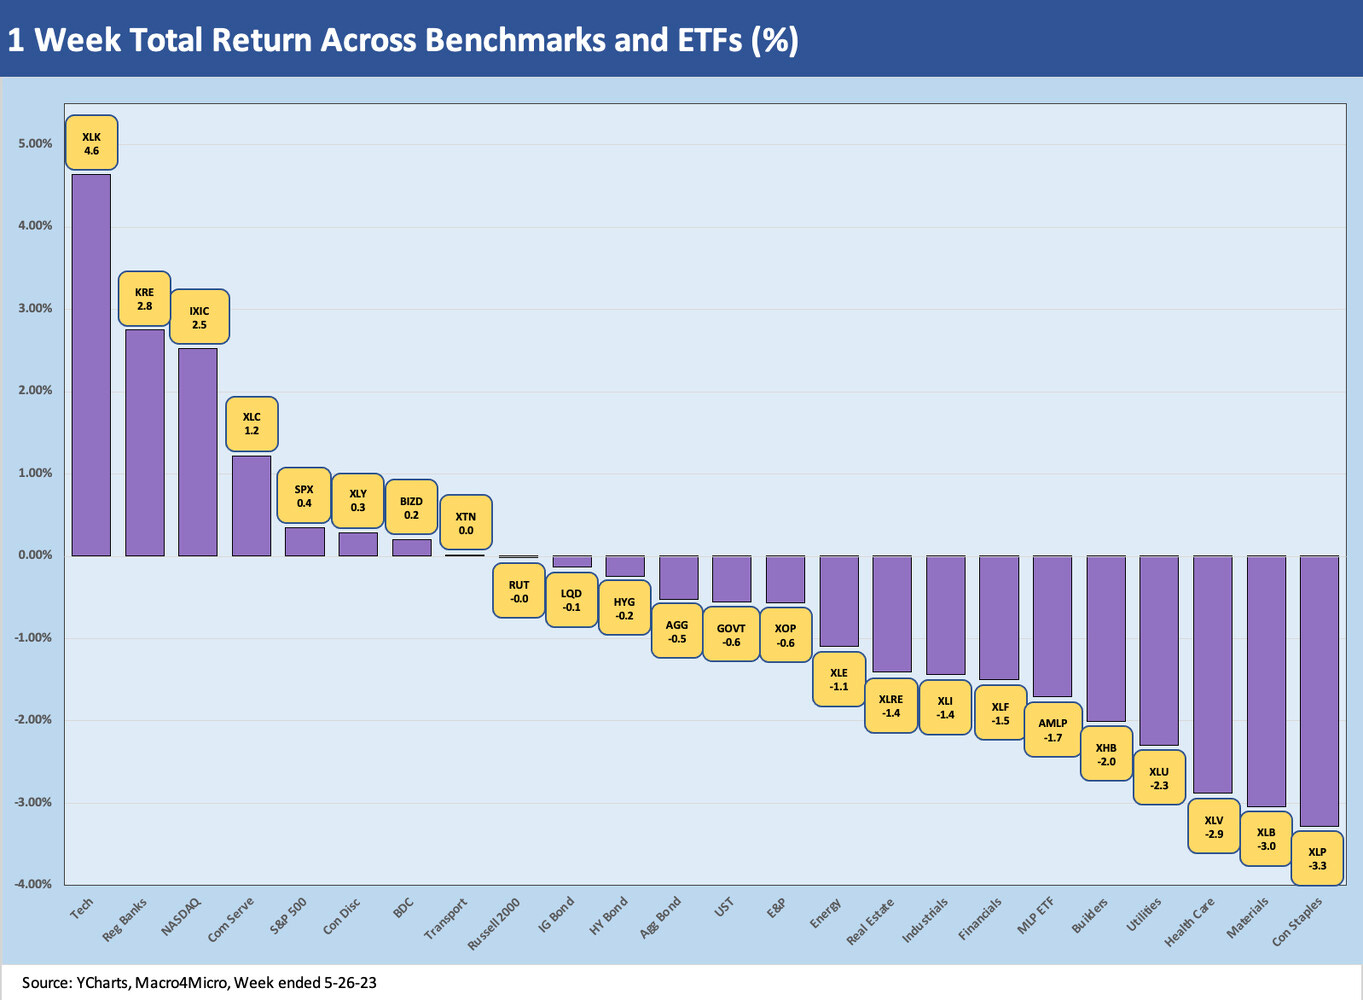
For the 1-week period, we see 16 of our usual ETF sample groups negative but with more muted negatives than we usually see on the right of the bar chart. The negative duration effects left a cluttered group of marginally negative fixed income proxies in the middle of the chart to the negative side of zero.
The right side of the chart was a mixed group of consumer, defensive, and industrial categories while Regional Banks (KRE) climbed to #2 wedged between #1 tech and #3 NASDAQ. Only 4 ETFs beat 1% on the week as the world waited for some good news on the debt ceiling, which it got on the weekend.
1-month ETF returns…
The 1-month results show the balance more evenly split with 11 positive and 13 negative and regional banks (KRE) even crawling up into the bottom of the third quartile at -2.1%. The trailing 3-month (next chart) still sees KRE getting its own penalty box at -34% to avoid distorting the chart. It is difficult to say how the regional bank names would react to a UST default, but the sustained high short UST rates is not going to help either way.
We highlight that the fixed income ETFs (HYG, AGG, GOVT, LQD) are sitting in the negative return zone on the ETF chart above with duration framing up worse than credit risk. The large Diversified Energy ETF is sitting on the bottom at -5.7% with the E&P ETF faring better on the month toward the middle and just shy of zero in the negative zone at -0.4%.
AMLP broke into the positive range with its less volatile earnings stream and some renewed focus on consolidation and potential infrastructure benefits out of the debt ceiling deal. Favorable terms for energy projects were confirmed over the weekend. That will set off many on the Left, but maybe that can help the deal get some more oil patch votes in the debt ceiling battle. Unsurprisingly, Tech is a big winner with Communications Services and NASDAQ rounding out the Top 3.
3-month ETF returns…
The 3-month ETF numbers split 12-12 on negative and positive with the lingering regional bank crisis still showing KRE in the isolation ward at -34.1%. The Financials ETF is second to last at -9.5% with asset quality debates and net interest margin squeezes leading the chatter even for the large banks. The recent patterns around Energy and small caps are in evidence on the right with XOP, XLE, and RUT rounding out the Bottom 5.
Similar outperformers to the 1-month are leading the 3-month with Tech (XLK), Communications Services (XLC), and NASDAQ followed by the S&P 500 and the Consumer Discretionary (XLY) with its heavy mix of Amazon and Tesla. Just below the Top 5 is the homebuilder ETF at +5.5%.
Yield curve migration…
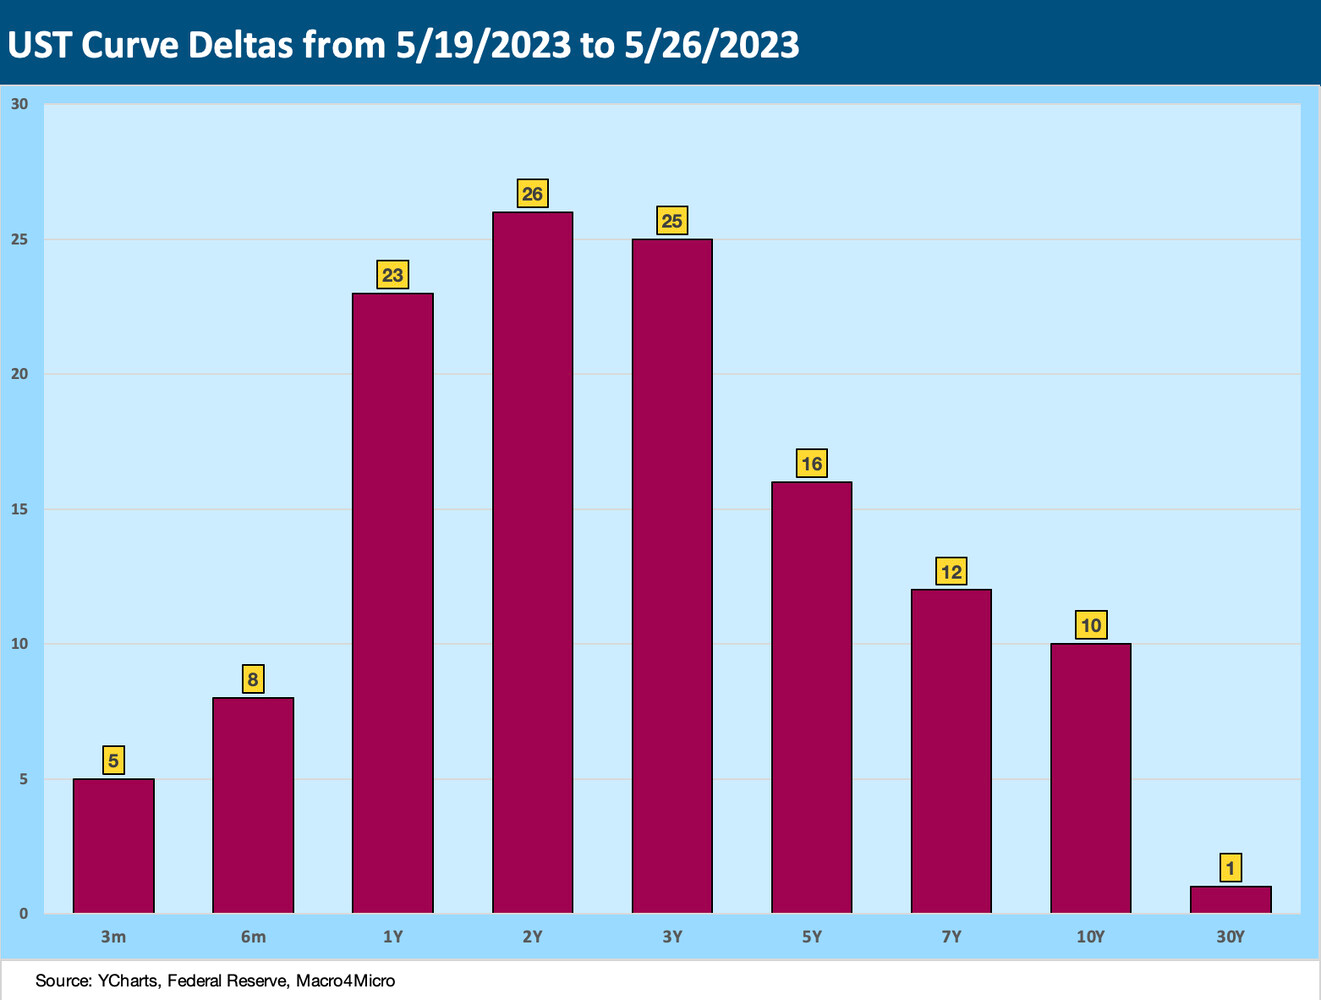
The above chart plots the UST curve deltas for the past week as we saw another stretch of UST curve elevation in double digit range from 1Y out to 10Y with a flattening pattern from the 1Y to 3Y vs. intermediates 5Y to 10Y. With the 10Y higher, the 30Y mortgages rates are back to flirting with the 7% range in recent days.
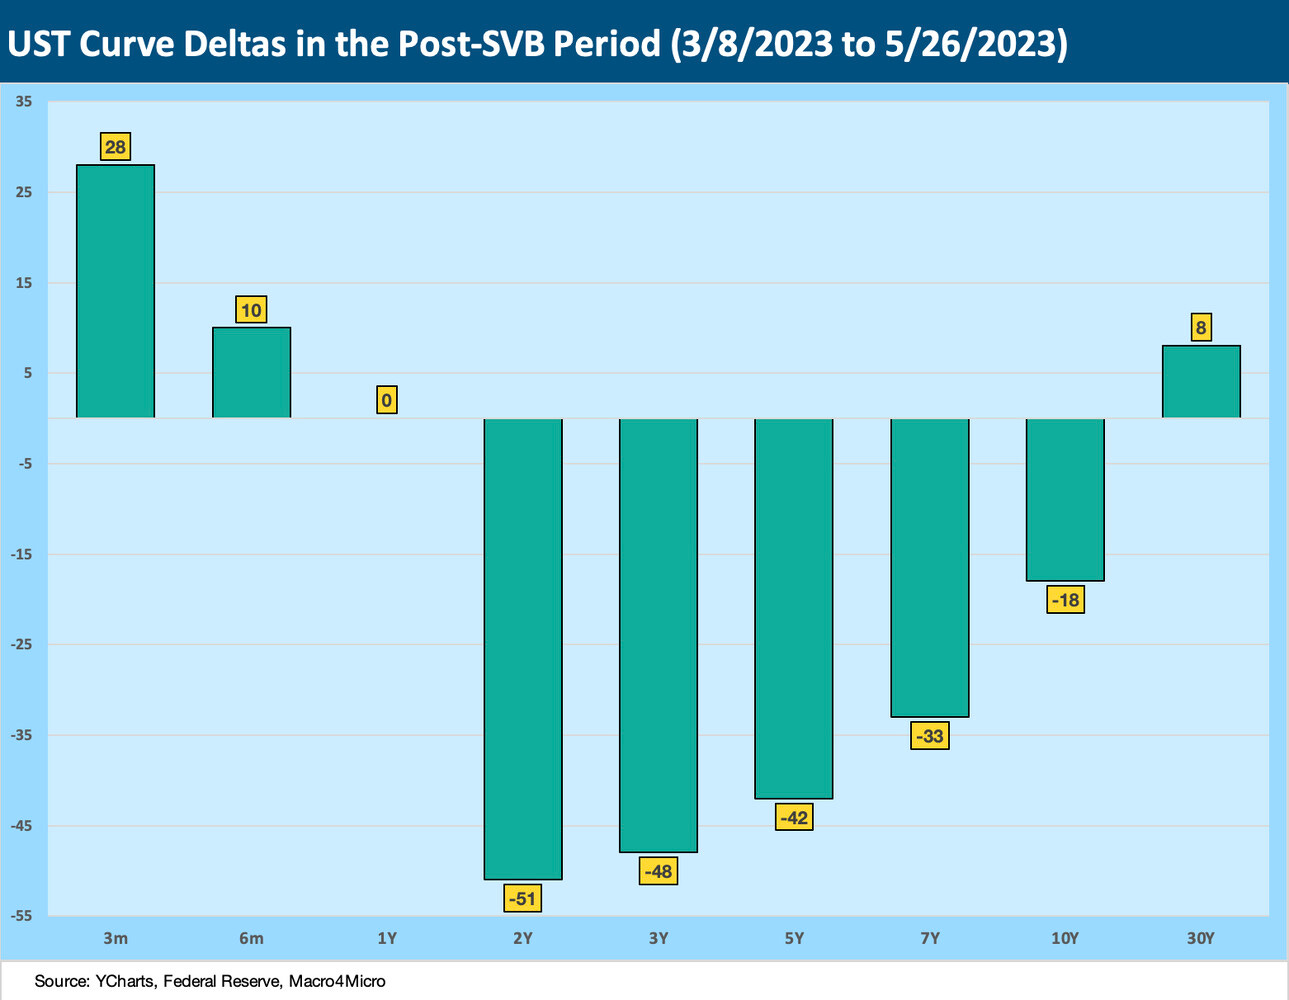
The chart above updates the post-SVB UST yield deltas across the curve. The pattern has been part of a steepener with some recent partial reversals this past week. The front end has had to contend with effects of debt ceiling nerves and pressure on the shortest yields on the UST curve.
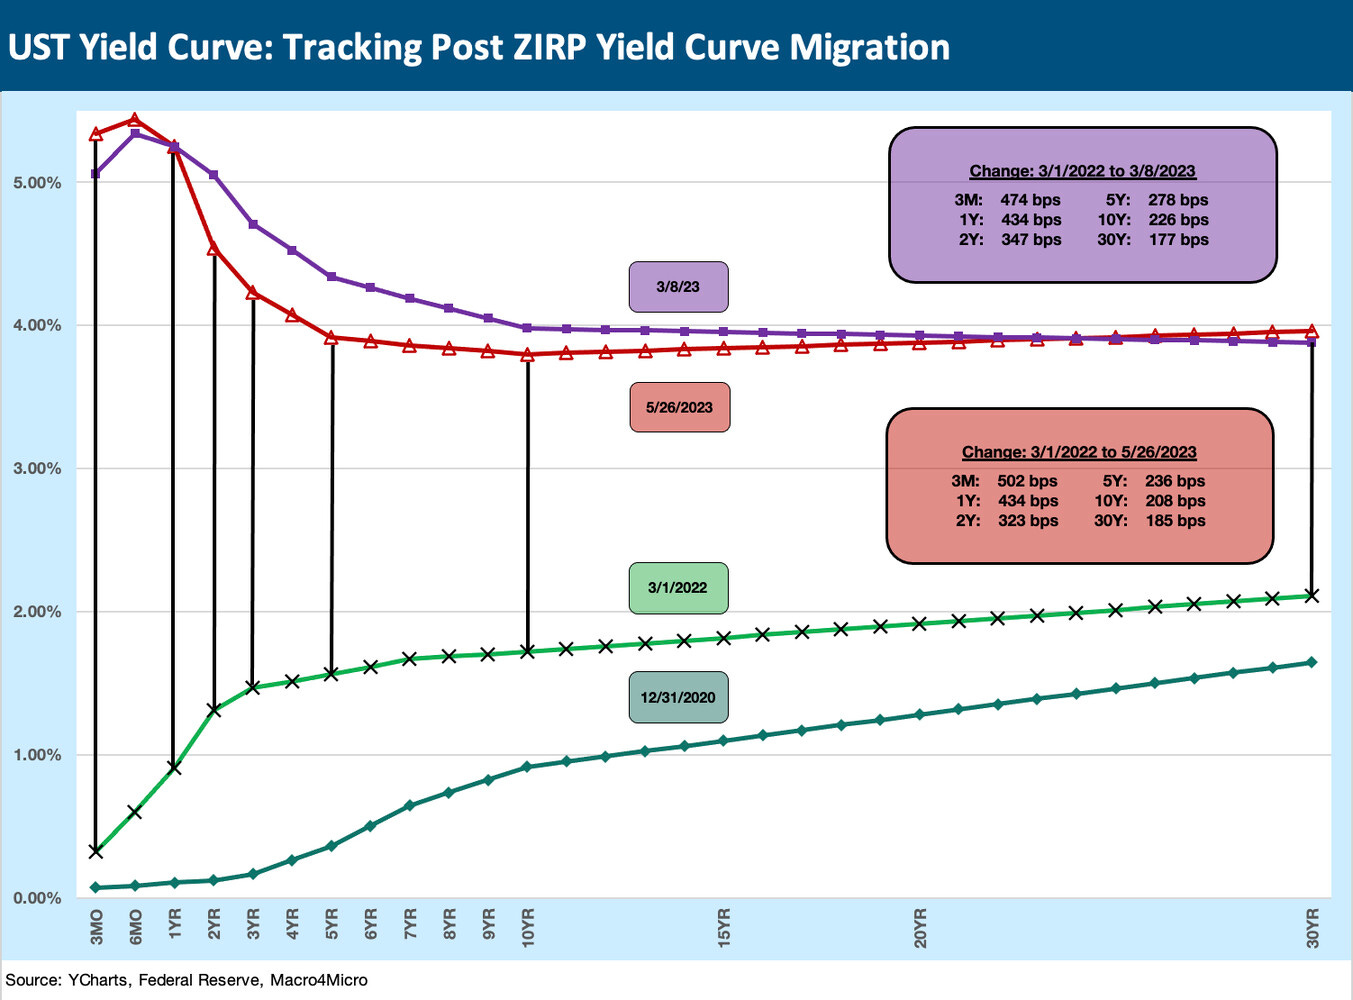
The above chart updates our usual details on the running UST migration since ZIRP ended in March 2022. We start the series on March 1, 2022, but ZIRP officially ended with rate hikes in mid-March 2022. We also include the 3-8-23 yield curve with the details in the upper right box. We had been viewing that as a good proxy for where much of the UST curve peaked (a notable exception was the 1M UST as x-date approached). We now see the yield curve moving back in that direction the past two weeks. The reaction of the UST curve to any finalization of the debt ceiling deal could keep the streak alive and get the stock market excited. We will brace for the noise.
The above chart updates the visual of the post-SVB yield curve shift. The biggest shift has been in the 2Y to 5Y area. The past two weeks have been reversing some of the downward shift.
Quality spreads for the BBB vs. BB tier…
The above chart plots the BB tier OAS minus the BBB tier OAS since the beginning of 2022 through Friday close last week. The recent differential of +122 bps is just on top of the median differential for the time horizon shown since Jan 2022.
We also include the details on the long-term BB-BBB differential from 1997, which is +138 bps. In other words, the quality spread pickup from BBB to BB is now tight to the long-term median despite the Fed tightening cycle and ongoing questions around the credit cycle and economic contraction risk.
That is a show of confidence in the credit markets durability or perhaps relief at actually being able get remotely rational bond yields regardless of the relatively tight spreads and skinny proportionate risk premium.
MICRO
The past two weeks saw a wave of housing crosscurrents (see New Home Sales: Volumes Up, Median Prices Down 5-23-23, Existing Home Sales: Will the Party Start? 5-18-23, Home Starts and Permits: Performing with a Net? 5-17-23). We also saw a bellwether high price builder reporting results (see Signals and Soundbites: Toll Brothers F2Q23 5-24-23). We found the Toll Brothers earnings call and results especially interesting despite their traditional focus and brand value as the kings of luxury.
The Toll management team on the call ran through their top-down view of the supply-demand imbalances, and how that has continued the shift from existing home sales to newly built homes in the total home sales mix. There was not much new in the theme itself, but they framed it into the hard numbers of what is going on in the market now, and how the same trends apply to their markets with over $1 million price tag average in their backlog. The mix of the golden handcuffs on low-cost mortgages for existing home sales and the improving supplier costs and supplier chain functionality have helped on the margin front.
The low cancellation rates for Toll were in part a function of heavy nonrefundable deposits, but Toll also showed the “money where your mouth is” commitment seen at other builders where they keep building more spec homes to have inventory ready for the current peak selling season.
Just for a frame of reference, we compare Toll stock above vs. Pulte (PHM) since the start of 2019. We also include the homebuilder ETF in the comparison. Both are in the IG index now, and both rank in the Top 5 in average home price of the 15 names we watch (Toll was #1 and Pulte #5 in the ASP comps). Both are major national players, but PHM is larger and more diversified by product segment. TOL is considered a premier player in its space, but other names are drawing more interest for the potential upside in volume and especially if mortgage rates moderate. The problem is that mortgage rates went higher of late – not lower.
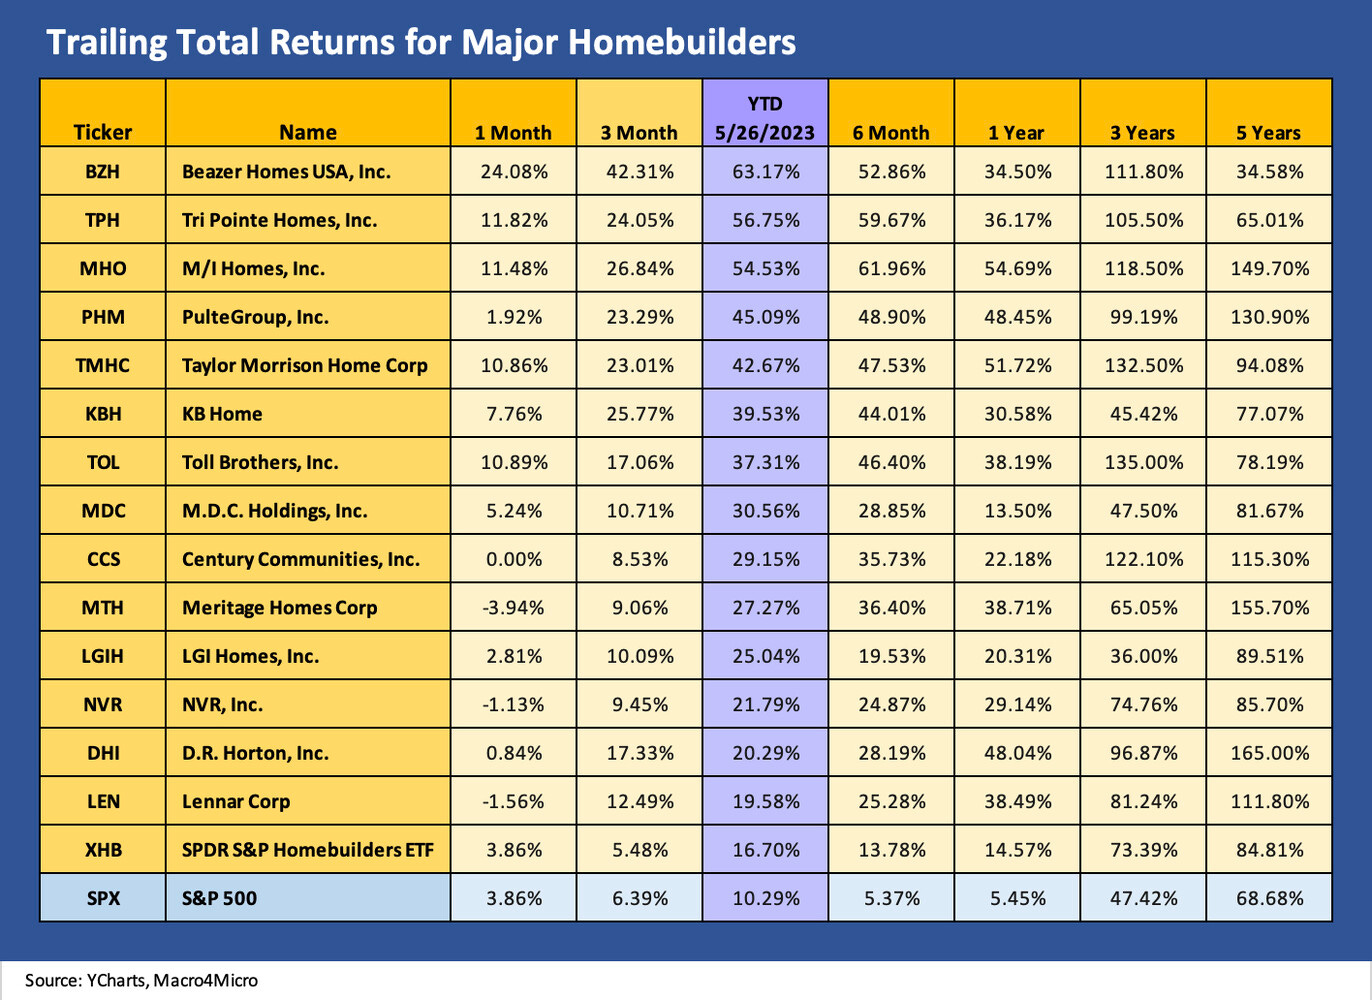
We take one more cross-peer group look at trailing equity returns for the homebuilders. We look at the builders equities across a range of total returns and line them up in descending order of returns on a YTD basis. Toll popped last week after its numbers beat expectations and the color provided on their call added to the positive tone and is up over 10% for the trailing 1-month period. Those are some very strong numbers YTD for the group in absolute terms and in relative terms vs. the broad market.


