
Home Starts and Permits: Performing with a Net?
With the spring selling season now colored by the debt ceiling, the range of potential outcomes is still daunting.


With a slew of restatements back to 2017 with this month’s release, the main event is still the sequential trend and the forward-looking exercise.
We look at the dazzling equity rally in the builders YTD and the past year and ponder what a default action would mean for new residential construction with the UST curve uncertain, the employment picture under a cloud, and serious questions about what mortgage lending standards would look like in a default backlash.
For the immediate drill on the starts release, permits posted a slight decline sequentially and starts a small uptick in a set of numbers that did not move the needle in handicapping what lies ahead.
In this commentary, we update the starts and permits details for the Census new residential construction release. We offer some quick thoughts on the debt ceiling craziness and then roll into a review of how the homebuilder equities look YTD and across a range of trailing time horizons. So far, the stock performance is a real eye-opener for those who might not have been following them closely.
One of the ideas worth considering is whether the potential for volatility in the UST market ahead has a silver lining for homebuilders. If the turmoil ahead on the debt ceiling ends with a hard landing or recession of some magnitude, does that kick start pent-up demand on lower mortgage rates and lower monthly payments? That is the equivalent of “performing with a net” in this political and economic high wire act.
We should flag upfront that the Census data did one of its major restatement exercises for starts and permits back to April 2017 and April 2018. We include the trailing LTM revisions in those charts below. The earlier revisions did not appear all that material at a glance, but we will review those and get those inputs rolled into the charts later in the interest of getting the past year updated and getting this update published. Nothing from those earlier years changed anything in our fundamental view or multi-cycle perspective.
With the spring selling season upon us and questions around where mortgage rates might go from here with such a wide range of scenarios spinning to engage in, we remain constructive in where the builders might head from here. In last month’s note we framed the working capital issues and increased use of spec building to have more move-in ready homes in this very strange housing downturn (see Housing: Starts and Permits and the Working Capital Challenge 4-18-23).
During April, the level of units under construction not seasonally adjusted increased slightly for single family (declined slightly on a SAAR basis) and they moved higher for 5 unit multifamily both not seasonally adjusted and on a SAAR basis. Units completed moved lower for total and for single family and for 5 units (both SAAR and not seasonally adjusted)
A major new ingredient to speculate about in the debt ceiling mega-variable…
After the sharpest rise in mortgage rates and most dramatic upward migration in the UST curve since the Volcker years, the prevailing winds are swirling again, but the homebuilders have really done well as investors look ahead in their valuation exercises. Below we look at some stock performances before we get back into the weeds of the new residential construction details (aka the “starts” release.)
As we get into framing the direction of fundamentals in the housing sector, one thing one should NOT say is, “Based on my prior experience with a UST default by the United States as a sovereign credit…” (we don’t count Nixon unilaterally abandoning Bretton Woods and the gold standard, which was arguably a breach of sorts for international investors). This is all new scenario spinning and ChatGPT cannot be consulted for a good answer (especially with Trump’s voice or it might keep skipping and repeating “default, default, default…”).
How the debt ceiling meltdown would frame out for mortgage rates (likely lower after some insane turmoil to start) is one small slice. Lower UST would mean lower monthly payments, but there is the question of mortgage credit availability (fear of millions of lost jobs and a very hard landing) and what such an outcome would mean for existing home supply, foreclosures, etc. Monthly payments rule the economics of buying a home with credit, but having a job usually helps as well! We might assume the all-cash buyer might decide to wait if chaos unfolds and wait to the hard landing to get harder.
You can roll your own scenario, but there is a very good chance the aftermath would not view the UST as a “flight to quality” with the annual budget battle and election year dynamics (finger pointing, daily toxicity, recriminations, international tensions, etc.). That is a lot of moving parts, including some positive (supply, lower rates) and negative inputs from the homebuyer to the builder to the supply part of the equation with the existing home seller. The rent vs. buy tradeoff would also see the economics shift and the plot thicken.
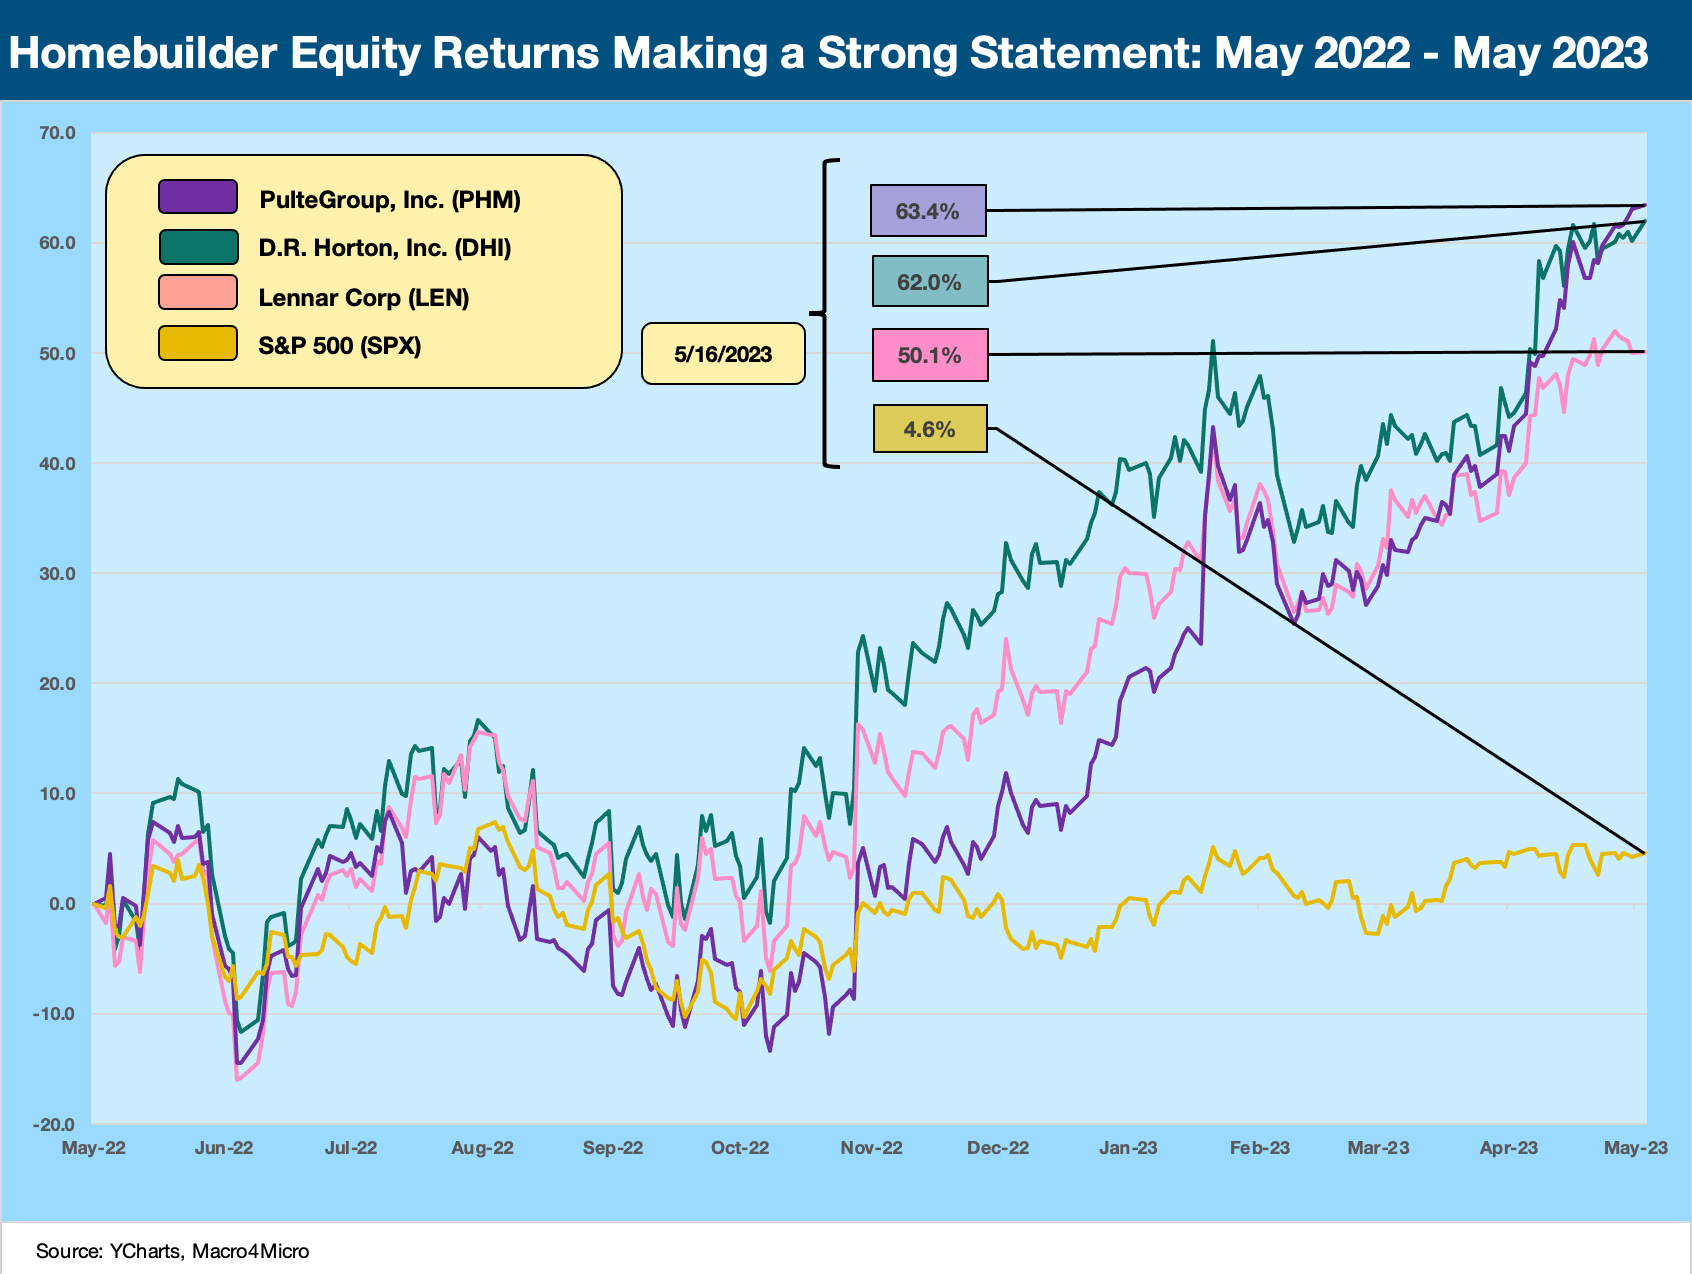
The above chart plots the trailing LTM total returns on the equities of the three largest homebuilders: D.R. Horton, Lennar, and Pulte. We plot those Big 3 against the S&P 500 and the major builders have been dramatic outperformers. In the interest of disclosure, I bought D.R. Horton and Lennar in early 2022 as a long-term holding. That has been a wild ride lower in early 2022 and big bounce higher after.
The dynamics looking out a few years for such names is very favorable. We looked in detail at D.R. Horton in a recent in-depth credit profile (see Signals & Soundbites: D.R. Horton 2Q23 4-21-23). We also did a brief update on Pulte after 1Q23 earnings (see Signals and Soundbites: PulteGroup 1Q23 4-25-23).
Considering where mortgage rates headed since last spring and how ugly YoY volume trends have played out, that rebound offers a stark reminder of how investors are in a forward-looking mode around how to value builders. The greater awareness of the cash flow dynamics of the industry and the changing “behavior” patterns of mortgage credit vs. the last cycle are helpful.
The main event is still the supply-demand imbalance and intermediate shortfall of supply from demand for housing. The supply side of existing home sales historically makes up around 90% of home sales but less in recent months with existing home sales stalled. The net effect is helpful for new homebuilders in terms of inventory availability. We have covered all that in past commentaries and do not need to belabor those structural issues for builders.
Homebuilding is a “price times volume” business while keeping an eye on costs (labor and supplier chain). The good news is that volume has stabilized, and prices are still strong enough with the inventory supply-demand overlap supportive. Existing home sales help the builders given the much-discussed “golden handcuffs” (i.e., low mortgage rates of potential sellers) that keep supply down. Supplier chains are better but labor remains very tight in construction occupations (see Construction Spending: Demystifying Nonresidential Mix 5-9-23).

The above chart adds a larger mix of major peers and more trailing time horizons, and the broader group of builders have done quite well vs. the market by any measure. Even looking back 3 years and 5 years tells a good story for builders vs. the broad market. Each builder on the list has a product mix and geographic story line, but DHI, LEN, and PHM cover the greatest breadth of price tiers and regional mix. Toll Brothers captures the luxury tiers and LGI Homes the lower tier pricing but with Texas-heavy flavor.
April 2023 starts and permits by the numbers…

The above chart plots single family starts across the longer time horizon since 1960. We have discussed this history often, and the main takeaway is the unusually low rates of building in a market with record population, record payroll, and favorable demographics.
The current rate of 848K (SAAR) in April ticked up from March 2023 but is still -28.1% YoY. The multifamily sector is still rolling along at +5.2% sequentially but at -11.7% YoY. The biggest increase in single family was the West at +59.5% sequentially but down -29.2% YoY. The critical, largest region of the South was +34.6% sequentially.

The above chart plots permits vs. starts since 2021 but is not seasonally adjusted. Total permits ticked down on the balance of slightly higher single family set against a more meaningful decline in 5-unit multifamily. Starts were higher in total with single family more notably higher and 5-unit starts also higher.