Existing Home Sales: Will the Party Start?
We look at a weak set of existing home sales numbers despite some silver lining market color.
"I know some buyers will show. Not sure about the sellers."
The seemingly upbeat “tone” of the NAR release on existing home sales trends seems to want to add a little more of the optimism that the market has been feeling in new home sales, but the fact remains sequential volumes declined from March in all four major regions and inventory ticked up.
The desire to cash out a large base of home equity understandably remains high for many homeowners, and especially for those with plans that do not intrinsically require a new mortgage on the other side of the trade (i.e., less “golden handcuffs” barriers).
The flip side of volume declines was more multiple offer deals, shorter timelines on the market sequentially, and still half the country seeing higher sales prices.
Today we got another big slice of the home supply-demand picture after the starts and permits from yesterday (see Home Starts and Permits: Performing with a Net? 5-17-23). The flavor of the language from the NAR was positive in some respects (more multiple offers, shorter time on markets, etc.) despite the objective reality of a sequential downtick in numbers.
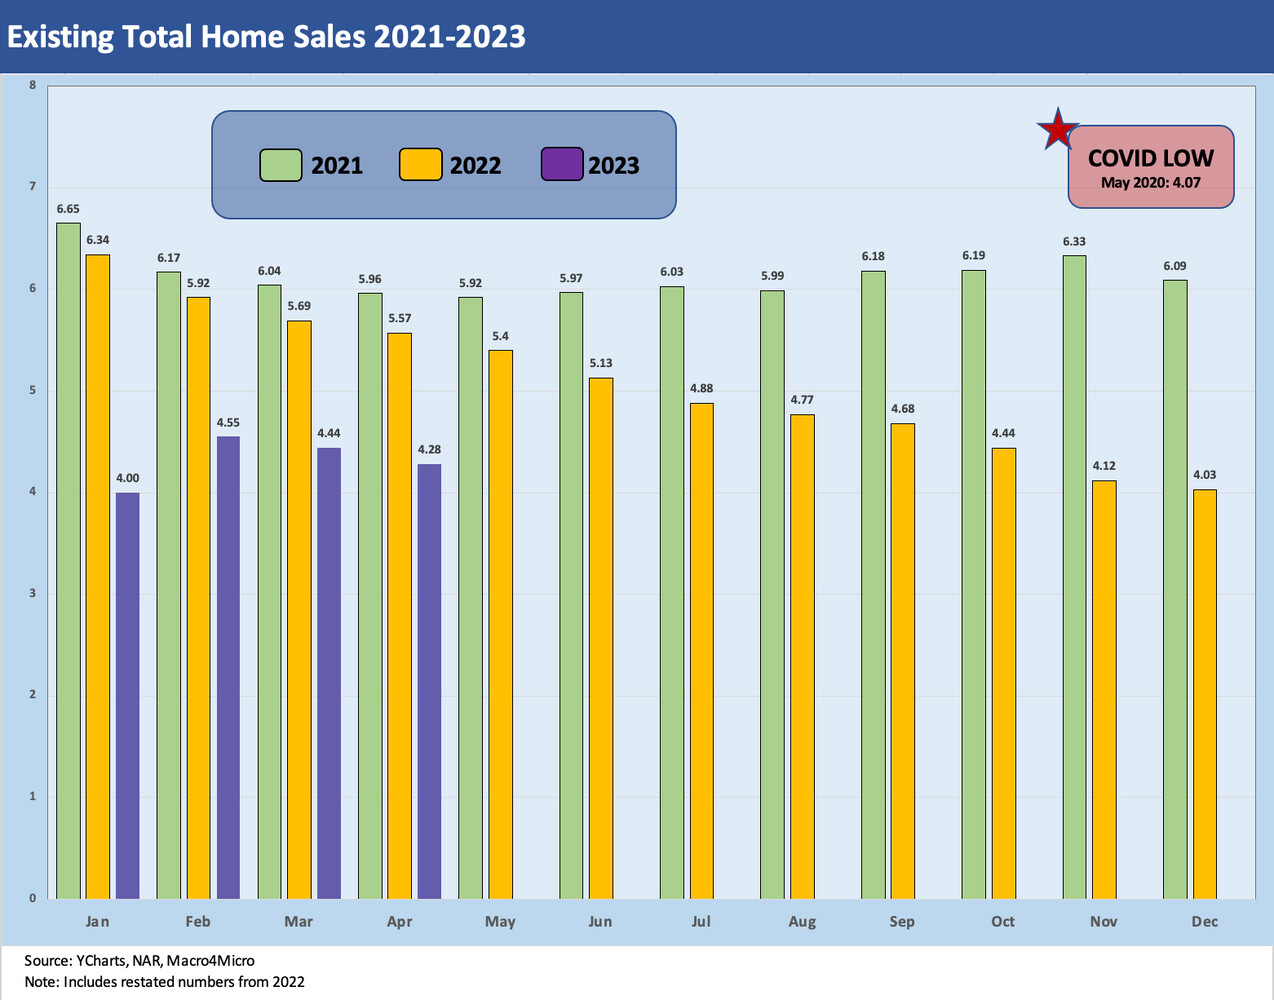
The YoY numbers posted -23.2% vs. April 2022, and that scale is around what we saw in Feb and March 2023 after a few months of YoY -30% handle declines. As noted in the chart above, the year is mired in the low 4-million handle range after hitting a Jan 2023 below the COVID period low (highlighted in the chart). We just had two months of declines from the uptick in Feb 2023.
The April 2023 volumes mark 10 straight months at or above -20% YoY declines (we rounded and included the -19.9% of July 2022). It is a tough time to be a major broker at these volumes (see Signals & Soundbites: Carvana 1Q23 5-4-23, Credit Profile: Anywhere Real Estate 3-1-23). That said, both Anywhere (HOUS) and Compass (COMP) saw their stock trade up more than the market benchmarks today as we go to print.
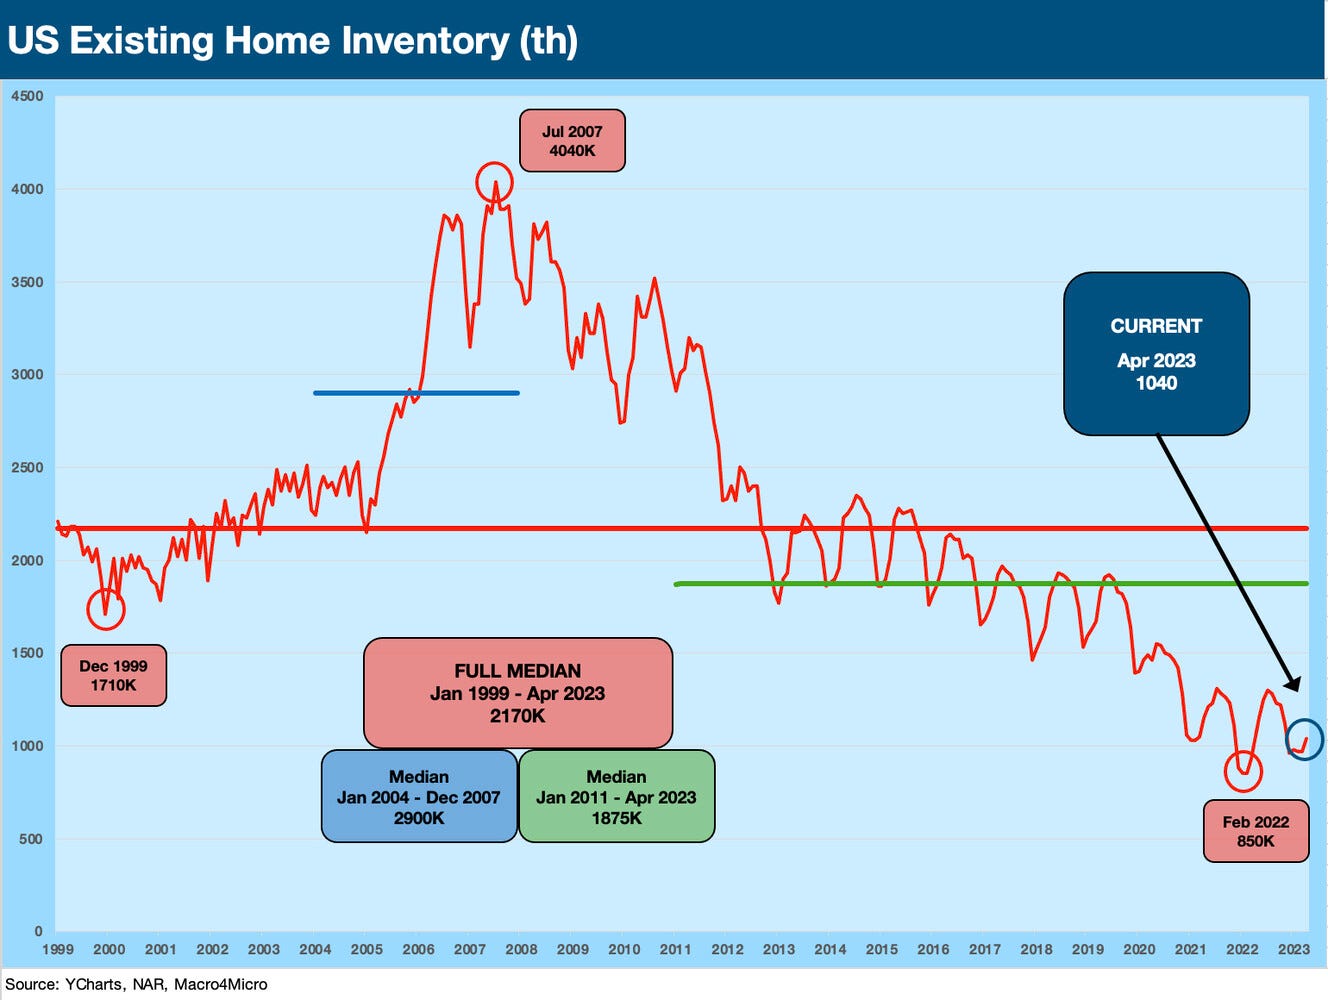
The supply of homes for sale saw inventory at +7.2% from March to 1.04 million homes for 2.9 months of inventory at current sales rates. The bottom line is a small sequential decline in sales, an uptick in inventory, but more favorable color in the trenches on the length of listings.
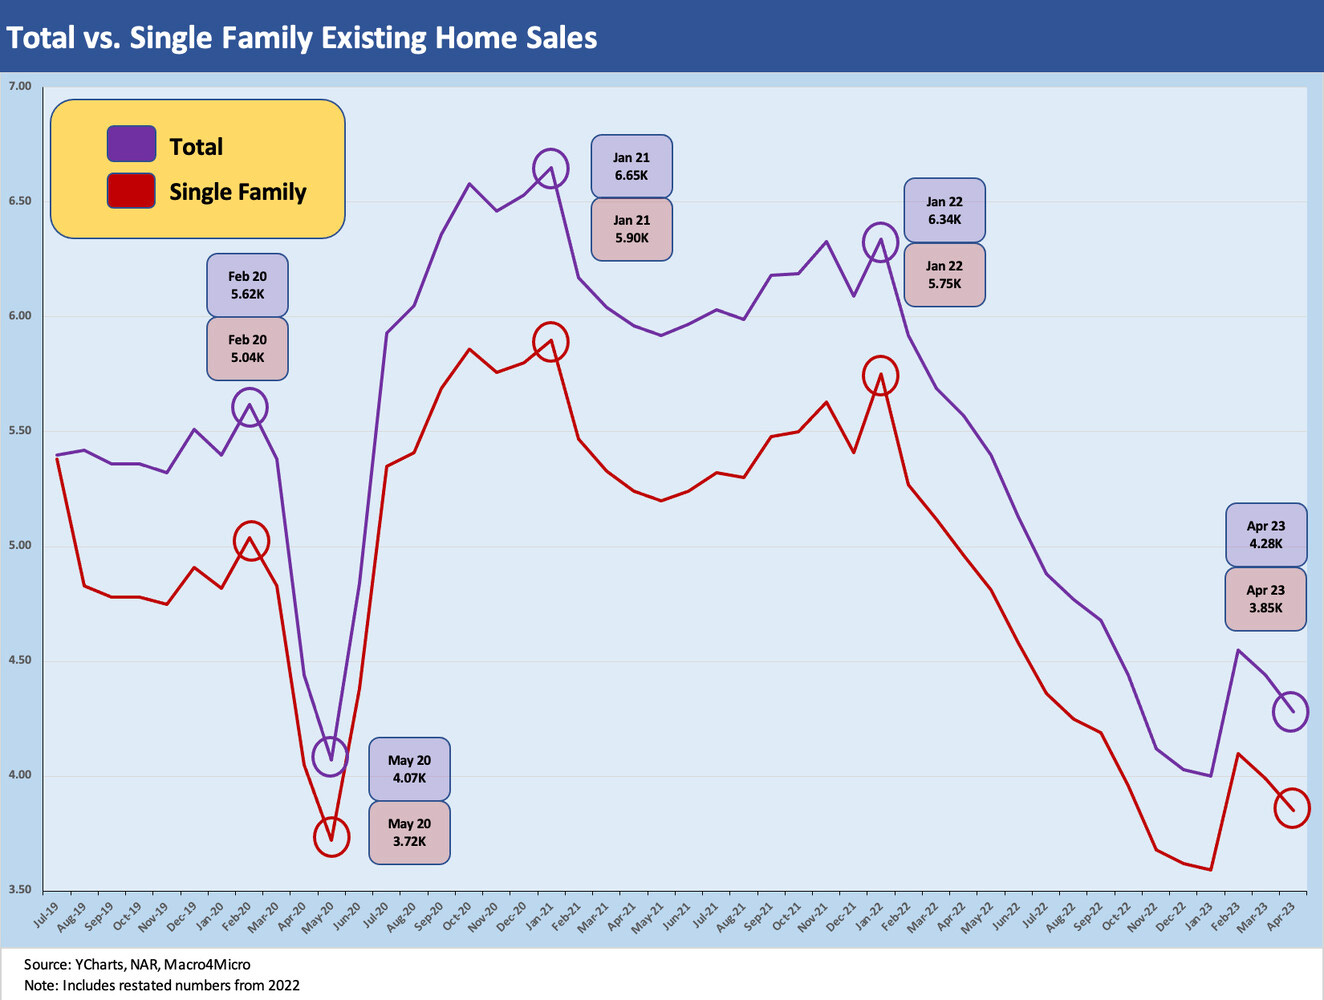
Among other items in the mix, single family volume was down -3.5% in April from March and condo and co-op sales were down -2.3%. Regional variances included a -3.4% decline in the massive South region, the West (#2 region) was -6.1%, Midwest was -1.9%, and the small Northeast market was -1.9%.
That month-on-month variance in total always comes with the asterisk of regional mix and “region within region” and the segment of the markets (notably price tiers). What may not be going so well in the immediate period is the mortgage rate trend as the UST curve ticked up in recent days with the 10Y UST at highs for the past month, with today’s UST at over 3.6%. That yield at least is below the 4+% threshold seen as recently as March 2023.
The critical 10-year UST is coming to a debt ceiling crossroads that is more than a little tense with the debt ceiling clock ticking. The 100-bps swing in 30Y mortgages YTD 2023 has kept the market on edge, and the handicapping of what may unfold along the UST market in the event of a debt ceiling meltdown has no shortage of speculation and two-ton assumptions built into it (see Footnotes and Flashbacks: Week Ending May 12, 2023).
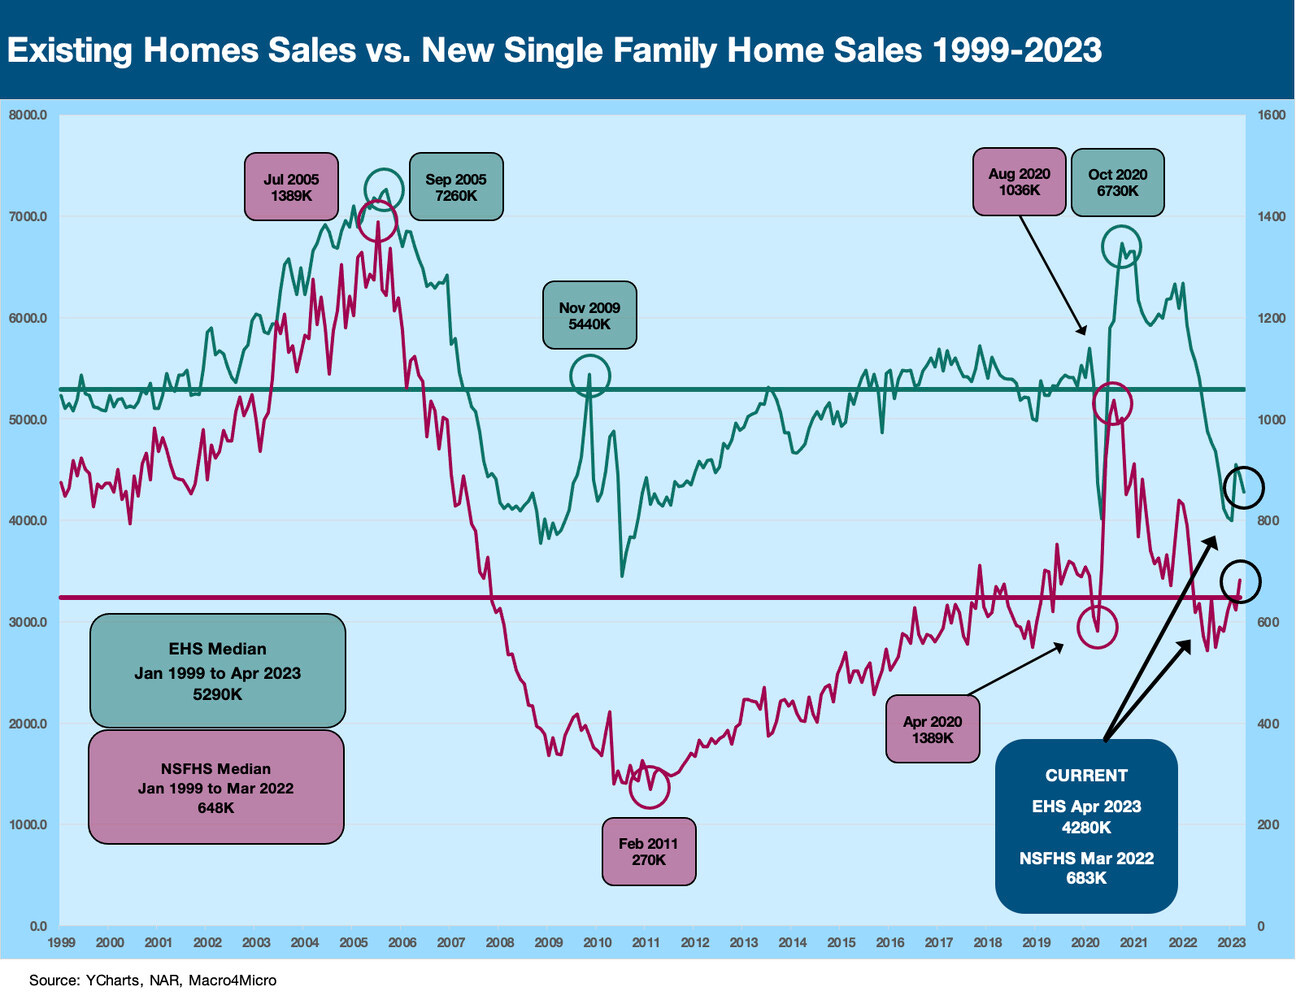
We have covered the balancing act of supply and demand for housing across prior commentaries, so we won’t replay all the same theme music, but an uptick in existing inventory for sale can at times be a good sign even if it is part of the supply pool that gets framed against new homes for sale. The above chart plots the existing home sales vs new home sales, and we need to use a two-sided chart given the massive differential in size between the two. New homes have picked up share in this troubled market with so many potential sellers “sitting this one out.”
The selling season ahead is going to be an interesting one to track at the builder level since more homebuilders have gone heavier on spec building as we enter peak selling season. If mortgage rates ease, the buyers may be ready to pounce and at least product will be ready. The spec strategy is seen in a way we did not witness in the aftermath of the housing bubble.
After so many impairments when the bubble burst, many builders embraced a build-to-order model. That is a risky strategy in the new age of inflation and a mortgage market with very high spreads. You need to be ready if the mortgage move is friendly since the inflation numbers may not cooperate for long. The risk management of using a high mix of lot options is one way to reduce that risk.
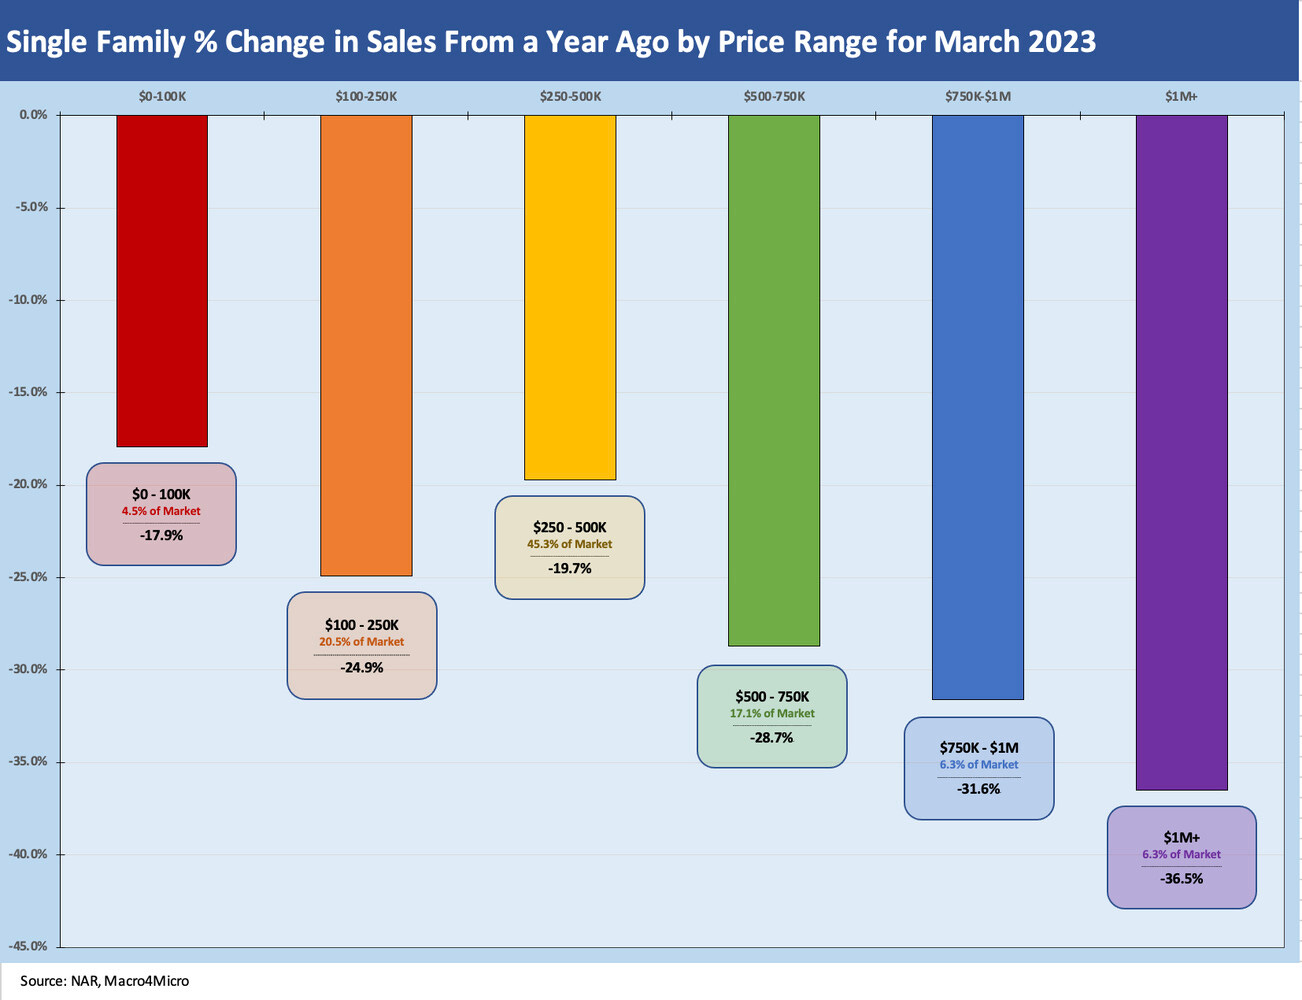
We wrap the update above with the mix of declines across the price tiers. The bar chart also flags the market share of that price segment (e.g., the $250K-$500K bracket is 43.5% of the market). We see the $1M+ segment down the most at -36.5% followed by the $750-$1M bracket at -31.6%. The sweet spot of $250-$500K is down by only -19.7%
See also:
Home Starts and Permits: Performing with a Net? 5-17-23
New Home Sales: Feels Like a Light Tailwind 4-25-23
Existing Home Sales: Dead Calm 4-20-23
Housing: Starts and Permits and the Working Capital Challenge 4-18-23


