
New Home Sales: Volumes Up, Median Prices Down
New home sales come in with solid numbers as regional mix also drives lower median prices.


"South region still anchoring the single family housing market."
The new home sales trend line shows a logical outcome of prices down and volumes up, but that always comes with the asterisk of mix.
On a SAAR basis, we see solid volumes and a material increase in the South, which is by far the largest region, with a smaller rise in the Midwest paired up against declines in the West and Northeast.
The release is good news in the face of what are unfriendly mortgage rates that could potentially be biased higher depending on debt ceiling outcomes.
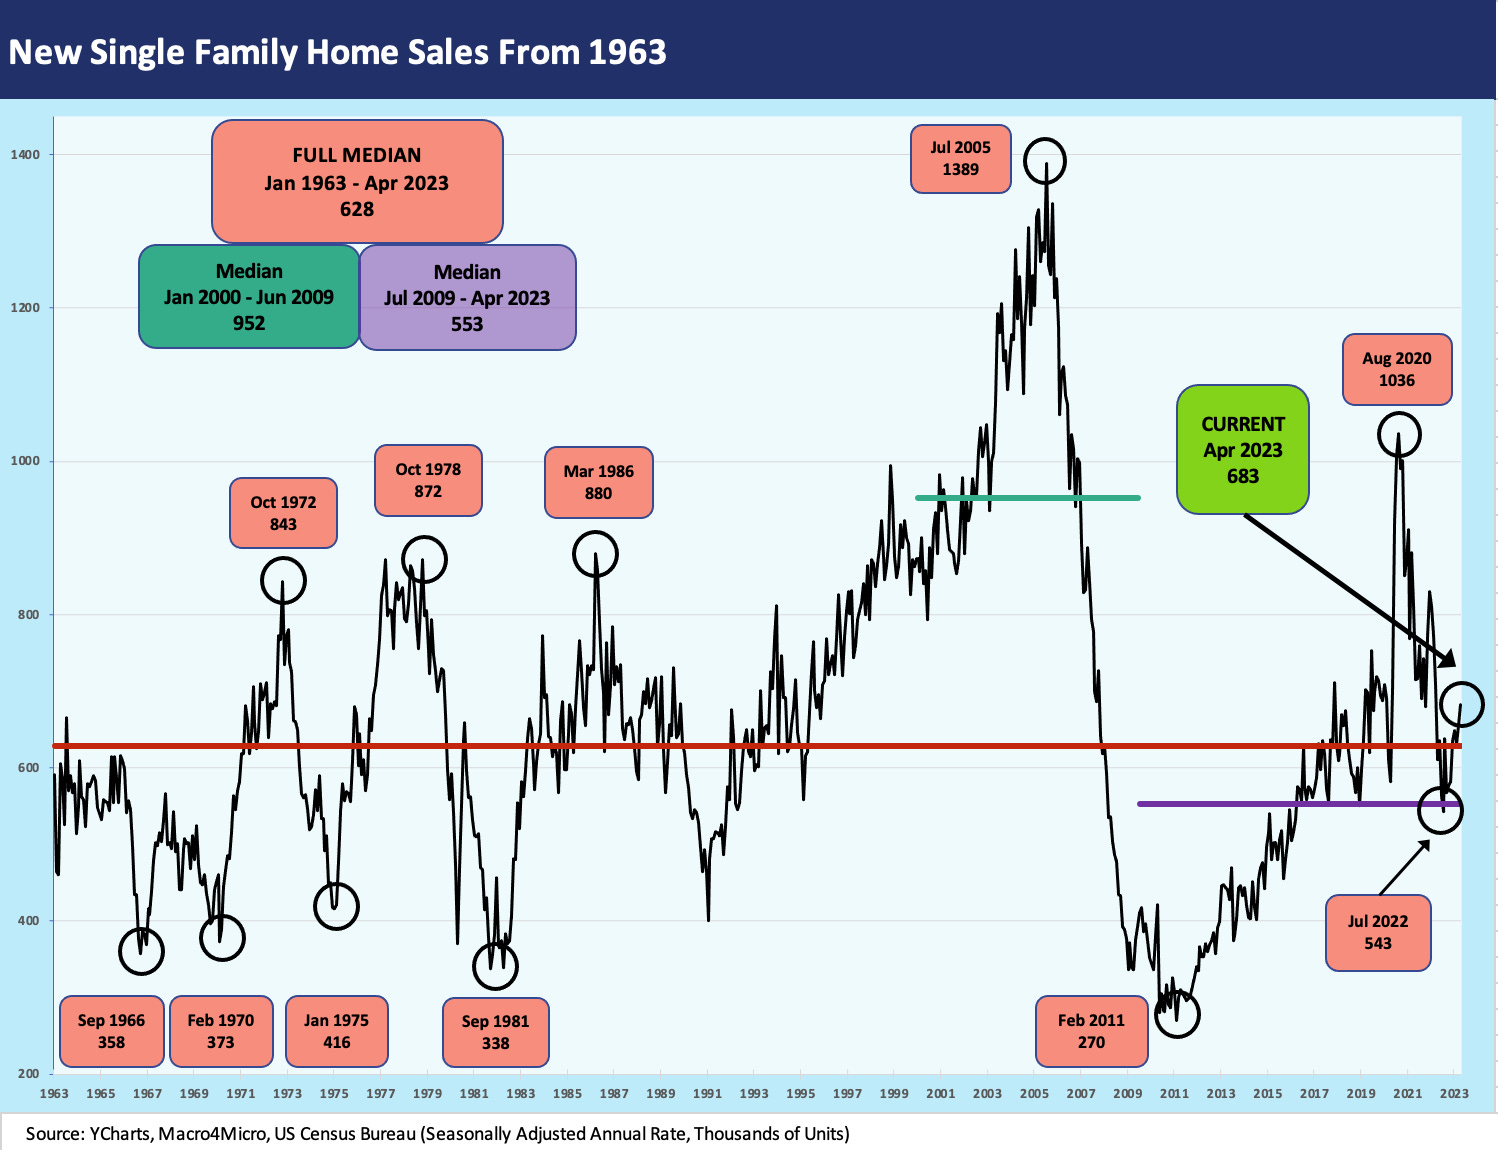
New home sales numbers had shown signs of strengthening in March (see New Home Sales: Feels Like a Light Tailwind 4-25-23), and we see more of that in April 2023. Total US sales were up +4.1% sequentially and, in a change of pace from many metrics, the new home sales numbers are higher YoY. The YoY comps get easier from here as the horrors of spring 2022 and summer 2022 inflation effects and the end of ZIRP flows into the YoY comparisons.
We see the South up sequentially at +17.8% SAAR (+23.4% YoY) and the Midwest up at +11.8% sequentially (+20.6% YoY). On the negative side, we see the West at -9.1% sequentially and -2.8% YoY. The small Northeast market (1/3 the size of #3 Midwest) was -58.6% sequentially and -46.7% YoY.
“Inventory months” ticked down in the US in April as we head into the peak selling season with homes for sale at 7.6 months at current selling rates. The Not Seasonally Adjusted metrics for homes for sale posted 6.8 months on a small decline in units. That means inventory is in good shape for the builders with move-in ready homes as we roll into the main months of the selling season ahead.
Completed homes for sale at the end of the period remain near a high across 2022-2023 on a SAAR basis and flat MoM while Not Seasonally Adjusted are just below a high. The number of homes under construction for sale ticked down and we are well below the highs of 2022.

The price action is a function of supply-demand as always but also the mix. We prefer the median over the average given how different regions can diverge and different product segments are having mixed results. After an uptick in price in March, we see median prices coming down.
The rise in volume in the lower price South and decline in the high price West and Northeast would be consistent with some national median price declines. Some of the weakness in the West can be traced to trouble in tech paradise seen in employment headlines from Seattle to San Fran, but you only get so much transparency in the release. We can get quarterly median and average price data by region in the Census data, and we produce the trend line for the two highest volume markets below.

The above chart plots the long-term median price for the two major regions – the South and West – that drive the bulk of new home sales numbers at around 85% of the total. The South is just under 2/3 of the total. Within the South, Florida and the Southeast are major drivers of volume and Texas is as always a massive base of operations for numerous homebuilders including the #1 builder, D.R. Horton (see Signals & Soundbites: D.R. Horton 2Q23 4-21-23). The West is a high price market with the median as of 1Q23 at $531K vs. $408K in the South.
The boxes in the above chart frame the quarterly median for 4Q19 ahead of the start of COVID (which hit the fan in March 2020). We detail the high median quarterly number for the South and West, which occurred in 2Q22. For the total US, the quarterly high median came in 4Q22. The market is down from there on the cumulative effects of mortgage rates and the shift in mix toward lower price regions.

The chart above is self-explanatory in that it plots the monthly median prices for US home sales. We highlight some intermittent Hi-Lo swings along the way. The sharp drop in April in median price is about regional mix and product segment mix but also about market clearing reality with higher monthly mortgage payments.
The new home release by the Census offers details on the distribution of sales by home price brackets. We see an increase in the $200K to $299K bracket from 10% to 15% and also for $300K to $399K to 32% from 29%. The $400K to $499K rose slightly to 23%. The $500K to $749K share fell sharply from 28% to 18%. The price range of $750K and over ticked up slightly to 12%. Any number of theories can get applied from setbacks in the move-up segment on “golden handcuffs” (low coupon mortgages they have now) to buyers simply waiting for lower mortgage rates (mortgages are now higher in May).
The net takeaway from the headlines is that signs of tailwinds are there for volume/demand. Price is still high in historical context and tight inventory helps builders. Some gross margin pressure but steady inventory liquidation is good for builder cash flow. The builders can wait out the inflation and cyclical handicapping with an ample supply of spec homes and many more under construction. The debt ceiling lurks, but what else is new?!