Footnotes & Flashbacks: Asset Returns 6-18-23
We frame asset returns as the breadth of positive performance trends is widening during recent weeks.
“The market is possessed. We just don’t know if its a good or bad spirit.”
We update asset returns after a week when the market pushed right through a hawkish set of FOMC signals of what could lie ahead.
While growth and tech still rule the equity markets, we see value stocks and industrials mounting a comeback.
HY has turned in a very strong few weeks in June and is running ahead of quality and duration YTD 2023.
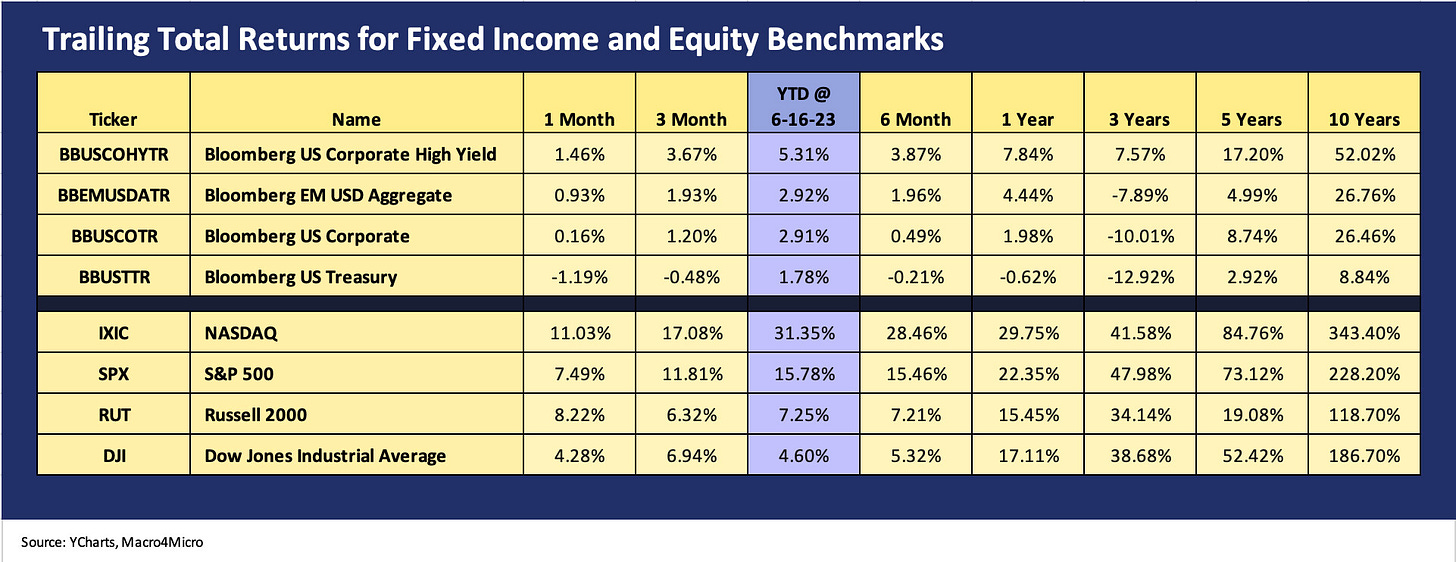
The above chart highlights the trailing returns for the debt and equity asset classes we track each week. We line them up in descending order of trailing YTD total returns. In debt, HY is getting it done YTD on solid spread contraction and especially for the MTD June period as excess returns lead the way in recent numbers. We see HY ahead for 1-month, 3-month, and YTD as the equity rally and disaster avoidance (debt ceiling) and a wide range of constructive fundamental inputs have not handed the resilient HY investor much need to buy into the recession theories just yet.
In equities, the leadership of tech and uneven distribution of performance is not a new topic, but the comeback of the Russell 2000 is catching some buzz given its chronic laggard status. The Russell 2000 has more overlap with the HY universe than the S&P 500. That is feeding some theories that the longer tail of the S&P 500 as well as the Russell 2000 could see more equities following the leaders at least directionally.
In the end, the widening range of equity rallies still gets back to the sea level fundamentals that are fueling the hiring (JOLTs and jobs) and holding industrial production up (see Industrial Production in May: Holding, Waiting 6-15-23) even as construction grows in numerous categories with all of its multiplier effect benefits (see Construction Spending: Demystifying Nonresidential Mix 5-9-23). We got some good granularity on those issues in a recent report from Ashtead (see Signals and Soundbites: Ashtead 4Q23/FY 2023 6-14-23) and United Rentals (see United Rentals: Investor Day Backs Up Bulls 6-11-23).
The above chart updates the 1500 and 3000 series, and 1500 Industrials is working its way up the return list with a very strong trailing month. The 3000 Value index is still struggling YTD and Financials and Energy still in the YTD doldrums even if those all posted a strong month. We still have Financials and Energy negative YTD.
ETF Returns, industry comps, and asset class proxies…
In the next 3 charts, we look across 25 ETF and industry benchmarks for the trailing returns of the past week, the trailing 1-month, and the trailing 3-months. We recently bumped up the count from 24 to 25 by adding an S&P 500 equal-weighted index (Invesco’s ETF ticker RSP). The distortions of the returns by the largest names in the market-weighted S&P 500 get too much coverage not to add another frame of reference (see Reversal, Takedown, or Escape? Market Weighted vs. Equal Weighted 6-6-23).
The above chart updates the 25 sector ETFs and benchmarks for the past week. We see 22 positive and only 3 slightly negative with the Regional Bank ETF (KRE) at -0.9% despite the veiled threat from the Fed for fed funds moves that would bring even more pressure on the regional bank interest margins to compete for deposits.
We saw Transport and Materials break into the Top 5, and the broader rally put the S&P 500 and S&P 500 even-weighted ETF (RSP) running alongside one another in an early sign of what the market hopes will be wider breadth of positive equity performance.
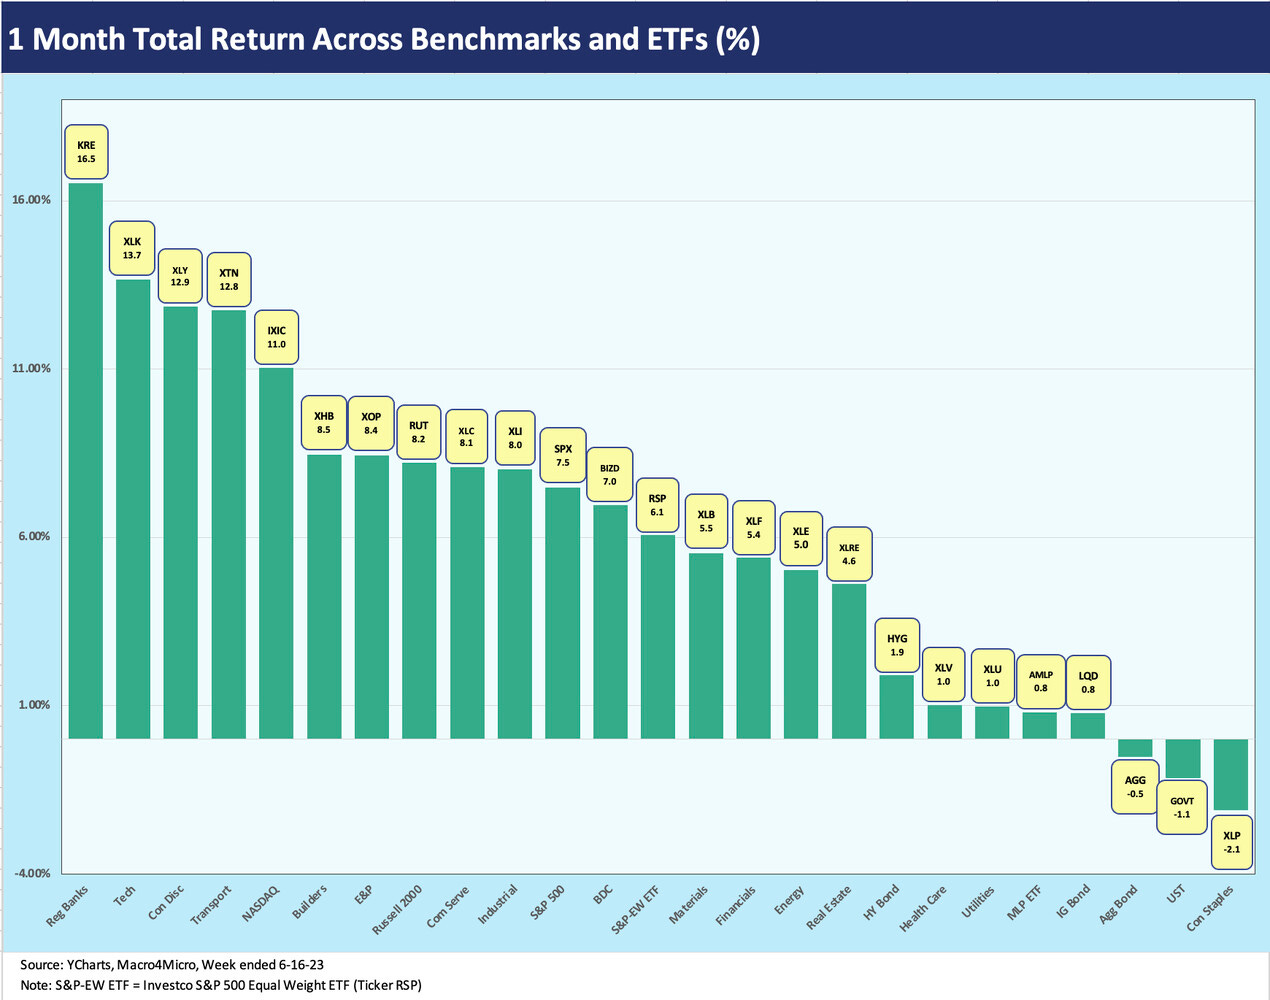
The 1-month returns detailed above are also 22 to 3 favoring positive. Two of the three on the bottom were slightly negative and were high quality fixed income (AGG, GOVT). The bottom performer was a defensive ETF in Staples.
The #1 performer was the steady recovery of Regional Banks (KRE). We see Transport (XTN) and Builders (XHB) in the Top 6, so the news is not just all about Tech (XLK). The middle of the mix shows some interesting diversity with S&P 500 even-weight (RSP), BDCs (BIZD), and Materials (XLB). That mix sends some positive signals on how the market views the cycle.
The running 3-month ETF and benchmark numbers are 23 positive and 2 in negative range. We still highlight the Regional Bank ETF in its own box at -6.0%, but that number comes with a big benefit from the days that dropped out of the measurement period after the SVB collapse started to spread its joy. On a YTD basis, KRE is at -25.5%.
The best performers still show tech or some mix of the Magnificent 7 ruling the ranks in the Top 4, but Builders have been one of the more notable story lines in taking the #5 position in the face of high mortgage rates and sliding YoY volume. We also see the broadly diversified Transport ETF (XTN) at #6, the floating rates credit assets of BDC (BIZD) at #8, and Industrials (XLI) at #10.
There is a mix of cyclical optimism and less UST curve fear than one might expect, but the headline jobs numbers and declining inflation are offering some tangible sources of support. The performance of equities can always play a role even if the chatter around momentum (vs. fundamentals) and chasing the herd gets ample airtime in the commentary.
We still do not see transparent signals of cyclical weakness in the company guidance and running economic metrics. It is hard to get past the employment numbers, the sustained supply-demand imbalance in housing, and the long list of major mega-projects and investment initiatives that we detail in other commentaries. The wage growth and jobs story lines make it hard to craft material 2H23 setbacks in the consumer sector even if there is a lot of household leverage.


