
Footnotes & Flashbacks: Asset Returns 1-21-24
We update returns as the generosity of the recent bull market starts cutting portions even with a headline S&P 500 record.


With an uneventful week in credit and more adverse UST moves, the world of bonds is off to a slow start in 2024 while equities are back on an uneven performance favoring Tech and MAG 7 yet again.
The S&P 500 hitting a new record high makes for headlines but the divergence between the broad market benchmark in its usual market cap basis vs. equal weighed (ETF RSP) shows the S&P 500 in the positive range for 1-week (from 1-12 to 1-19) and 1-month while the RSP is on the negative side of the ledger.
For purposes of earnings and fundamentals, the consumer is hanging tough as highlighted in retail sales during the past week, but the industry-by-industry guidance and expectations remains mixed with oil rangebound despite the rockets flying around and Iran getting more active.
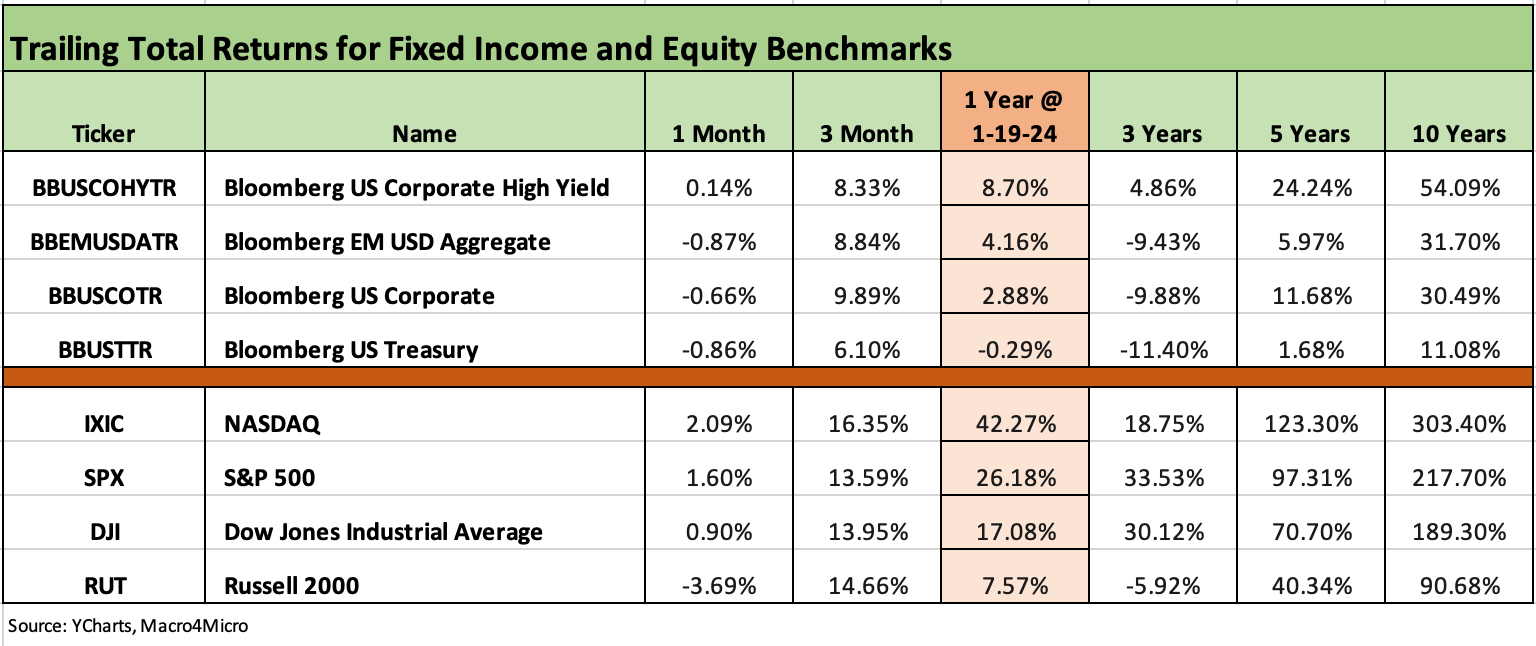
The above chart updates the main debt and equity benchmarks we watch, and the trailing 1-month returns show 3 of 4 in the red zone with the trailing 3-month numbers very much still reaping the benefits of that very strong Nov-Dec finish to 2023 after a mediocre October (see Footnotes & Flashbacks: Asset Returns 1-1-24 1-1-24).
We line up the benchmarks in descending order of 1-year total returns. The main negative outlier over 1-month is the Russell 2000 small caps after its very strong wrap to 2023. Small caps generated almost all of their 2023 returns in that last 3 months of the year.
For duration, the UST curve shift is undermining fixed income so far as the consumer is keeping UST bulls on the edge of their seat after very solid retail sales were released for Dec 2023 (see Retail Sales: Another Solid Consumer Month 1-17-24) followed by a very healthy jump in consumer sentiment to end the week (see Consumer Sentiment: Multiple Personalities 1-19-24).
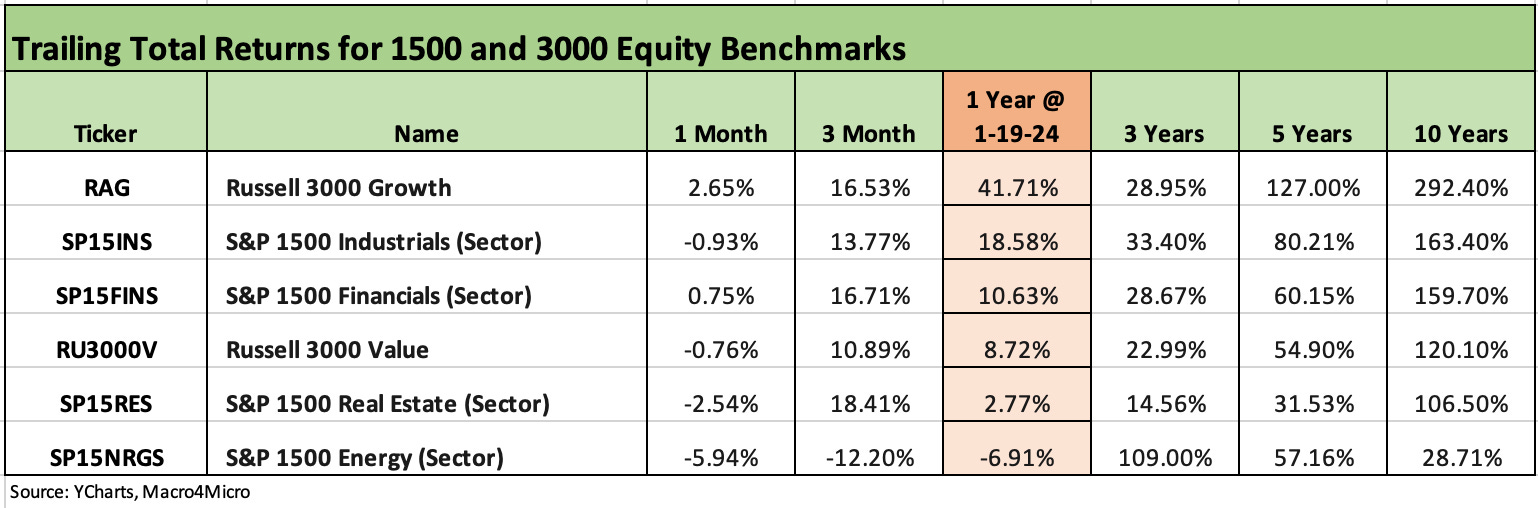
The above chart updates the 1500 and 3000 series, and the main theme YTD is the idea the market is revisiting last year’s start with a lack of breadth and “Growth” at the helm. The theory in 2022 was that higher UST was bad for tech, so the tech buyers are looking past this UST gyration this year and sticking with the late year sentiment (so far).
We see each line item sliding for 1-month returns on a sequential basis with the Russell 2000 falling off the most on the rolling 1-month collection of weeks from +3.85% last week as it lost a rally week in the new month and added a new slightly negative week.
The rolling return visual
The collection of four charts below looks a lot like the prior week except for a shift toward the negative side in the 1-week collection. It will take some weeks to move the needle from the very strong numbers in Nov-Dec 2023, but the weakness is spreading back to more of the benchmarks and ETFs outside of tech. We look at each time period in more detail further below.
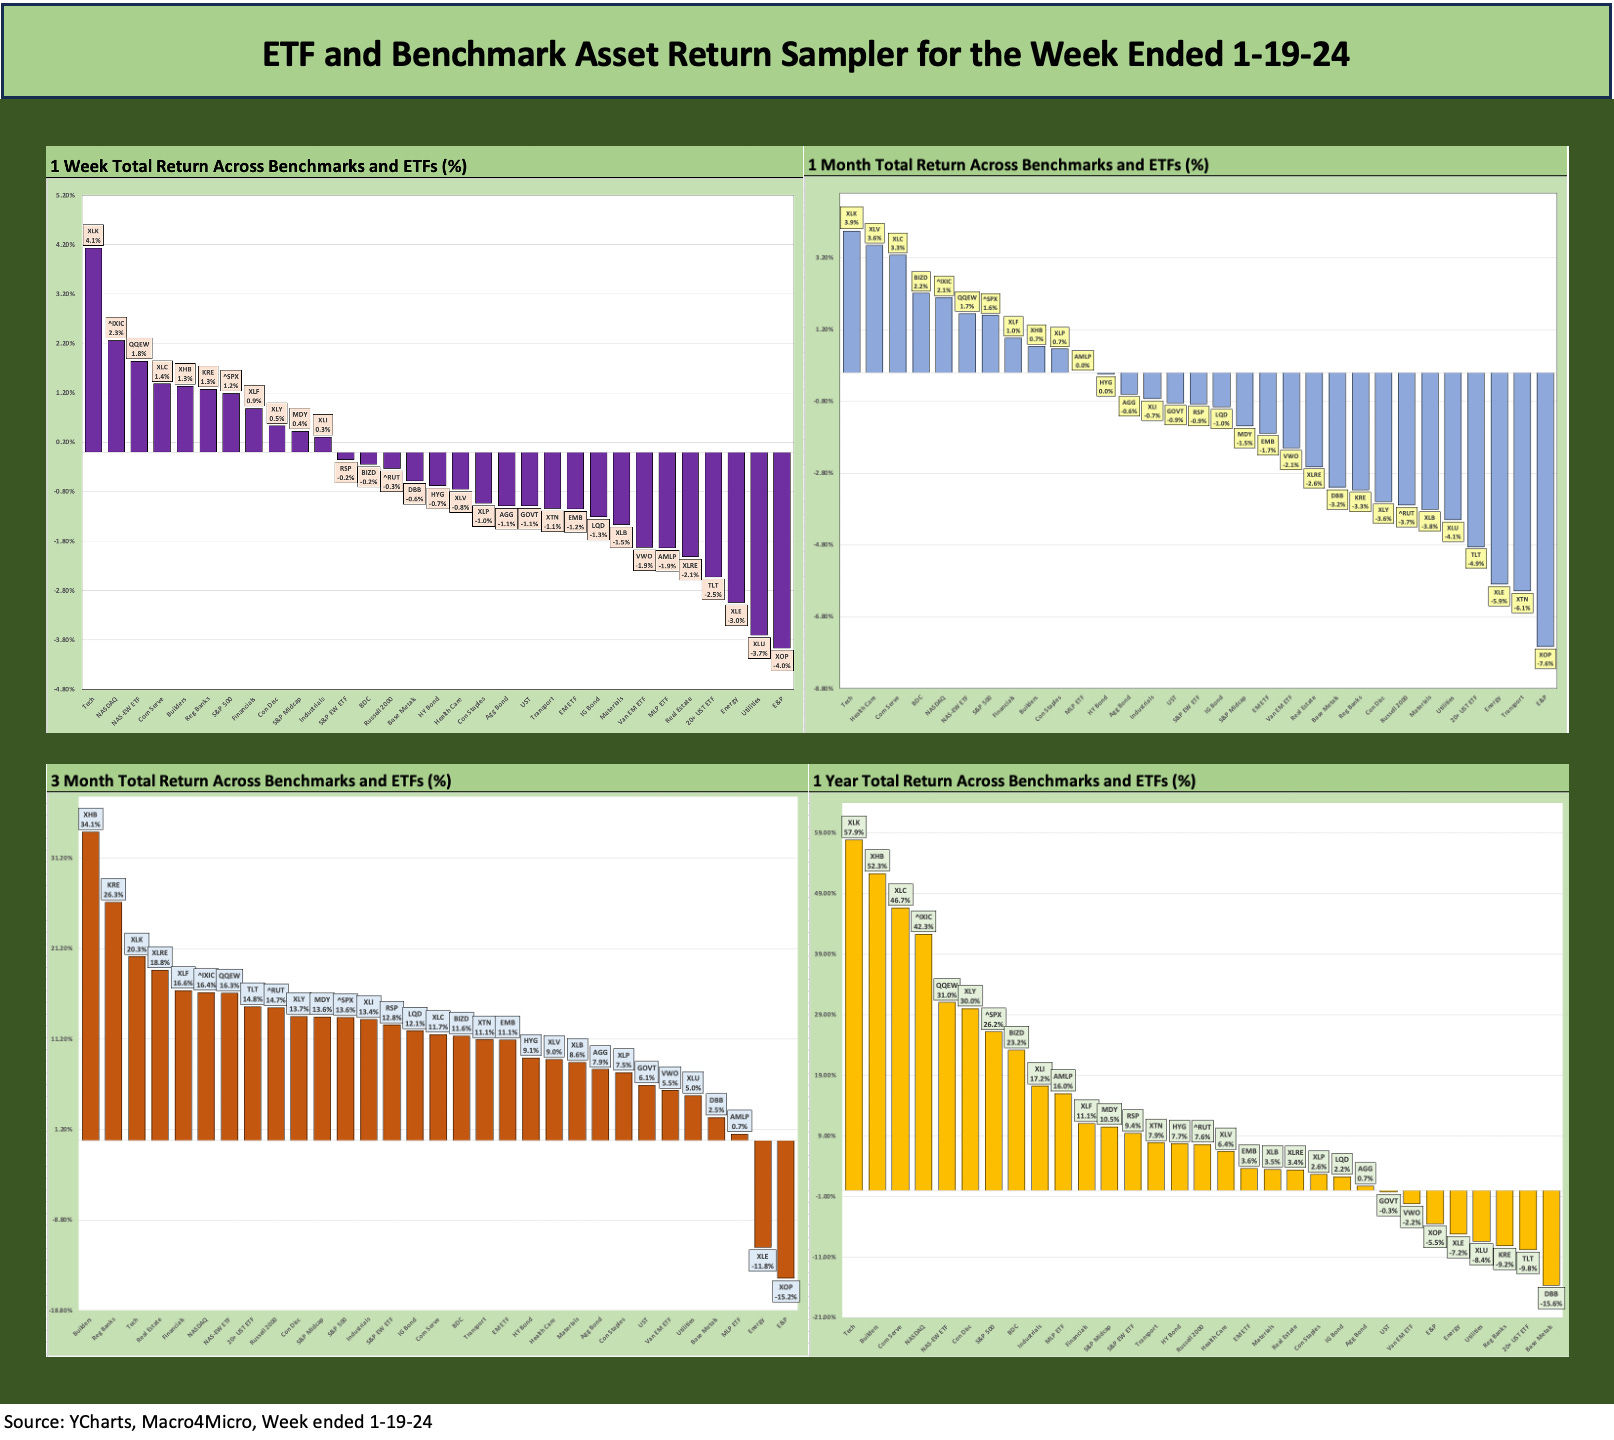
The above chart shows the 1-month starting to morph with the 1-month time horizon ending 2023 with only 1 negative and now we are already up to 20 categories in negative range. The 3-month time horizon was only 2 in negative range at the end of 2023, and that remains in place since both Nov and Dec were so strong after a weak Oct 2023.
The Magnificent 7 heavy ETFs…
Some benchmarks have a few issuer concentration elements that leave them wagged by a few names. When looking across some of the bellwether industry/subsector ETFs, it is good to keep in mind which narrow ETFs (vs. broad market benchmarks) get wagged more by the “Magnificent 7” including Consumer Discretionary (XLY) with Amazon and Tesla, Tech (XLK) with Microsoft, Apple, and NVIDIA, and Communications Services (XLC) with Alphabet and Meta.
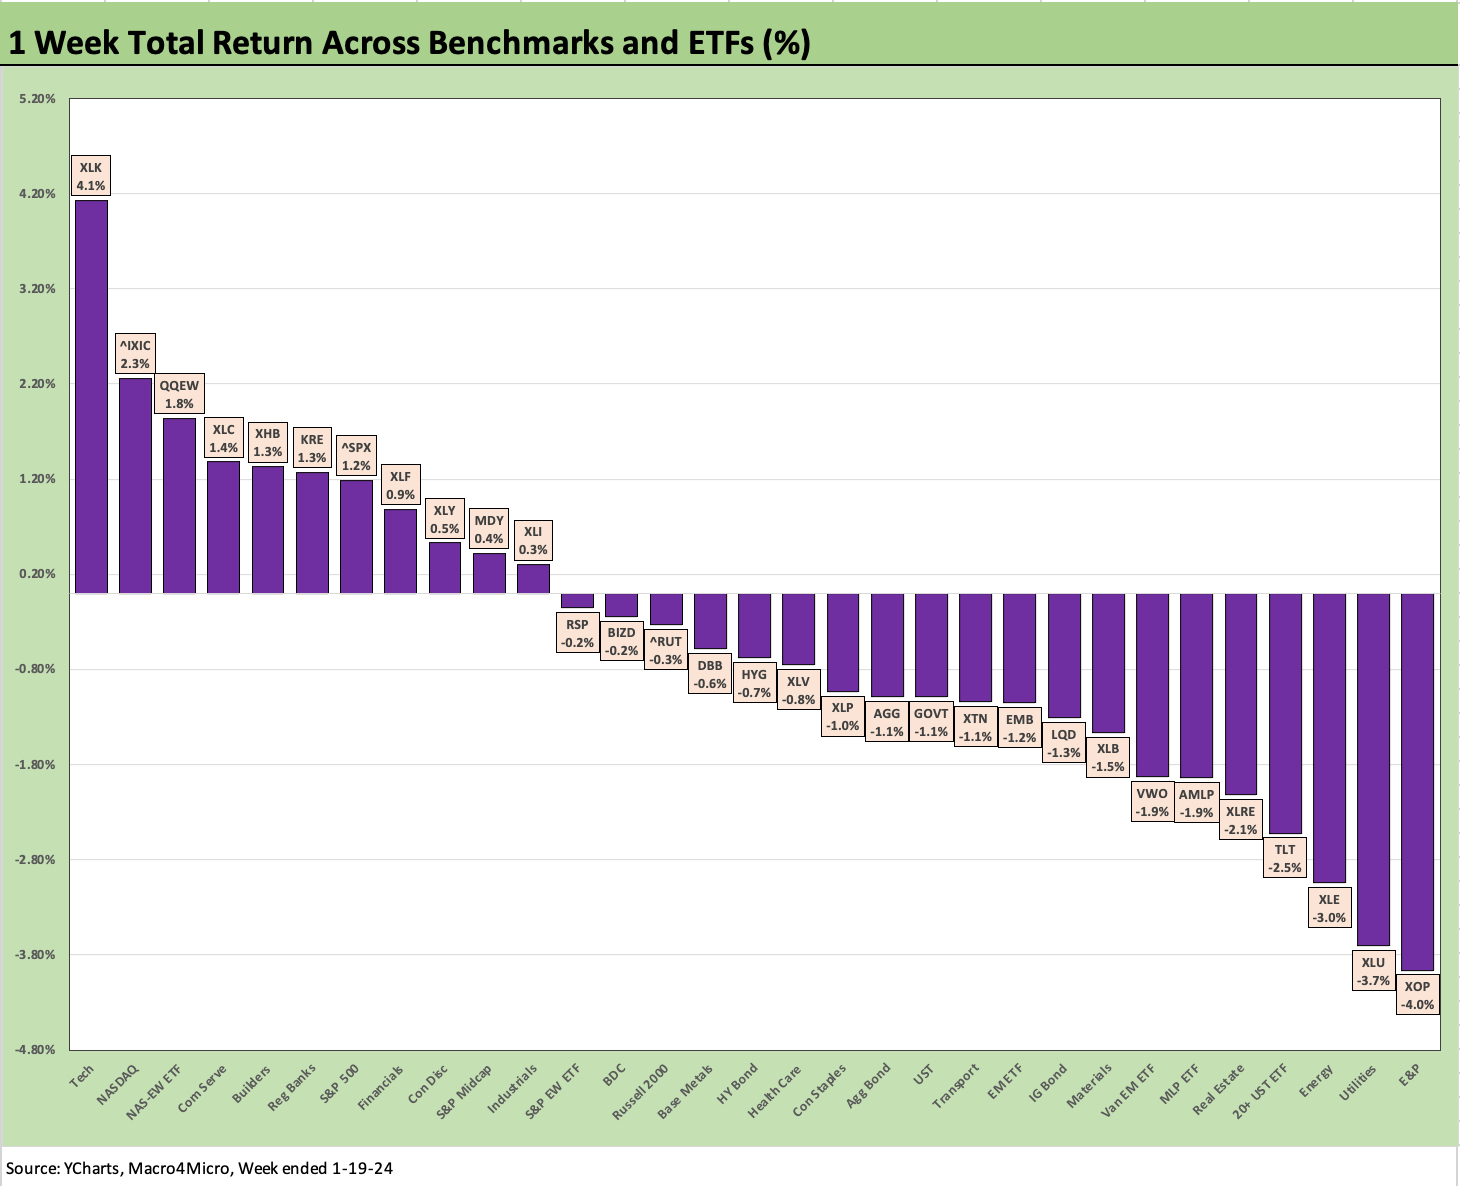
The above chart frames the 1-week returns for our universe of benchmarks and ETFs, and we see the score for the week at 11 positive and 20 negative. The top 4 are tech or “Mag 7” ETFs (XLC at #4, XLY at #9). The financial subsectors also show up in the top quartile after another peak week of financial earnings with Regional Banks (KRE) at #6 and Financials (XLF) at #8.
The Builder ETF (XHB) weighed in at #5 after a mix of positive inputs for builders including new residential construction (see Dec 2023 Housing Starts: Slow 2023 but Speeding Up 1-18-24) and tight existing home sales inventory stats (see Existing Homes Sales Dec 2023: Rerun of Multi-Decade Low 1-19-24).
We also saw a pricey acquisition among the major builders with M.D.C. Holdings announcing it was being acquired by Japanese building company Sekisui House, who will acquire MDC in an all-cash transaction with an equity value of US $4.9 billion. The headline on the deal is that it will create a new Top 5 builder in the US based on units.
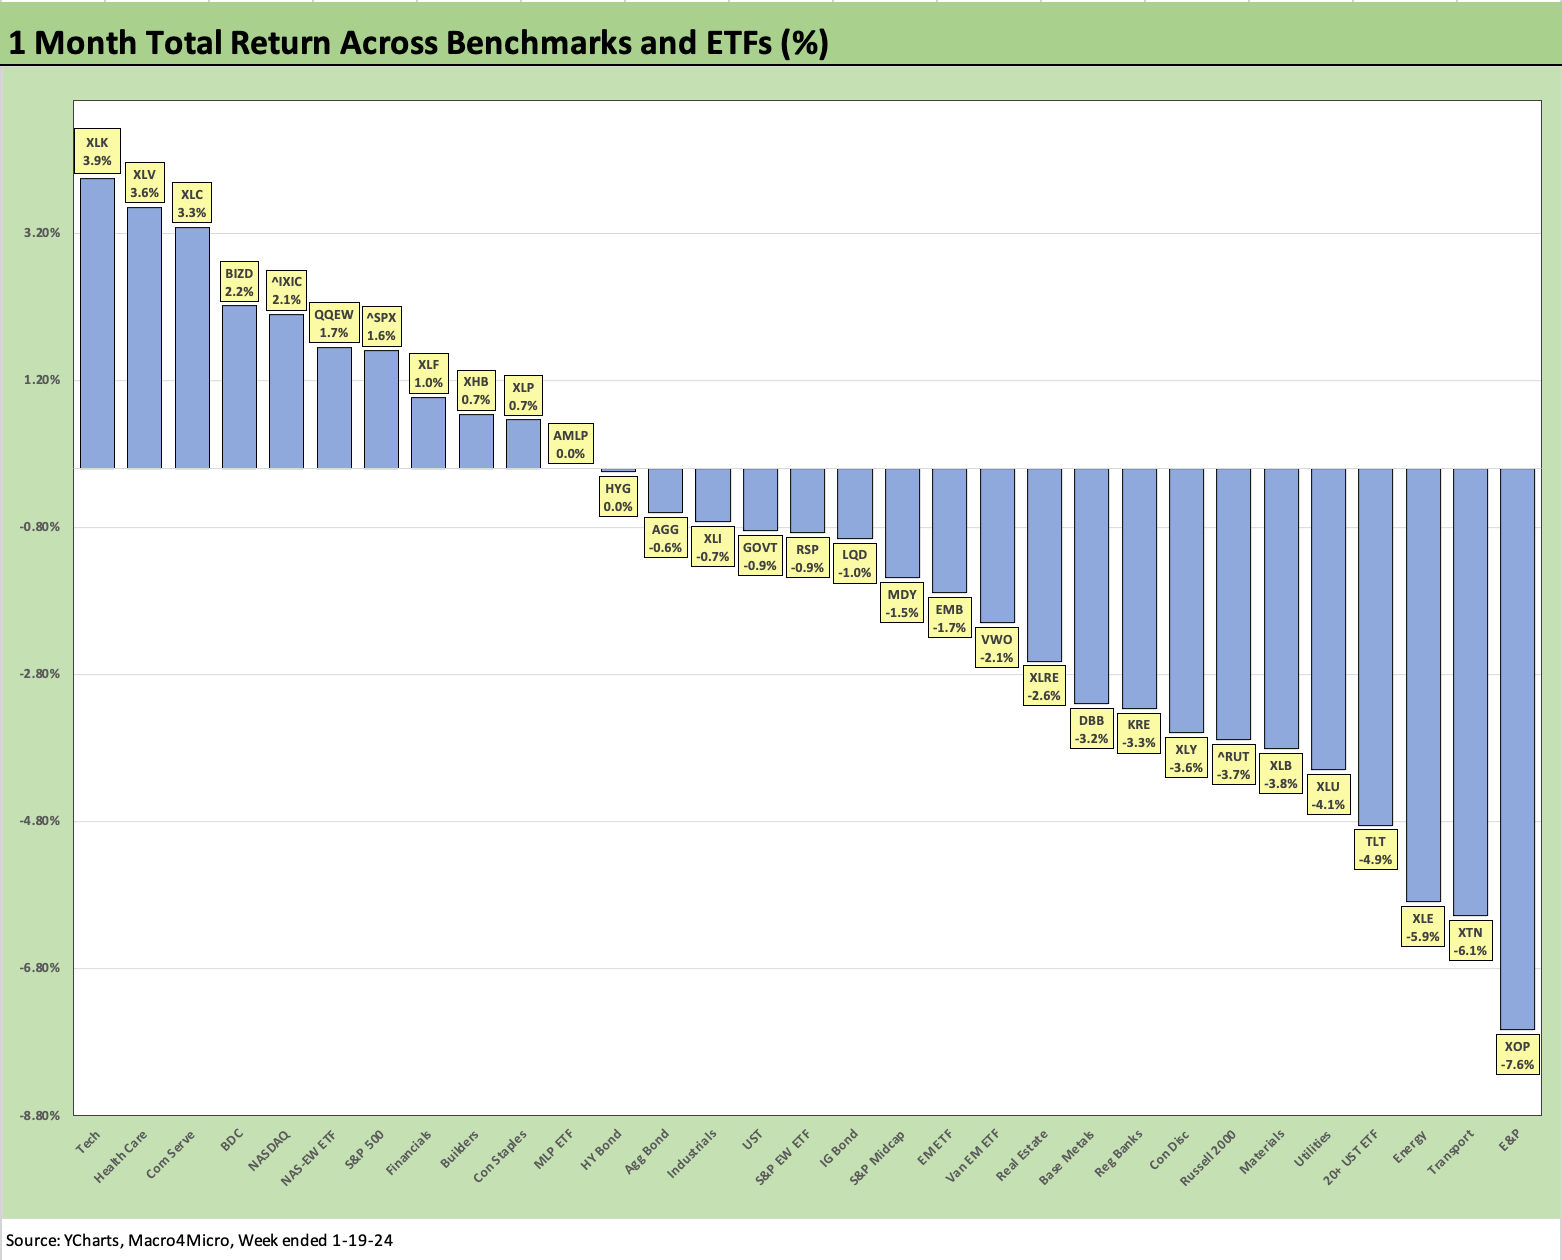
The trailing 1-month return mix shifted toward the negative side relatively quickly after seeing only one ETF in the red (AMLP) for the 1-month period as of the end of 2023. We now see a score of 11 positive and 20 negative.
The E&P ETF (XOP) is sitting on the bottom with the Energy ETF (XLE) 3rd from the bottom. The bottom tier includes a mix of cyclical question marks such as Transports (XTN) and UST anxiety revisited around duration heavy risks such as the 20+Y UST ETF (TLT) and the interest rate sensitive Utility ETF (XLU).
Once again, the top of the rankings is heavy on Tech and Mag 7 with the BDC ETF (BIZD) holding in among the top 5. All the fixed income ETFs are now in the red for the trailing 1-month with HY leading them just under the zero line in negative range.
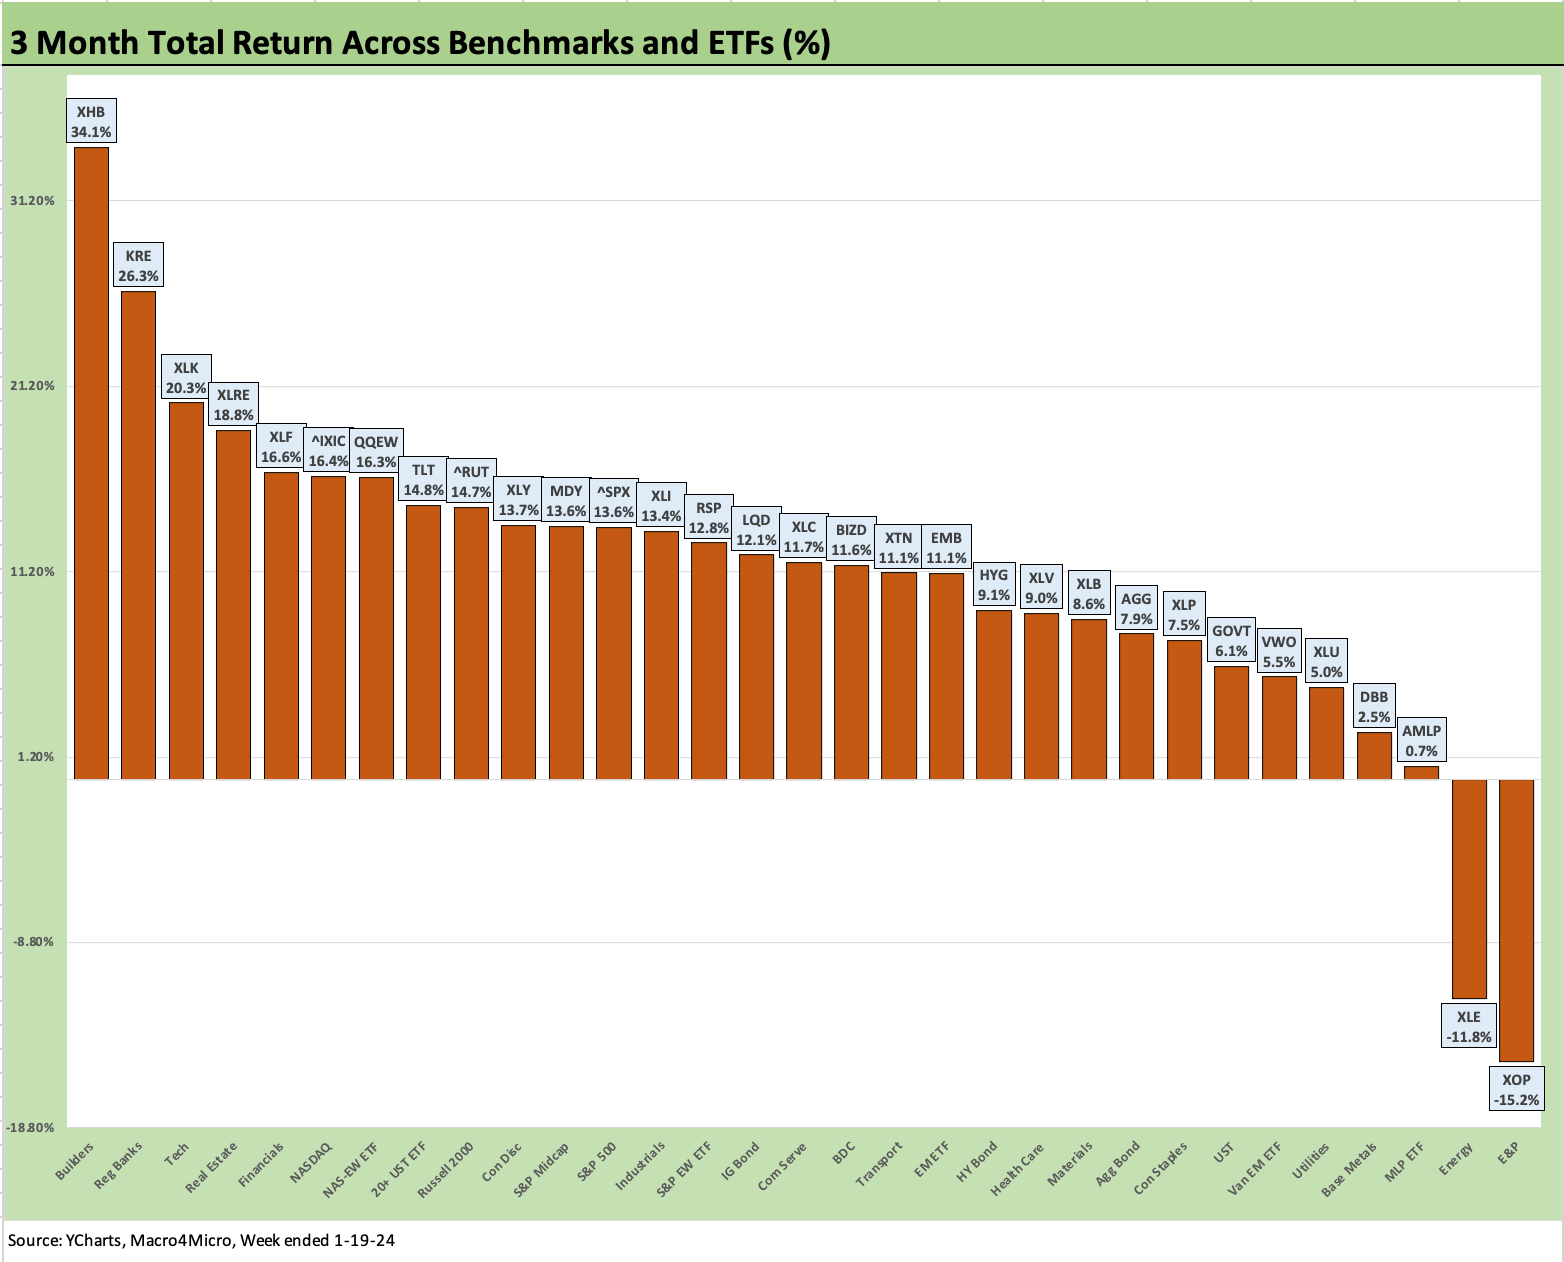
The 3-month line is hanging in the positive zone at 29-2 with E&P ETF (XOP) and Energy (XLE) in the red with the Midstream Energy ETF (AMLP) just across the border in positive range but still 3rd to last.
The Builders (XHB) remain in the lead at a dazzling +34.1% for 3 months with Regional Banks (KRE) at #2 with 26.3% as they keep the beat going on their post crisis rally. The top quartile still includes some of the other interest rate sensitive names that rallied so hard in Nov-Dec 2023 with Real Estate (XLRE), Financials (XLF), and long duration fixed income (TLT).
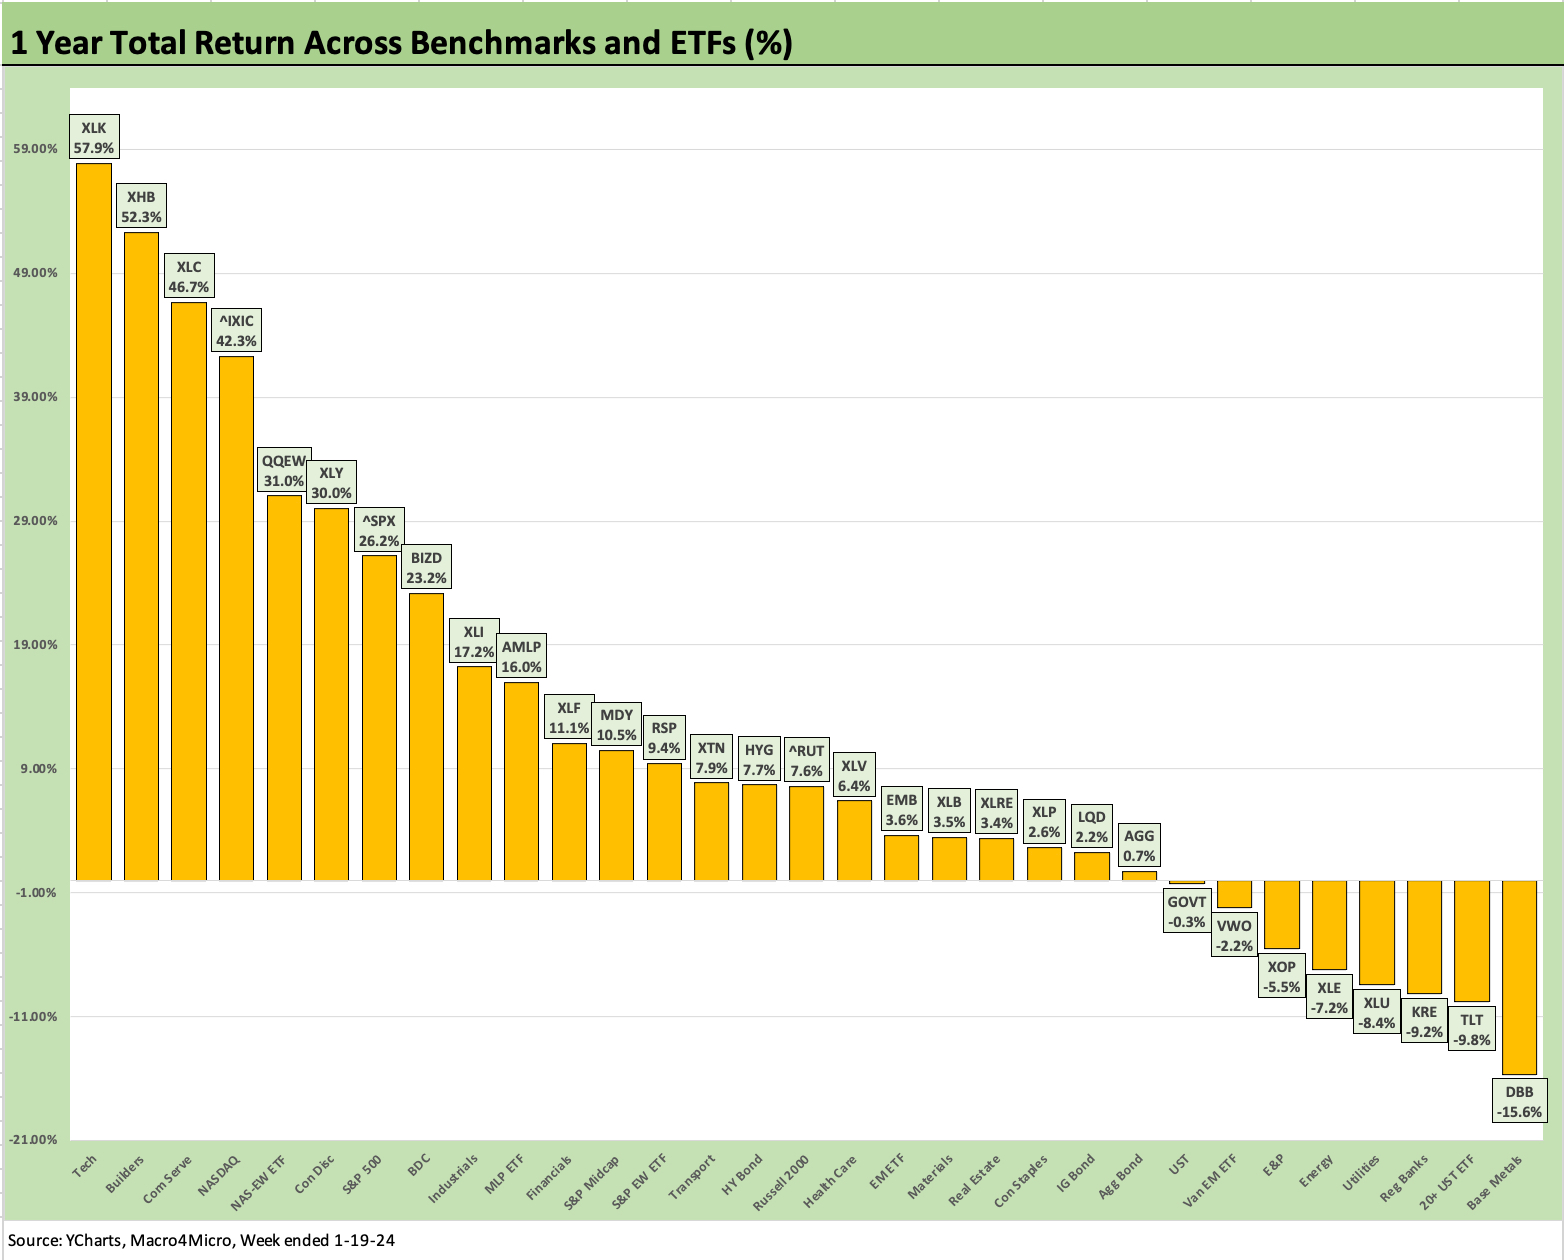
The trailing 1-year horizon ended 2023 with only 4 in the red, and that has grown to 8 with the score at 23-8. The Tech ETF (XLK) is in the lead at +57.9% and the Base Metals ETF on the bottom at -15.6% as China weakness keeps commodities on edge. At the end of 2023, Regional Banks (KRE) were bringing up the rear at -7.6% with DBB slightly positive.
We now see 12 benchmarks and ETFs in trailing 1-year double digit returns, down from 19 at year end for 2023. The top quartile (we use 8 for that quartile) show 6 of 8 heavily influenced by Tech or Mag 7 (including the S&P 500 at #7) with Builders at #2 and the BDC ETF (BIZD) in the mix at #8.
Summary
For the week ended Friday 1-19-24, we see a slow start outside the tech sectors in equities as earnings season unfolds. We see a weak YTD period for fixed income on second guessing UST curves. We seem to be back in the “good is bad” mode on UST where we spent a lot of 2023.
As we get close to March Fed decision time, the cleaner read of UST trends will have a few more CPI and PCE inflation data points under the belt and a view on some key spring selling season color (autos, housing, consumer travel bookings, etc.).
This coming week we have 4Q23 GDP “Round 1” on Thursday plus Personal Income and Outlays with PCE Inflation on Friday. The PCE release is one of those that can kick you twice on PCE spending trends as well as the Fed’s favorite in the Core PCE price index.