Footnotes & Flashbacks: Asset Returns 6-25-23
We frame asset returns after a bumpy week for equities and lingering questions on the UST curve.
We look at asset returns as the equity markets take a deep breath and reassess conditions after a very strong stretch.
The UST curve debate is staying in high stakes mode on the theory that a surprise “no landing” scenario could punish duration without much reward for spreads that are still running tight in long term context.
HY credit seems to be wondering whether compressed sub-median HY spreads can present favorable risk-reward symmetry from here with the clock ticking, maturity schedules compressing, and default forecasts worsening.
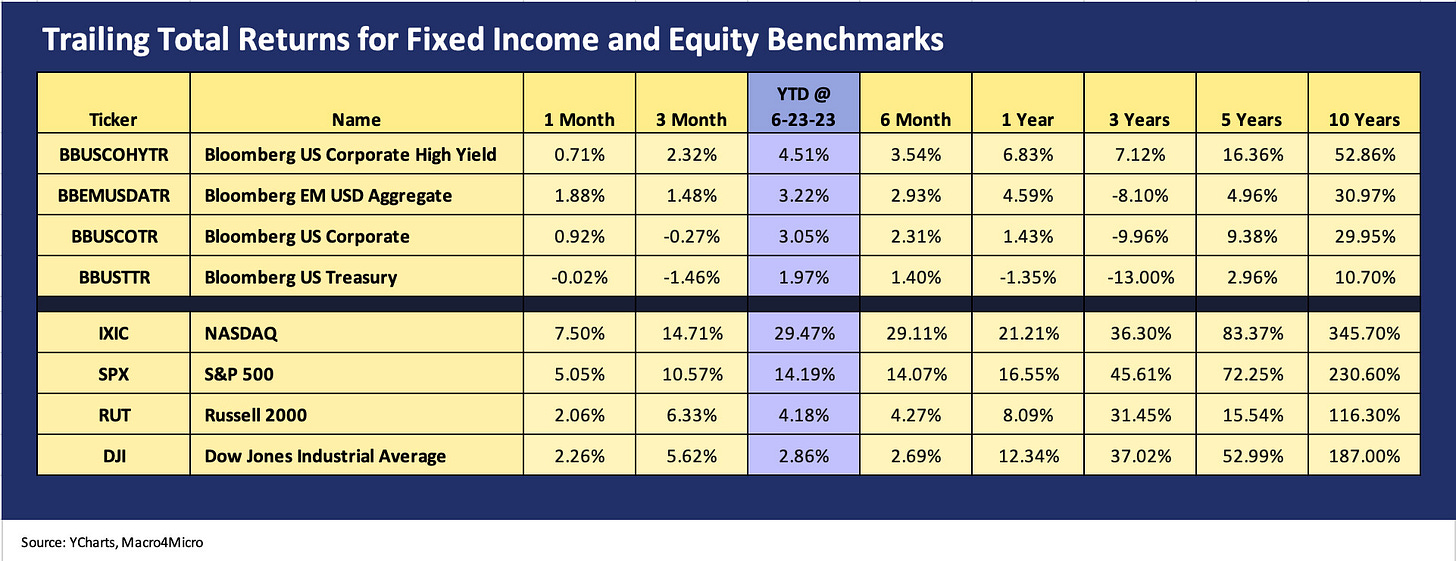
The above chart updates total returns for the main debt and equity asset classes we track each week. We line them up in descending order of YTD total return. We see more of a battle in credit quality tiers than in equities, where growth stocks and tech equities have been running away from the pack over the past two months to erase the bear market. Credit risk is coming under more scrutiny now, and we see IG return ahead of HY trailing 1-month and moving closer on 3-months and YTD returns.
In the debt mix, US HY bonds saw their lead erode with material spread widening this week as HY posted a negative return week. Spread widened on the order of 25 bps (ICE), but that does not change the fact that US HY spreads has a good MTD and good trailing 1-month on OAS. Meanwhile, IG bonds held serve this week and did not see weakness in risk pricing as demand for IG bonds has continued to hold in well. The absolute level of yields has been driving the bonds story line more than relative OAS in historical context, which for their part look rich. That focus on all-in yields after a long drought will change in time, and investors will start looking for more generous spreads to be added to the more attractive UST curve after years of low UST sticker shock.
For equities, the “Magnificent 7” is becoming part of the daily lexicon as AI chatter rules the headlines and financial media commentary. More companies are out talking about where AI fits in their business plans. At this point, we are waiting for McDonald’s to launch an “AI Burger.” Placing a value on the AI upside in equity valuations defying logical numerical valuation. There are signs of valuation angles breaking out into their own world of rationalizing valuation approaches. The forward valuation murkiness hearkens back to the late 1990s.
There are plenty of reasons to believe in AI, but it is more questionable trying to make up a methodology to put something in the context of an objective framework. In the old days (1990s), the approach was to make up a revenue line projected years into the distant future and then multiply it. Those who made up a revenue number could make up a cost number and make it a multi-tiered fiction approach. It is the “pump them all up, sort’em out later” school.
Legacy approaches to such stories include a wish list revenue line, a highly theoretical cost structure, and a convenient discount rate. This will be interesting to watch as price targets get moved. AI and tech valuations are out of our wheelhouse, but history has not been kind. “Creative destruction” sometimes includes the credibility of bankers and analysts.
The above chart updates the 1500 and 3000 series, and the breadth story is still bleak even if it has gotten slightly better across more sectors. The week leaves Real Estate, Financials, and Energy in the negative zone YTD. Growth equities are running at +25% YTD or ahead of the trailing 1Y returns. The market is now balancing a mix of an AI chase with and uncertain yield curve that often bolsters or bashes tech equities.
S&P 1500 Industrials have come back to life a bit in recent weeks and have closed the gap with Russell 3000 Growth. We see some of that in the ETF return section below with even weighted indexes looking a bit better now relative to the distortions in the market cap weighted indexes.
ETF Returns, industry comps, and asset class proxies…
In the next 3 charts, we look across 25 ETF and industry benchmarks for the trailing returns of the past week, 1-month, and 3-months. We recently bumped up the count from 24 to 25 by adding an S&P 500 equal-weighted index (Invesco’s ETF ticker RSP). The returns are distorted by the largest names in the market-weighted S&P 500, so we added another frame of reference (see Reversal, Takedown, or Escape? Market Weighted vs. Equal Weighted 6-6-23). Lower weightings of the mega-cap names are more logical in a well-diversified portfolio.
1-week asset returns…
For the past week, we saw only 5 positive returns in the mix and 20 negative with the Regional Banks (KRE) getting hit again and sitting on the bottom. Energy, Real Estate, Small Caps, and BDCs were clipped. In the case of energy, doubt on commodities pricing has been popping up a lot while real estate is getting tagged for less competitive yields relative to risk free alternatives. KRE also faces the sustained anxiety of how the commercial real estate downturn will unfold.
The outperformers were limited in number at 5. No line item put up a weekly return at or above 1%. We see 3 of the positive return line items for the week in high quality fixed income with UST (GOVT), AGG, and IG bonds (LQD). Builders came out on top on the back of good numbers from the top down (see Housing Starts: Slow and Steady Sequential Moves 6-20-23) and some positive color from KB Homes in its earnings call (see KB Home: Credit Profile 6-24-23). The headline flows from the street have also been upbeat on builders and supplier chain names. Behind XHB was the defensive healthcare REIT (XLV) at a slight positive.
1-month returns…
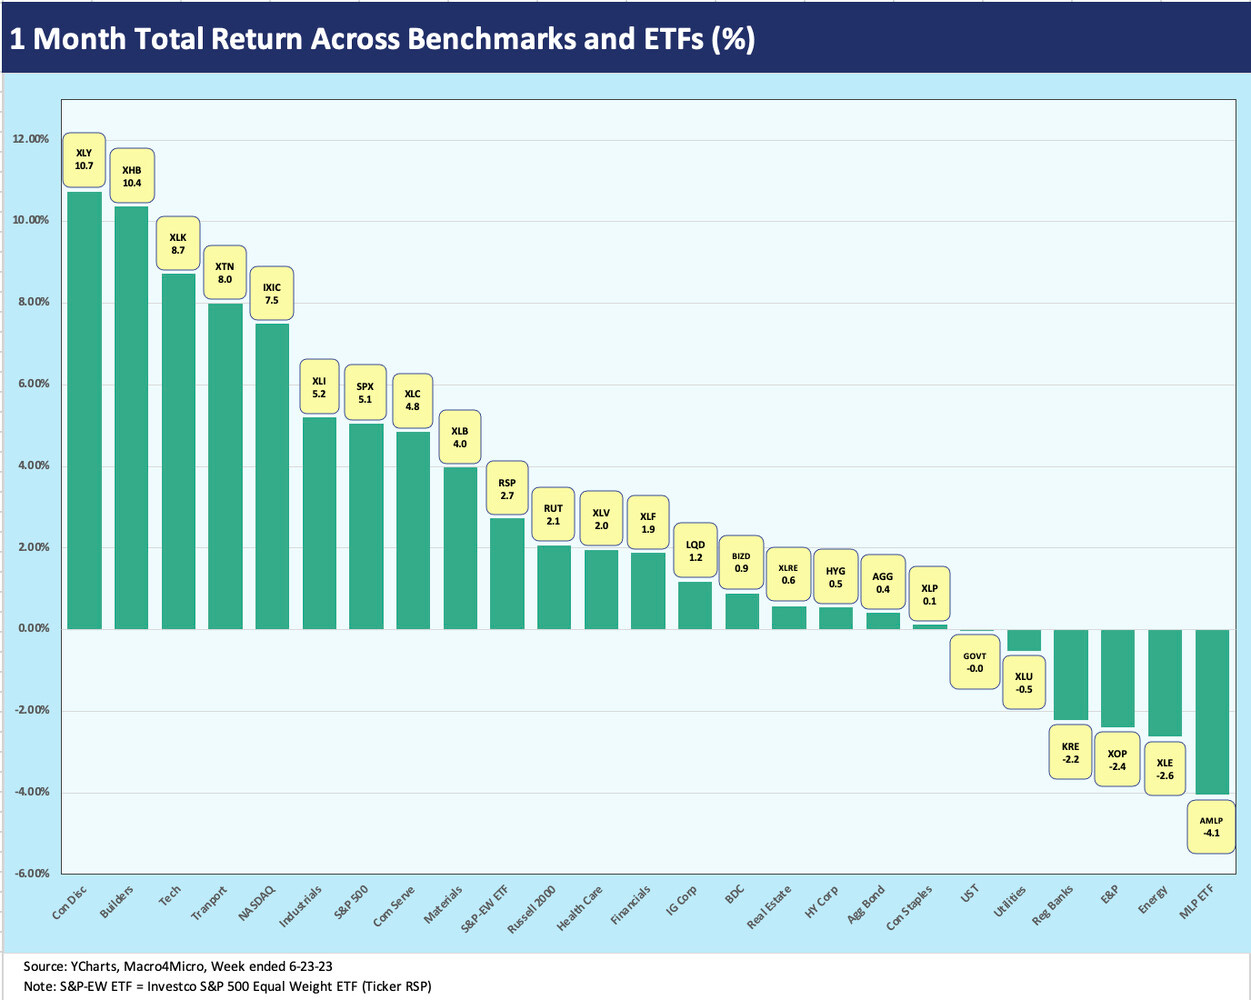
The 1-month returns show 19 positive and 6 negative. We see a solid equity rally broadly but some notably positive trend lines in some cyclical sectors such as Building (XHB) at #2 and for Transport (XTN) at #5. That is also the case in the running 3-month return list detailed below. We see 3 of the Top 5 in some of the sectors with high exposure to tech or the Magnificent 7 names. As detailed in earlier commentaries, Consumer Discretionary (XLY) is disproportionately exposed to Amazon and Tesla.
The Energy sector was in the doldrums for the trailing month with the midstream ETF (AMLP) on the bottom and the diversified energy ETF (XLE) second to last and E&P ETF (XOP) one notch above that. Regional Banks (KRE) and the defensive utility ETF (XLU) round out the Bottom 5.
3-month returns…
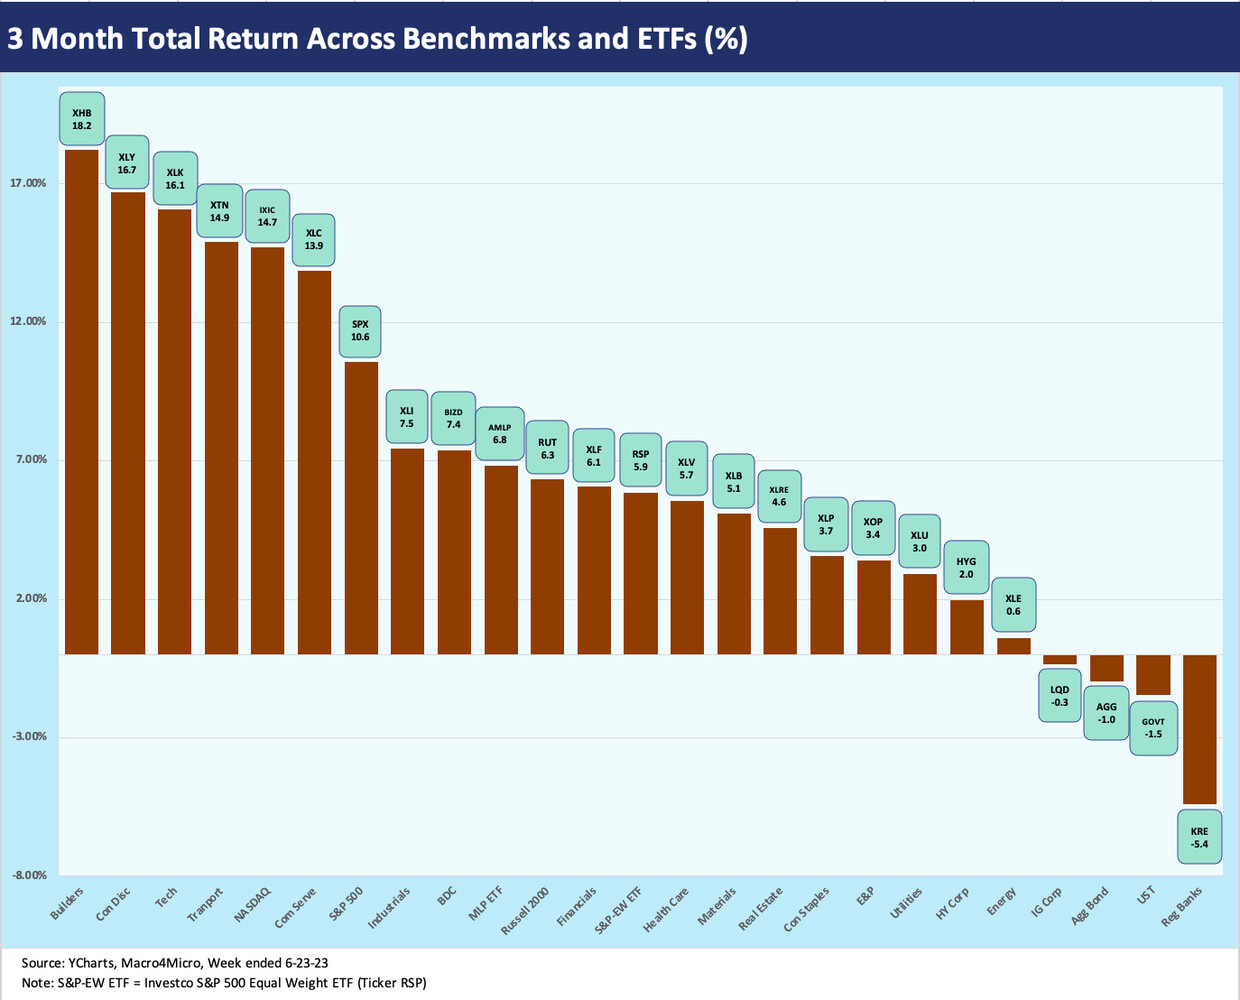
Looking back across the trailing 3 months, we see the effects of the major stock market rally with 21 positive and 4 in the negative zone. The negative returns include 3 high quality fixed income ETFs and the Regional Banks ETF (KRE) alone in the red zone. The US HY ETF (HYG) managed a 2.0% return near the bottom of the positive list as tight spreads and mixed UST curve trends still leave an uncertain outlook for both total returns and excess returns in HY as we move into the second half of the year.
The fed funds and yield curve threat is not deterring the strong flows into IG, but the performance math can be unforgiving if the UST bears prove right. We looked at the starting point for spreads and yields in a recent commentary (see Fed Funds vs. Credit Spreads and Yields Across the Cycles 6-19-23, Credit Spreads: Quality Differentials 2022-2023 6-12-23).
As discussed in the 1-month returns, it is positive to see Builders and Transportation in the Top 5 outside the tech checklist. Just below the Top 5, we see BDCs (BIZD) and the Midstream ETF (AMLP) as a reminder that high dividend income adds up. AMLP is lower risk than BIZD, but the latter mixes very high income and dividend payouts with a correlation to any changes of views on small cap equities and the credit cycle.


