
Footnotes & Flashbacks: Asset Returns 10-15-23
A daunting global backdrop drives UST rally that helped equity markets despite the war footing.


The week ran counter to the more bearish scenarios that could easily be spun around what could unfold in the Middle East despite a rudderless ship in Washington, where House dysfunction seems to be torching the lifeboats in the face of outsized defense and security needs.
The market enters earnings season with a mildly optimistic tone on where earnings growth can head into the 4Q23 and beyond with all eyes on guidance.
The worries around a strained UST curve could easily return given the supply demands as defense needs and Ukraine and Israel requirements weigh on US and allies’ national security.
We still see a shifting consensus on the Fed’s next actions that seem to overrule the dot plot and despite concerns around where energy markets could turn on geopolitical event risk.
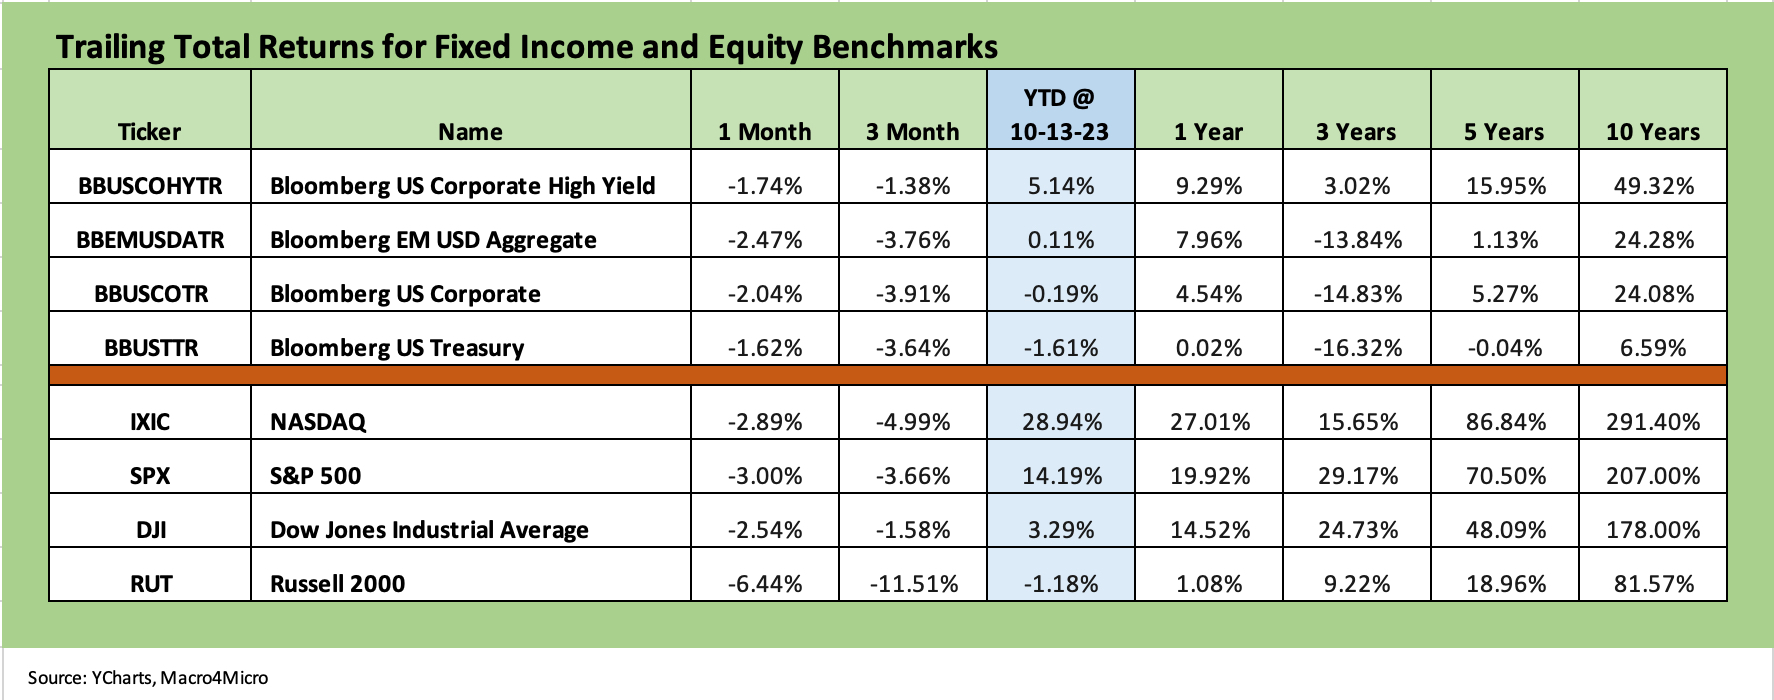
The chart plots the running returns for the debt and equity benchmarks we track weekly, and we see an overall mix for the trailing month still looking a lot like last week’s (see Footnotes & Flashbacks: Asset Returns 10-8-23). As we detail in the ETF and Benchmark returns section, the main swing factor in the market this week was a bull flattener of the UST curve and slightly favorable reaction in the equity markets with the S&P 500 and Dow slightly positive on the week and NASDAQ slightly negative.
We look at the yield curve dynamics in a separate Footnotes publication that we will post later today. As we cover in the ETF section below, the UST action pushed LQD, UST, and AGG ahead of HYG for the week. The anxiety around where US HY OAS could go has some material similarities to the confusion at the macro level on the direction of the economy and in the equity trenches on where fundamentals will trend. Oil prices are below late Sept but the forward-looking handicapping can shift on a dime (or an Iranian Rial or is it Toman?).
In the return chart above, we still see the trailing 1-month for debt in negative range from UST to HY credit and the same for 3 months with the YTD numbers only seeing US HY with total returns over 1% and two in the red zone.
The UST curve and not spreads have been the main event overall in bonds and that remains the case into October. Credit spreads have been very resilient “as the crow flies” from the start of the year. The Mideast headlines did not change that resilience this week. HY OAS even tightened on the week and remain well inside where 2022 ended at more than 50 bps tighter YTD despite the material widening from August. IG bonds outperformed during the week on the back of the UST curve and minimal OAS tightening.
Duration won the week while the fundamental backdrop got some early support from some major banks that reminded the market that floating rate secured assets and high margins on consumer credit have their advantages (especially when you don’t pay depositors market rates as with JPM). The real action on banks kicks into high gear this week with the other majors and the wave of regional bank reports and consumer focused banks rolling in.
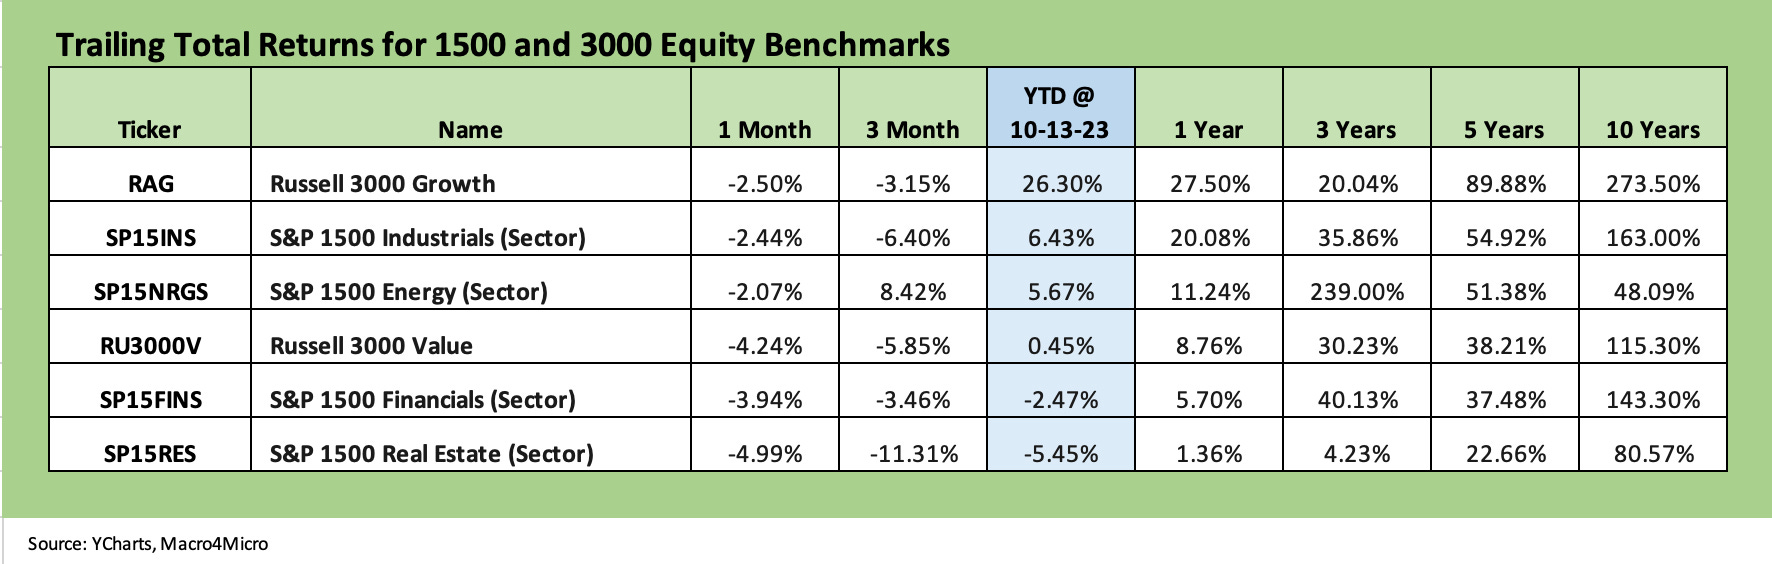
The above chart updates the rolling 1500 and 3000 series with the small caps not telling a positive story around domestic economic expectations and the risk-reward. We see all negative returns again for 1 month and 3 month, and the next two weeks will tell a story on whether Financials will see fresh doubts forming around legacy asset quality (notably in commercial real estate) and whether consumer quality is in fact starting to crack.
The regional banks that report (small caps and midcaps and large caps alike) will offer a useful view of the diversity across regional markets and broader asset buckets. The worry around regional banks is that squeezed interest margins are a fact of life for many that might not be balanced with higher income from so many floating rate assets. The swing factor is where loss provisioning is trending and notably in the consumer finance segments and commercial real estate. That will mean the bank analyst crowd has a lot more to digest this coming week than last.
The expanse of consumer credit indicators could help tell a story about the expected PCE line into 4Q23. If consumers are faltering and consumer credit is tightening, that will be something for the market (and Fed) to ponder. We get the first set of advance numbers on 3Q23 GDP On Oct 26. PCE has to turn negative to really signal a recession, and fixed asset investment has been solid. Employment is strong and wages are rising. Past contractions looked very ugly in those buckets before the market caved (and NBER weighed in at a massive lag).
ETF and Benchmark Returns
In the next section we update our usual asset class subsector returns through a mix of ETFs and benchmarks. We added the chart below for a quick visual on the relative symmetry of returns before we get into the weeds in the section below. Many would not have guessed the week after a terrorist exercise in slaughter and the start of a war would post a higher balance of positive returns than the other time horizons. That is a reminder of how fixated the US equity market is on UST rates.
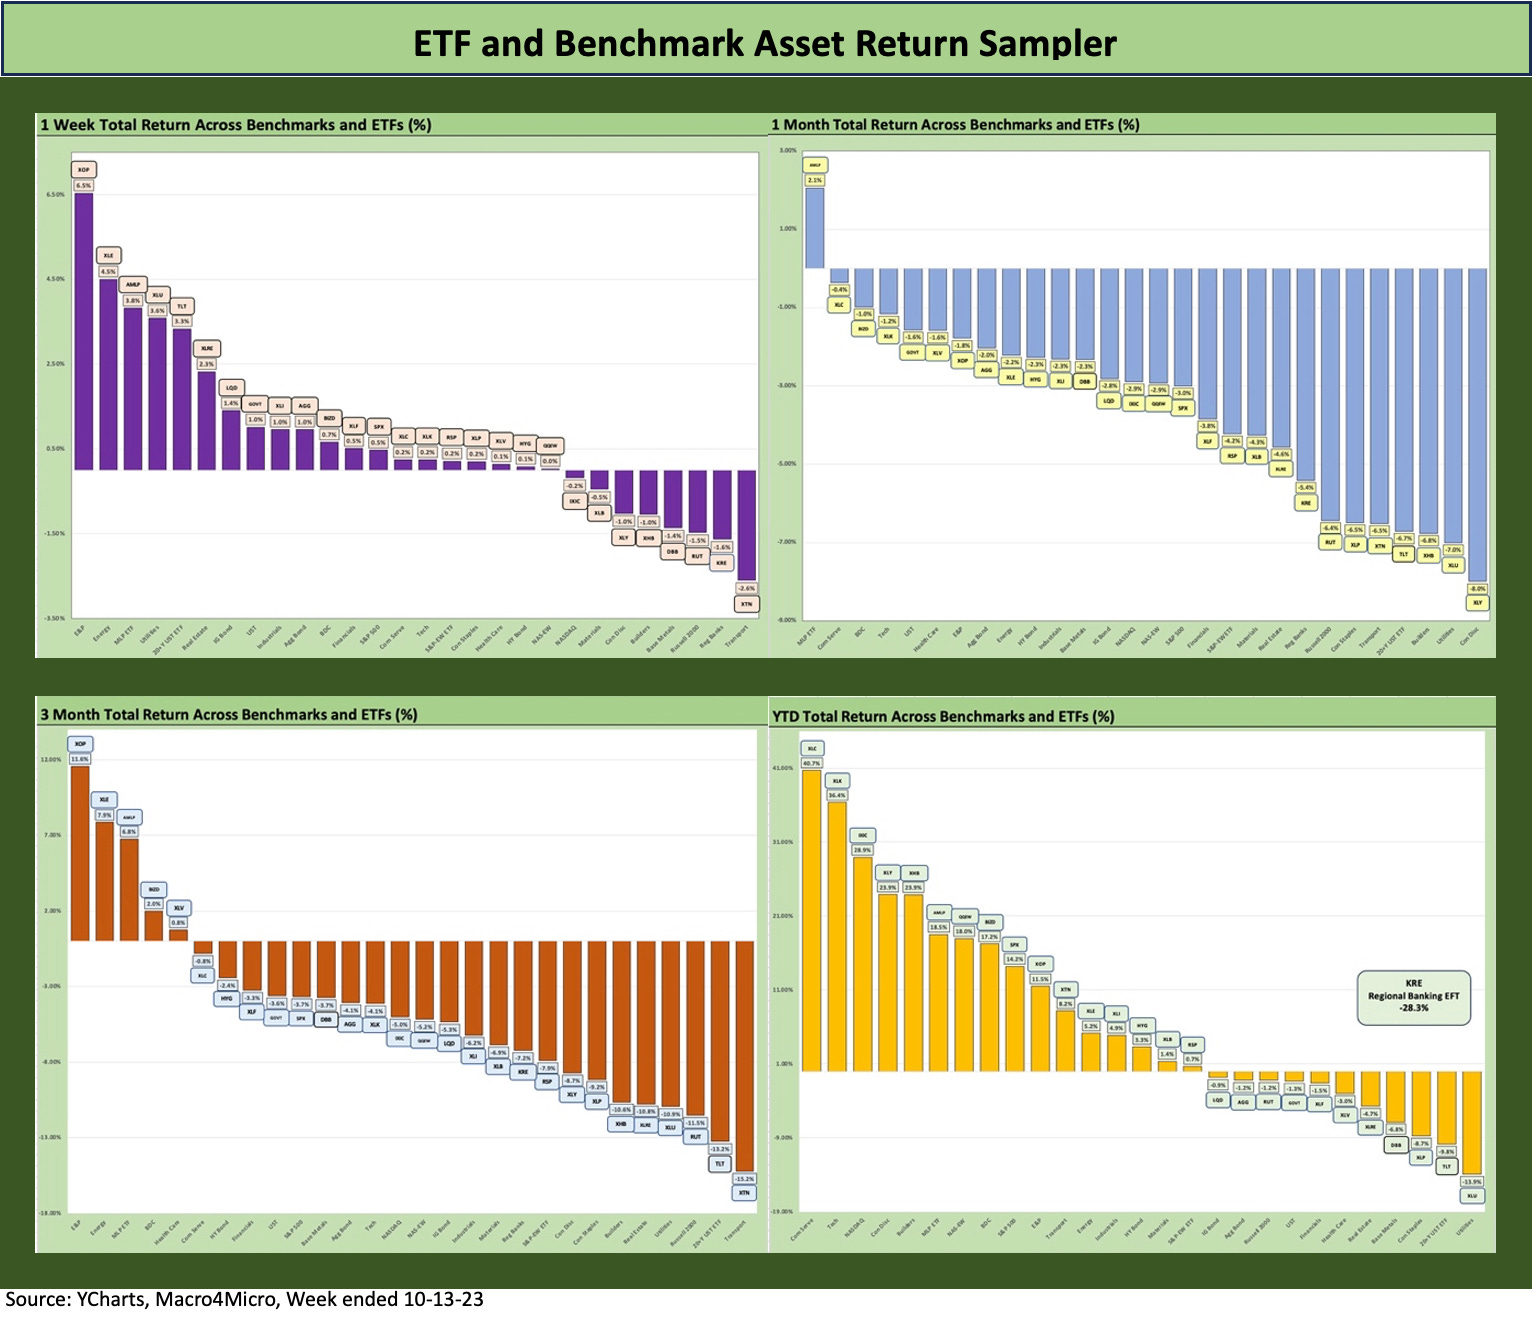
The shape of the 1-week return chart shows a clear bias to positive returns despite a lot going wrong in the US and the world.
Rhetoric got worse this week from Iran and now a second carrier strike force is headed that way. The theory is the UST curve will rally and the Fed will hold back on hikes. That was a start for some optimism on the curve, but the oil price variable will see a lot of airtime this week.
Events in Israel took focus away from the risks of a US government shutdown and looming breakdown within the GOP and across the aisle. After a few rounds, Jim Jordan heads into Monday ahead after Steve Scalise dropped out even after Scalise won a majority of the GOP.
The potential leader needs a majority of total Congress and that means he must carry almost the entire GOP. Jordan does not have enough votes as of today, and the bad blood is flowing within rival groups of the GOP. A Jordan election will likely assure a shutdown since he cannot get his wish list past the Senate even if he can get the votes in the House.
Jim Jordan usually gets associated with terms such as “extremist” and “bomb thrower” and “hard liner” or “Trump loyalist,” depending on what cable show is on TV. His claim to fame is that he was a two-time NCAA wrestling champion in the 134-pound weight class. He went to a “matchbook law school” and never sat for the bar (he claims). In contrast to his wresting weight, as a lawyer, he’s a bantamweight. He refused a subpoena from the Jan 6 Committee despite his conversation with Trump on the morning of Jan 6. He had been endorsed by Trump before Scalise won the majority vote. All this is to say that a Jordan Speakership precludes anything bipartisan—as in a budget.
The explanations on why the House process has failed in the “1 vote to vacate the chair” chaos have been petty and dumb. As usual, it is all the other guy’s fault. McCarthy blames the Democrats. He has been the proverbial deboned political fish, allowing the single vote clause to get his “prize.”
So far, the “recent three” in descending order of ranking in the party “before the fall” was McCarthy, Scalise, and Jordan. All three were election deniers in substance. We define a denier using only one box: “Did Trump lose?” There are many hard right house members who stepped up on that simple certification vote in support of the constitution. We could apply the same, “Did Trump lose?” question to the popular vote in 2016, which Trump also denies losing.
The takeaway is that this next week will have that House process running in parallel with the likely ground war underway in Gaza. Whether investors will make the leap to oil in the Middle East or the potential for major setbacks in Europe on Ukraine is hard to say. It should.
Rates ruled the week and not geopolitics…
On a more emotion-neutral note, the asset return profile for 1-week is an indication that the market has been more worried about rates than fundamentals. The bull flattening of the week as war signals escalated marked a notable departure from the UST curve action of recent weeks.
A few days does not change the basic challenges to the UST markets unless we see more reverberating effects that signal a broadening of the conflict and knock-on effects on global and regional economies. Iran is always a wildcard as are the next moves by Hezbollah in Lebanon. Syria tends to have its hands full with its own problems, but it is a supply route.
There is every logical reason to expect global relations to start breaking down in the coming weeks between the US and Middle Eastern nations. The foreign policy trade rags are working overtime on scenarios. Israel will not be pulling back, nor should they. Similar roads for Israel have been traveled before in 1967 (“Six-Day War”) and 1973 (Yom Kippur War). The same for the US in Iraq and Afghanistan. They are all different, but events can unfold in many different directions. The US has been down this road (“Mission Accomplished” sign, etc.).
Time Horizon Returns
In our next four asset return charts, we cover 1-week, 1-month, 3-month, and YTD time horizons for a range of ETF returns. We look at 28 different benchmarks and ETFs that cut across a wide expanse of the economy. We recently added the YTD version as we are now in the 4Q23 period. The usual question of “What kind of year was 2023?” is starting to look for a general description. The next 6-8 weeks will determine that.
As detailed further below, at least there are a lot of subsectors and industry ETFs well in the black YTD. We have seen materially worse years than this even during cyclical expansions. For a year where cash came in at #1 in returns vs. debt and equities, the year 2018 immediately leaps to mind. It is no coincidence that 2018 was the end of tightening ahead of some 2019 easing.
We recently added equal-weighed ETFs for the S&P 500 (RSP) and NASDAQ 100 (QQEW) given the market cap weighted distortions in the total returns for those benchmarks that had been driven for much of the year by the mega-names. The YTD return profile for market cap weighted ETFs vs. equal weighted ETFs offer a clear reminder of what an unusually imbalanced year it was to this point. The SPX returned +14.2% YTD while the S&P 500 equal weighted ETF (RSP) weighed in at 0.7%.
This week we also added two more ETFs to the mix with the addition of the iShares 20+ Year Treasury Bond ETF (Ticker TLT) and Invesco DB Base Metals Fund ETF (Ticker DBB).
We see TLT as a good proxy to add to the mix for a more concentrated look at how duration is performing each week. We have LQD, GOVT, and AGG already in the mix for high-quality fixed income, but TLT adds some extra price volatility tied to the steepening vs. flattening scenarios. The greater sensitivity to moves in the UST curve than what we see in the GOVT ETF will heighten the effects for a useful visual. TLT has been slaughtered looking back 2 years with TLT total returns around -45%.
DBB brings additional flavor on how base metals have been trending. Base metals (heavy in Copper, Aluminum, and Zinc) can be a useful indicator on any combination of sentiment on global manufacturing cycles or where China economic activity is headed. We thought that would add something to the portfolio color we lacked in the prior mix even though we had a mix of industrials.
When looking across some of the bellwether industry/subsector ETFs, it is good to keep in mind which narrow ETFs (vs. broad market benchmarks) get wagged more by the “Magnificent 7” including Consumer Discretionary (XLY) with Amazon and Tesla, Tech (XLK) with Microsoft, Apple, and NVIDIA, and Communications Services (XLC) with Alphabet and Meta.
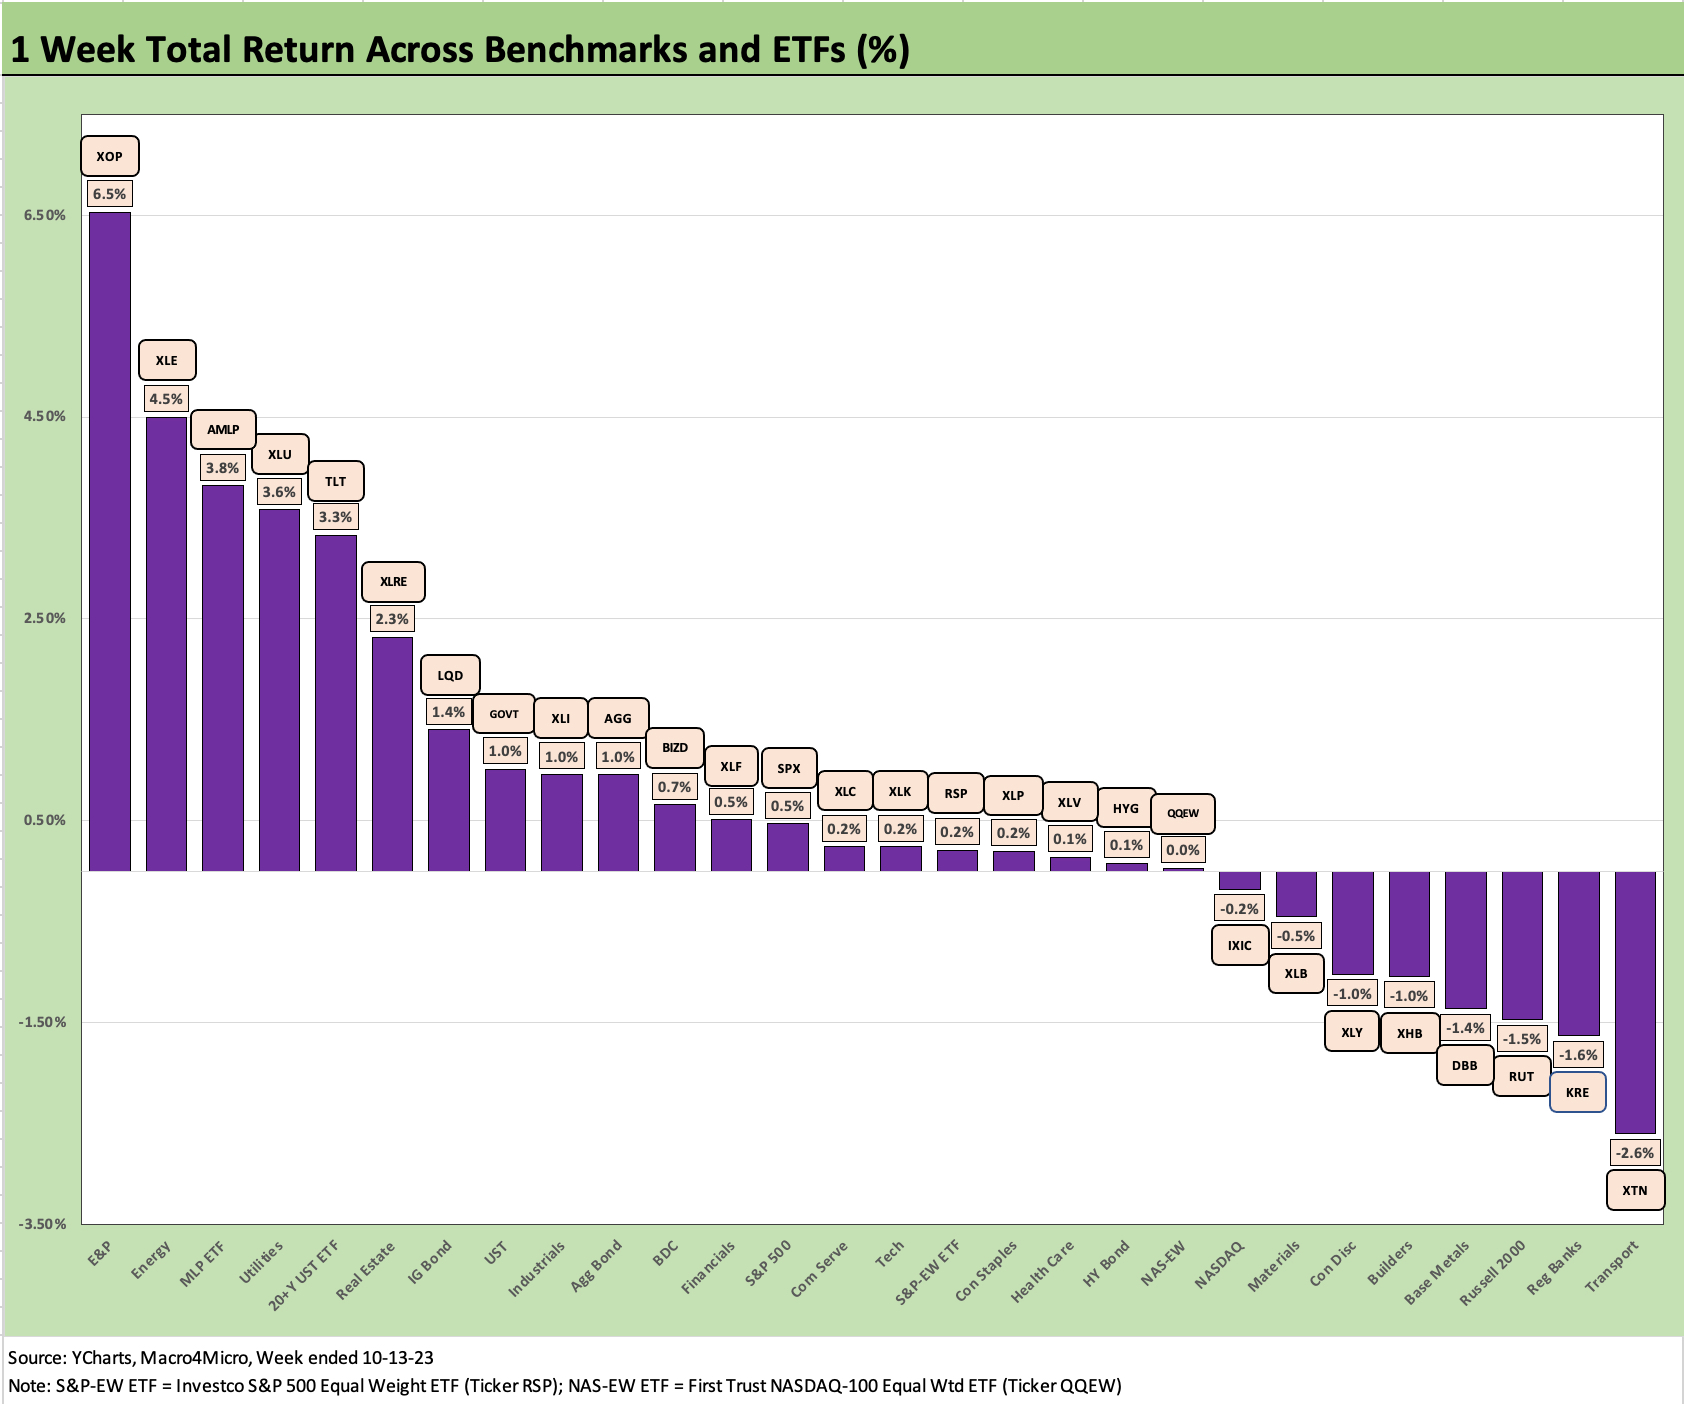
The above chart shows a winning week with 20 of 28 in the positive range. All 5 fixed income surrogates are in positive range with TLT weighing in at #5. The top 3 were the energy names as the market looks forward and not at the reality of oil being below where it was at the end of September. Oil popped on Friday to $87 handles WTI. We were at $90 handles on Sept 29. Away from the reality of what Iran might do, the oil market will be on the lookout for any mild misbehavior in the Strait of Hormuz and similar actions that prompt noisy headlines.
Perennial bottom dweller and Utility ETF (XLU) broke out this week for a #4 position with the likely explanation being the yield curve and perhaps value hunting. The 3.6% yield on XLU is nothing to get excited about at levels well below short UST. The week showed a rare positive showing of all fixed income LQD, GOVT, and AGG in the Top 10 with HYG below median for the week but still positive.
The bottom of the ranking included Transports (XTN) and Regional Banks (KRE). The Russell 2000 (RTU), Base Metals (DBB), and Builders (XHB) are in the low end again after its heady rise YTD. That mix does not reflect much cyclical optimism from here. Builders are heading into the off season and mortgages are still a big question mark from here after recent weeks. The YTD performance of the builders still have them in the Top 5 at #5 behind four Tech-centric and Magnificent 7 heavy ETFs and Benchmarks.
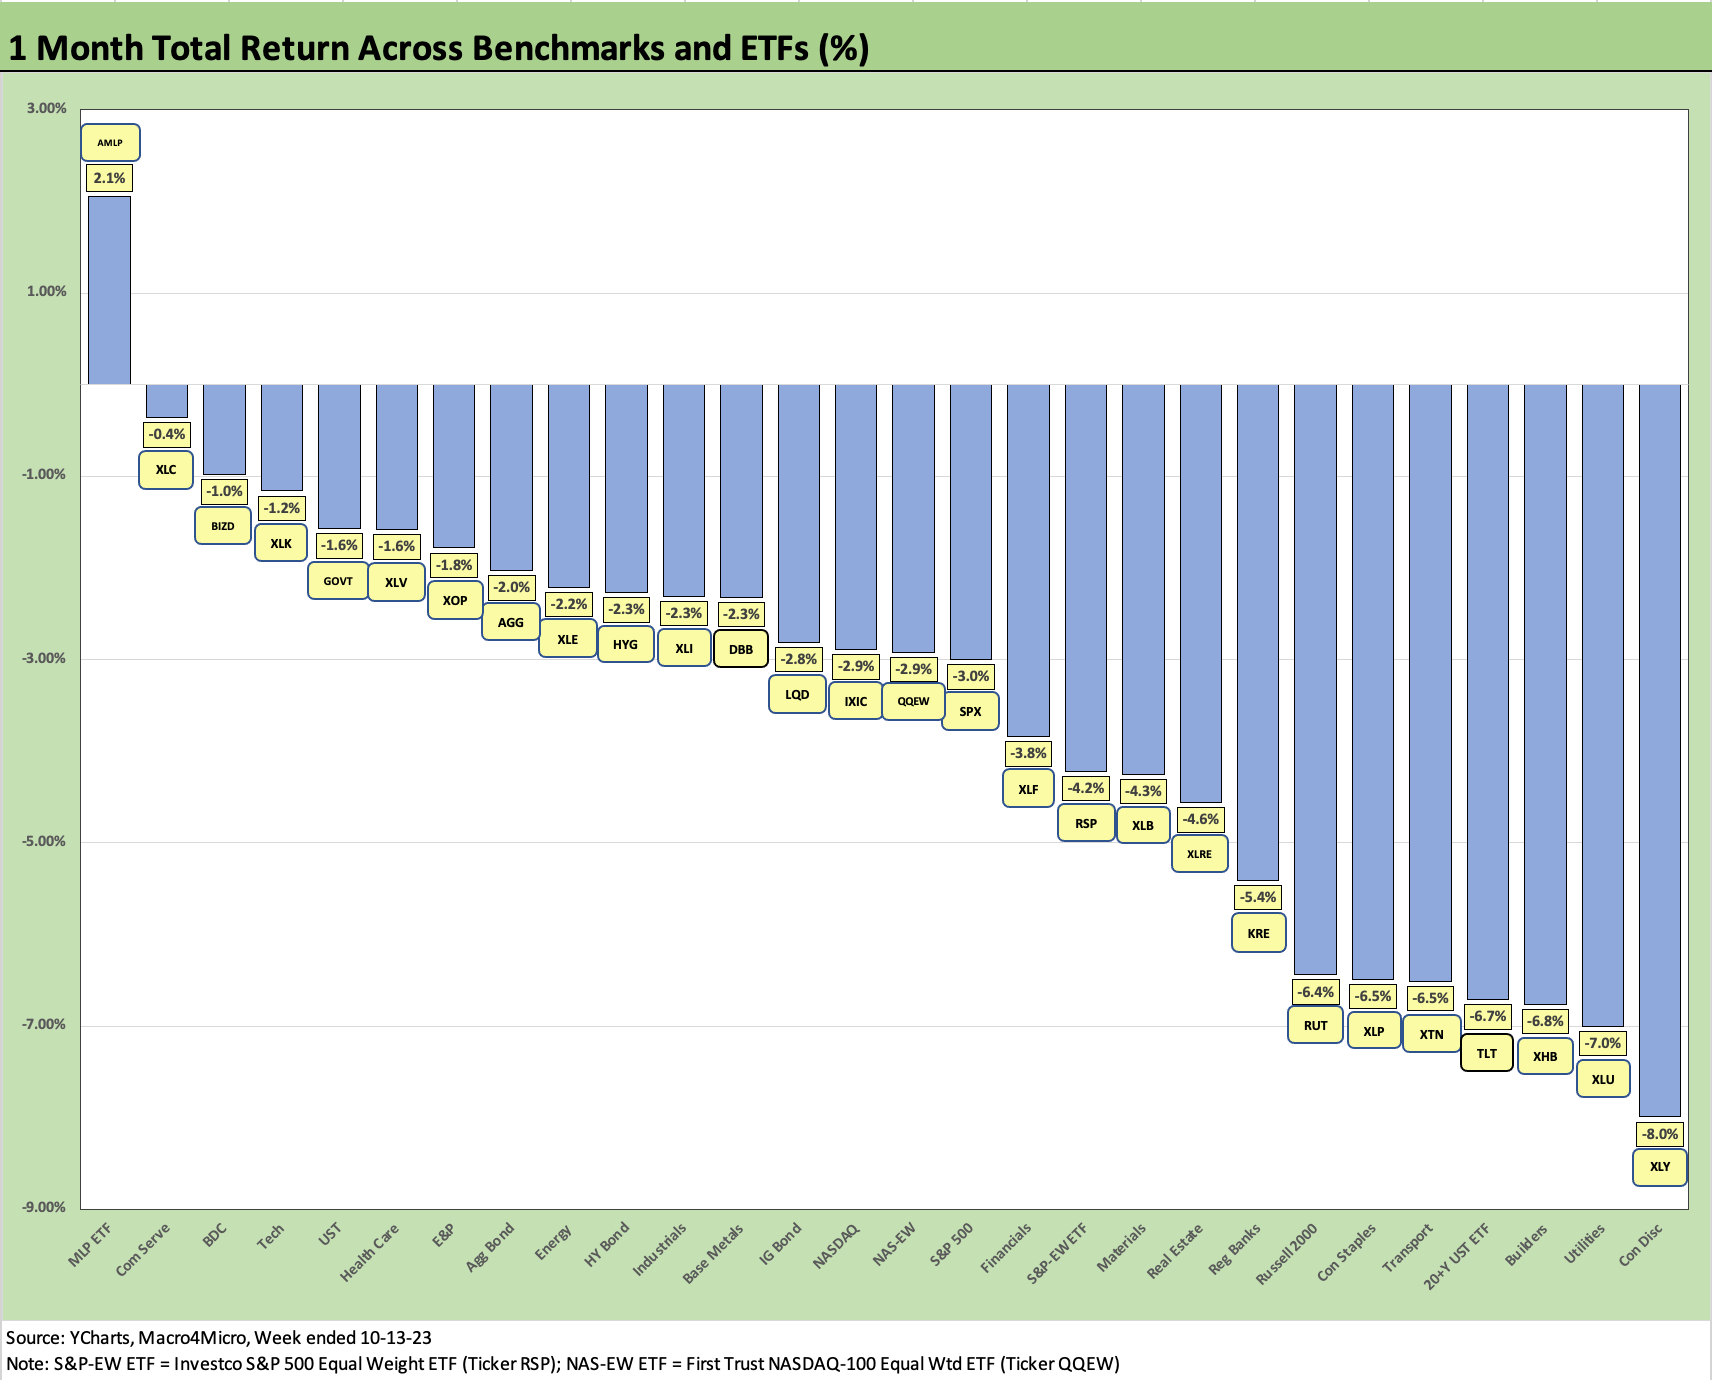
A modestly positive week could not shake off the effects of an ugly month. The chart shows a score of 1 positive and 27 negatives for the past month. Consumer Discretionary sat on the bottom as both Amazon and Tesla were beaten up the past month in a rare moment where they joined the more routine underperformance of Utilities (XLU), Transports (XTN), Staples (XLP) and Small Caps (RUT). We see Builders (XHB) continuing their late year fade on mortgages and giving back some of their Top 5 YTD performance.
Cyclical questions are still very much in the numbers with Transport (XTN) and Small Caps (RUT) still mired on the low end along with perennially weaklings such as Utilities (XLU) and Real Estate (XLRE), which both feel the pain of asset class questions and higher rates.
Duration and fundamentals both lost for the month, but fixed income ETFs did move up the ranks with a strong past week. We see the volatile and duration sensitive TLT ETF in second to last after the duration abuse of late Sept/early October, but for the full month GOVT and AGG and HYG crawled into the Top 10 with slightly negative returns. LQD was a few notches below. TLT rallied in the past week as noted earlier.
Energy ETFs were mixed with AMLP the sole winner of the 28 in positive territory. The diversified Energy (XLE) and E&P ETF (XOP) were in the negative zone with weak oil prices down sharply from late September. That said, XOP and XLE were still in the top 10. That could change in a hurry, and the Exxon deal for Pioneer is still a reminder that the majors can find oil and gas by buying as well as drilling.
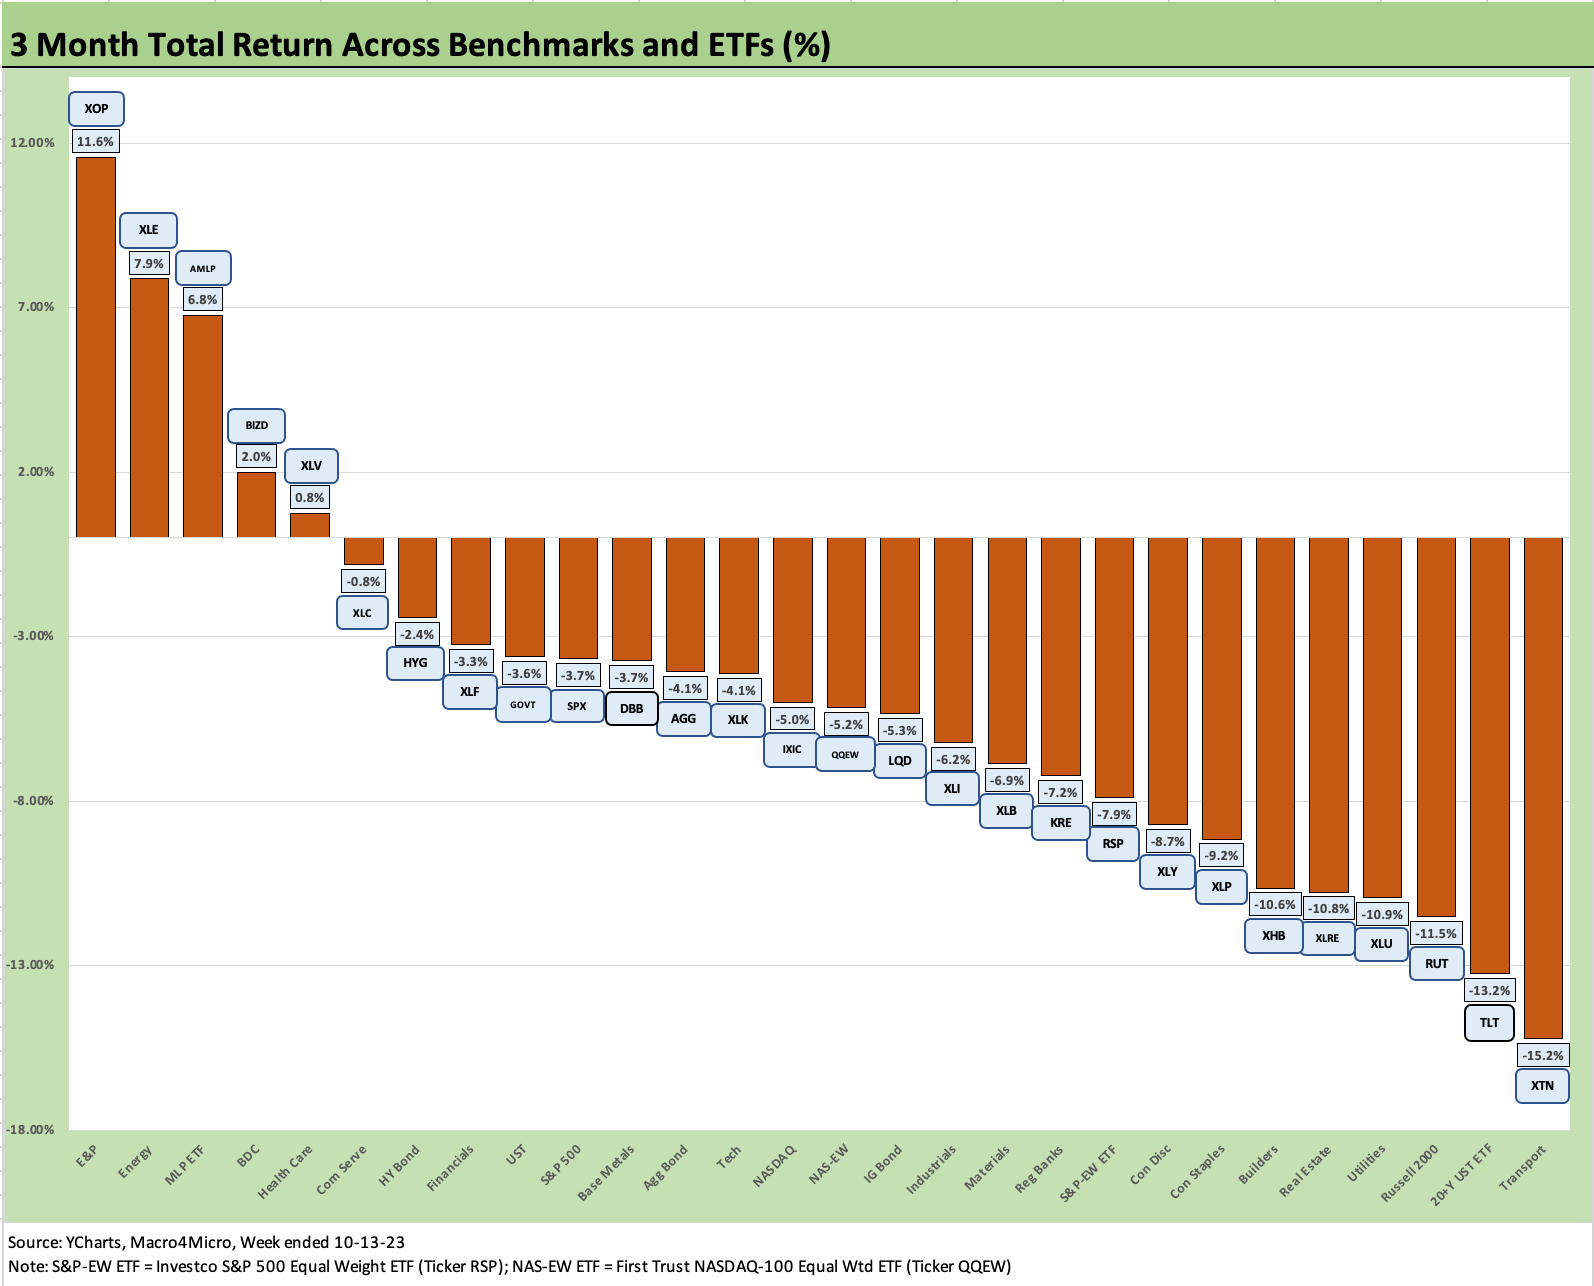
The 3-month period shows the wear and tear of a tough summer with only 5 positives and 23 negatives. Of the 5 in the black, 3 were energy with E&P (XOP) at #1, Energy (XLE) at #2, and Midstream at #3. BDCs (BIZD) came in #4, and Health Care (XLY) came in #5 to round out those in positive range.
The BDC sector (BIZD) has continued to make some noise as an opportunity and ranked #4 for the trailing 3 months. The asset quality and virtue of floating rate secured debt is getting more broadly recognized in a structure that passes through income into high dividends.
The BDC sector is not only interesting from the standpoint of stand-alone income stock alternatives but also for what BDCs say about the broader asset class effects on trends in private credit. In addition, underneath all of that information we can get some signals on credit availability (or contraction) for the extended, diverse tail of Small and Medium Sized Enterprises (SMEs) in the economy. If there is a sense that regionals will be tightening credit, the private credit world beckons.
As detailed in the next chart, BIZD is #8 YTD. We will see the next reporting wave for BDCs later in the earnings season, and the combination of layering in low coupon unsecured fixed rate debt on the liability side while funding secured floating rate assets is making a difference. That asset base flows into higher income under the oversight of high-quality credit risk managers. Risk perception and relative value has been turning more favorable. The swing factor is always asset quality trends, and those have been broadly solid with some exceptions in 2023.
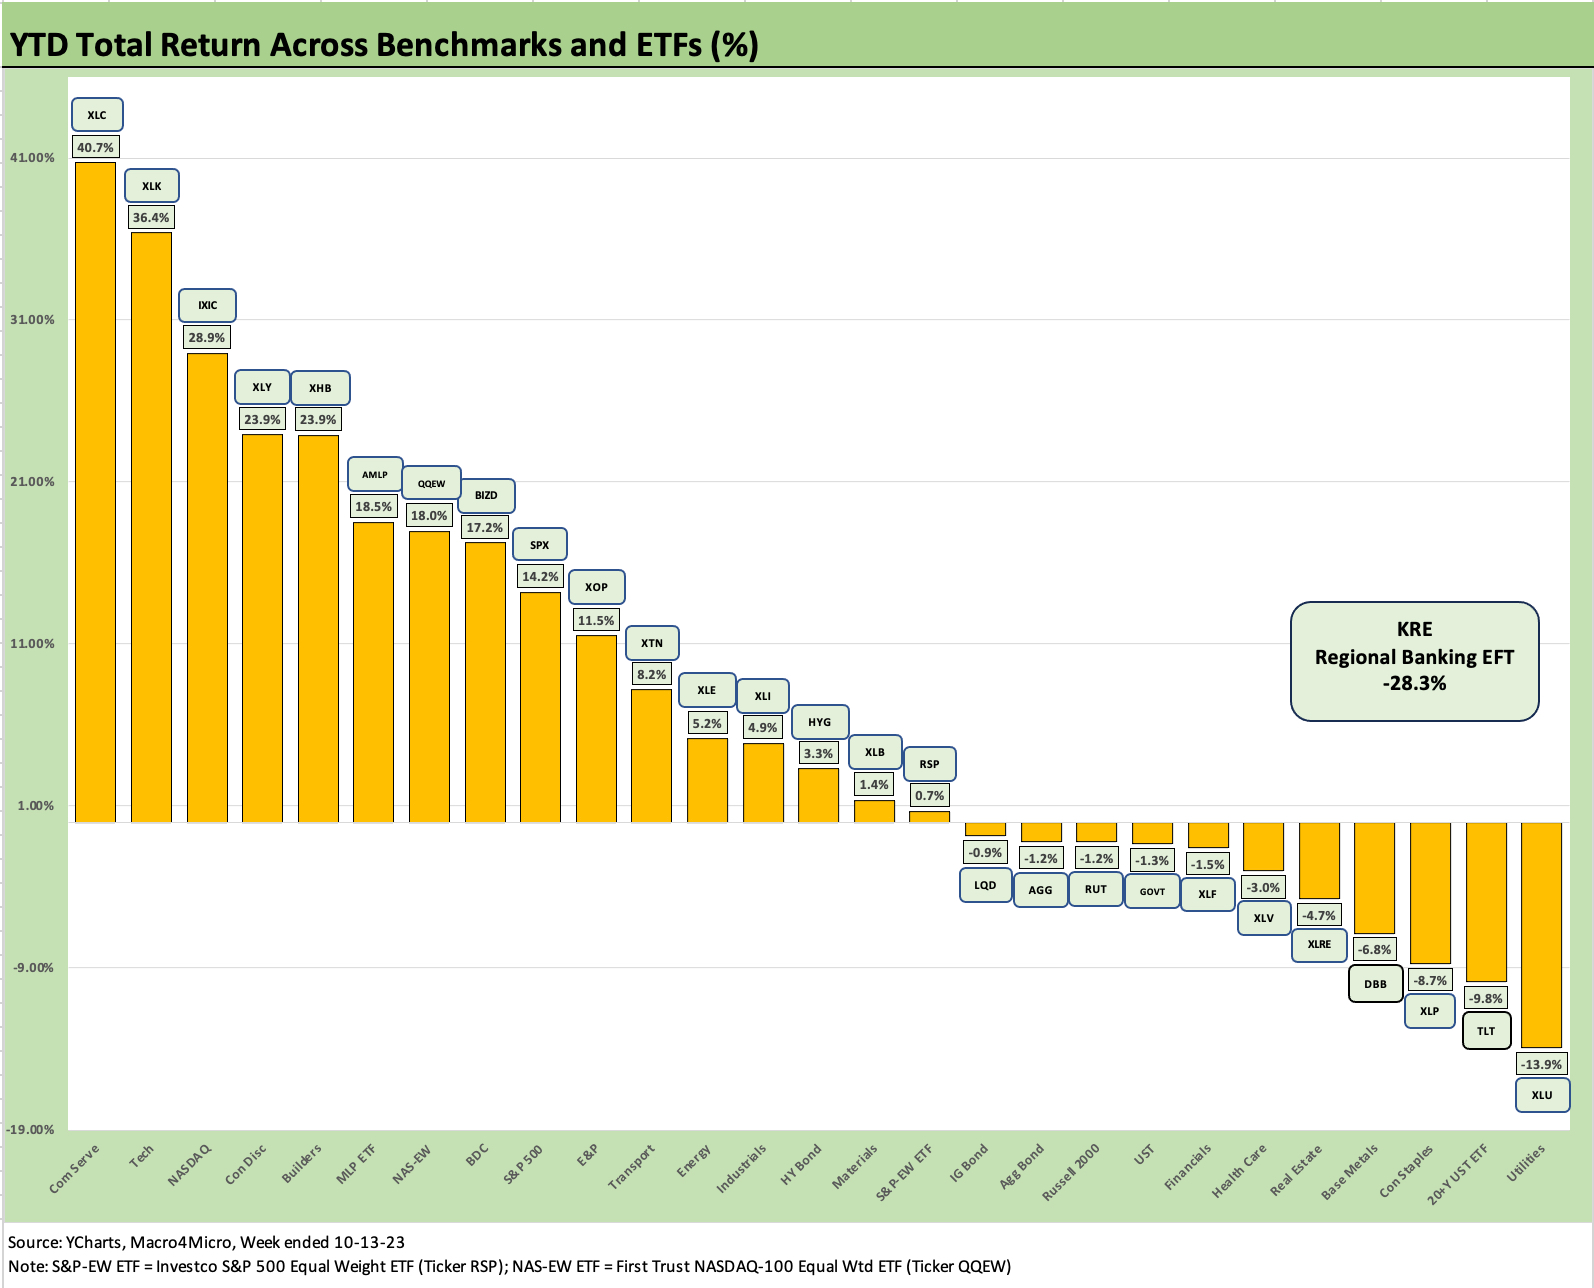
The YTD performance is 16 positive and 12 negatives with a Hi-Lo range of 69 total return points. If we toss out the Hi-Lo names, we are still at a Hi-Lo range of over 50 points.
We see 4 of 5 fixed income proxies in ETFs in negative returns with only HYG modestly in the black at +3.3%. We also see the newly added Base Metals ETF (DBB) in the Bottom 5 YTD along with Staples (XLP), and Real Estate (XLRE). The High Yield Bond ETF (HYG) was able to put up positive returns on the material spread tightening earlier in the year as well as on a higher base of coupon income.
As a reminder, the HYG issuer mix is comprised of larger more liquid names that leave out a lot of the “hair” in HY index that keep yields so high (9.2% YTW on 10-13-23 for ICE). The HY index YTW is much higher than the dividend yield on HYG (5.9%). The HYG dividend yield of 5.9% is not too far from the 3M UST (5.5%) and 6M UST (5.6%). The type of macro development that could drive easing by the Fed (weak economy) could also drive HY spreads wider, so the trade-off favors waiting on US HY for wider spreads.
As another frame of reference, the dividend yield in BIZD is above 11% with a play on the credit cycle and small cap loans and a bias toward leveraged loans (but not exclusively on leveraged SME loans).
The underlying assets in BDCs are less liquid and the BDC or ETF securities are further down the capital structure (i.e., both the BDC stock or an ETF is an equity), but the choices on key return drivers (capital gains vs. cash income) are food for thought on where you see the curve and the credit cycle trending. Exposure to redemption risk is another swing factor to ponder.
As we look at our YTD numbers, we see our latest addition TLT (20+ year UST ETF) third off the bottom at -9.8% with Utilities (XLU) doing slightly worse at -13.9%. Regional Banks (KRE) were dramatically worse at -28.3% and KRE earned its own penalty box off the bar chart.
The heavy unrealized and realized losses on UST securities and mortgages has been a big part of the regional bank story of strains and stress. With JPM, Wells and Citi having reported already, this coming week and the week after will bring a deluge of other bank earnings. The UST losses (unrealized or realized) will be a topic of focus.