
Footnotes & Flashbacks: Asset Returns 9-17-23
We update asset return profiles and give some context to the UAW strike politics.


The past week followed the recent pattern of little to celebrate with fixed income still feeling the drag from duration and equities “decidedly undecided” on the direction of the market.
The UST market awaits some color this week from Powell and the FOMC’s new dot plot, and we will get more details on how housing is reacting to sustained 7% handles in mortgage rates with starts and existing home sales teed up.
Credit spreads were flat in high quality corporate bonds and tightened slightly down the HY food chain, so the economic indicators and the credit markets were not signaling trouble this past week even if equities made a big swing up and down to wrap the week.
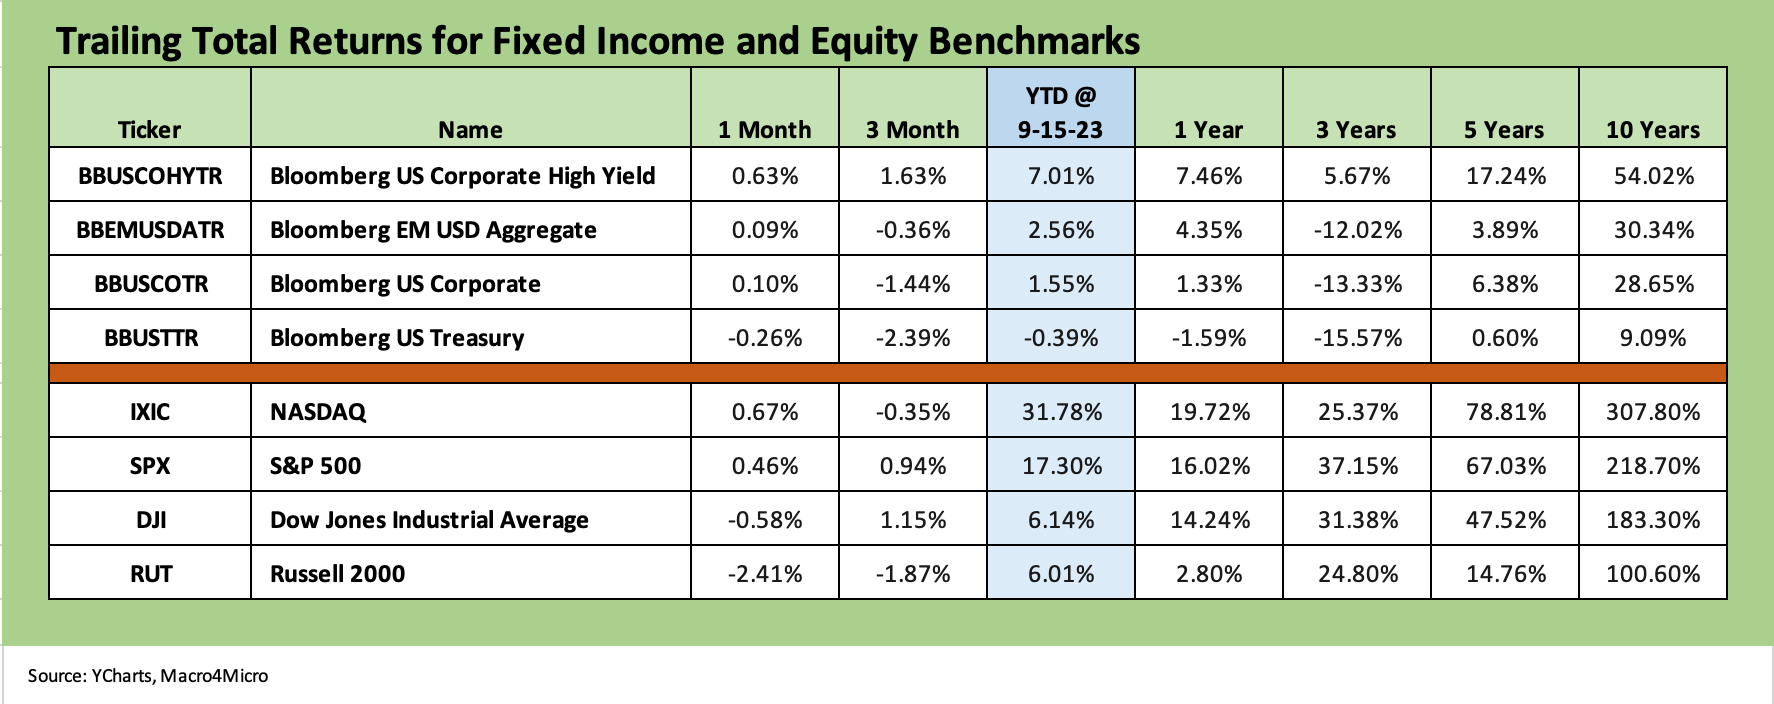
The above chart updates the debt and equity benchmarks and subsectors we watch each week in the Footnotes publication. Bond benchmarks have clearly struggled of late on duration and the stubbornly rising UST curve. Spreads have hung in well. We look at the yield curve dynamics separately in the State of Yields Footnotes publication we produce (see Footnotes & Flashbacks: State of Yields 9-16-23).
We see 3 of 4 fixed income benchmarks in the negative zone over 3 months and minimal for the past month. On a YTD basis, only HY has turned in respectable numbers on the big early year spread rally and with less duration pain in returns. HY spreads are in over 100 bps from 12-31-22 to the end of last week (ICE), but HY index spreads are relatively flat vs. late July 2023.
When we look at the HY index numbers above vs. the HYG ETF in the return section further below, the main difference is the index benchmarks include a wider range of smaller, less liquid, and higher risk line items that usually put the running investment returns of the HY index (in constructive times) higher than the mix used by ETFs. That effect can work in reverse in selloffs. For this week, HY saw tightening in a market where credit spreads remain compressed all along the spectrum (see Credit Spreads: Proportions Matter in Risk Compensation 8-14-23).
Equities have been somewhat dismal for the trailing 3 months and had a weak 1-month period. We look at more of the sectors in our ETF recap further below and the broader market benchmarks in the next chart series.
The NASDAQ and S&P 500 had a good year at the index level, but life gets more complicated on the “market breadth” topic and the oft-discussed Magnificent 7 distortion and some from their less magnificent siblings and cousins in various tech subsectors. As an example, the S&P 500 YTD numbers in the +17% area noted above contrast with the equal weighted S&P 500 ETF (RSP) YTD return of 5.5%. That is a major difference with the RSP more aligned to weightings in a well-diversified portfolio.
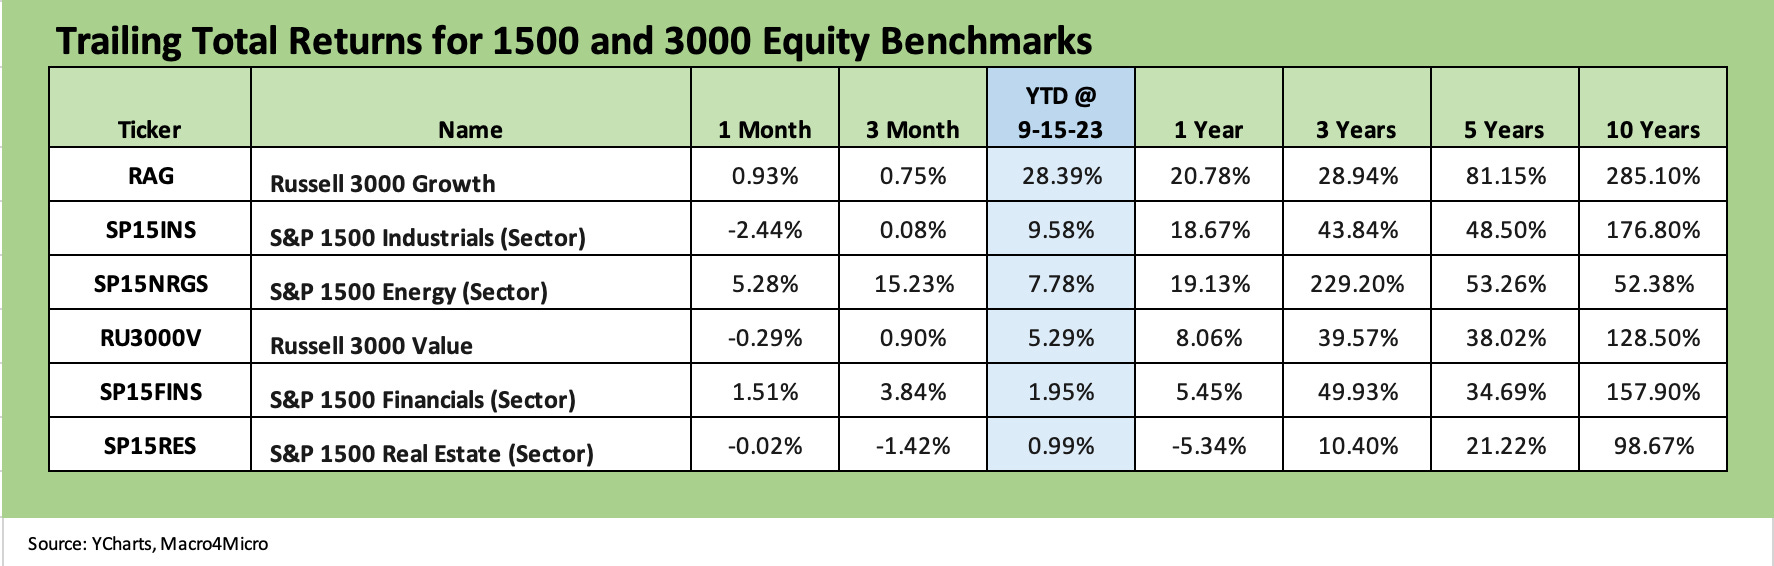
The above chart updates our 1500 and 3000 series with another round of weak numbers for Growth but also a negative month for Industrials that brought down the 3-month Industrials return to barely positive. Small Cap Growth and Small Cap Value are both weak. That is not a favorable confidence vote in the US economic cycle in those subsectors.
Energy obviously has been the big winner of late on OPEC+ supply action. Financials are trying to pick themselves up off the mat but squeezed interest margins and asset quality and loss reserving second guessing remains rampant. Real Estate remains in the doldrums even if week to week there might be some swings. Real Estate remains just below 1% YTD and is negative for the rolling 3 months.
The unpredictable UAW strike risks could keep roiling markets…
The dynamics of the UAW battle will be interesting to watch to say the least. That is especially the case around the EV issue with Biden’s team wading into the collective bargaining battle and “working the phones.” Meanwhile, Trump has jumped in with a strategy of railing against EV and encouraging the UAW to pull the proverbial plug on the EV transition at their respective operations.
When people say politics does not mix with research, we would agree in the past but this time around it is a whole new world where ideology drives policy, i.e., decisions are not made based on factual analysis. That is true from both sides of the aisle, except one side is more inherently anti-factual in their rhetoric lately. EV’s are here to stay, and it is a matter of who wins and which nation will be the most protectionist to assure the advantages in the development and buildout of more consumer options in autos (so far, that looks to be the US as the most protectionist).
The booming capex around the EV transition (assembly plants, battery plants, mining initiatives) will give the legacy leaders of the US industry a shot at competitiveness longer term. Otherwise, the transplant belt (overwhelmingly red states) will be leading the pack against the UAW-based OEMs if they fail to make the commitment (maybe that is part of the motive for Trump railing against Detroit 3 EV initiatives…).
In the context of the UAW, the reality is that EV’s require far fewer bodies and much of the battery investment is in non-union JVs. That will keep everyone’s blood up.
Away from the guaranteed red state expansion in EV investment over time (Japan, Korea, and Germany lead the pack in ICE assembly capacity), a lack of aggression in the area of EVs by GM, Ford and Stellantis (legacy Chrysler operations) would be a decision to officially cede the supplier chain control and technology leadership to China (or Japan, Korea and Europe). The damage from there on investment and opportunity costs will radiate from there.
Investment in semiconductor capacity in the US encouraged by more domestically based downstream buyers – such as manufacturing, supplier chains, and OEMs. In other words, undermining the next generation of technologies in the global auto industry by undermining potential domestic OEM capacity is a tad moronic from a policy standpoint.
Higher demand and more pricing power warms bipartisan hearts in a business context. They work behind the scenes to avoid challenging the ideologues and crazies. The theme positioning and demagoguery is not about P&Ls but about politics and power.
More investment and more high paying jobs are the end game we assume, but the political goal is to not let the “enemy” (the other party) get the kudos. On a side note, it is hard to be credible in making policy recommendations when some leaders still cannot say factually who pays the tariffs (it is the customer, not China).
The transition investments (in energy, autos, and mining alike) have thousands of construction jobs on the line and a lot of higher paying manufacturing activity that bring with it multiplier effects in services (freight and logistics, real estate, finance, supporting industry groups broadly).
If you look at the raw construction numbers (see Construction Spending: Demystifying Nonresidential Mix 5-9-23) or listen to the equipment rental companies (see Equipment: A Cyclical Confidence Booster 9-15-23) to name two easy examples, the economic benefits in nonresidential construction and industrial investment are quite clear from the infrastructure bill and CHIPS Act. We will get another round of construction numbers to start October that will be worth an update.
ETF and benchmark returns…
In our next three asset return charts, we cover 1-week, 1-month and 3-month time horizons for ETF returns. We look at 26 different benchmarks and ETFs that cut across a wide expanse of the economy.
We include equal-weighed ETFs for the S&P 500 (RSP) and NASDAQ 100 (QQEW) given the market cap weighted distortions in the total returns for those benchmarks that had been driven for much of the year by the mega-names.
When looking across some of the bellwether industry/subsector ETFs, it is good to keep in mind which narrow ETFs (vs. broad market benchmarks) get wagged more by the “Magnificent 7” including Consumer Discretionary (XLY) with Amazon and Tesla, Tech (XLK) with Microsoft, Apple, and NVIDIA, and Communications Services (XLC) with Alphabet and Meta.
1-Week ETF returns…
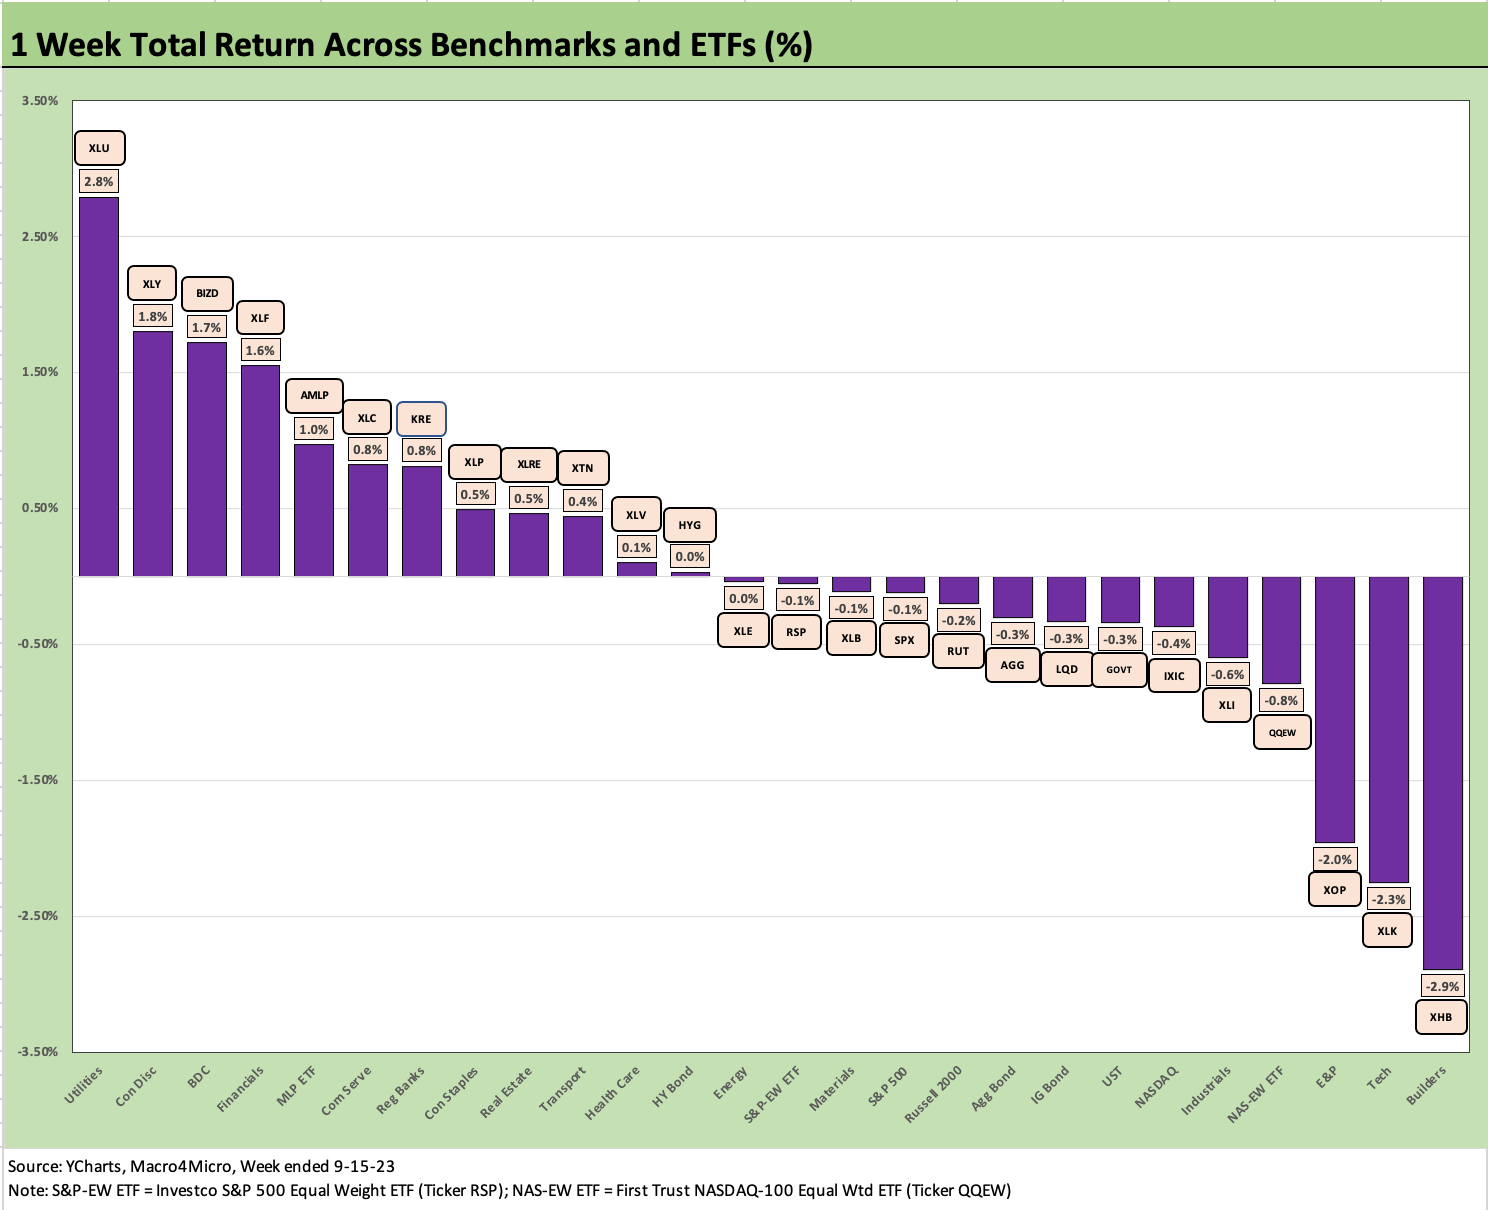
The above chart for the trailing week shows 12-14 with more negative than positive in a week where the S&P 500 and NASDAQ ended in the red and the smaller issuer count of the Dow barely in the black. Only 5 ETFs exceeded 1.0% on the week with the Magnificent 7 heavy ETF in the mix with Consumer Services (XLY) riding a solid week by Tesla. TSLA was the only one of “The Seven” to turn in a solidly positive week around +5% while 4 of the 7 were negative and no others topped +1% (AMZN and GOOGL were also positive).
On the losing side of the ledger, we see the Homebuilding ETF (XHB) on the bottom after a very strong stretch of superior performance that still leaves them in the Top 10 for the trailing 3 months and YTD only modestly behind the XLK Tech ETF YTD. Homebuilders have trounced the equal weighed S&P 500 ETF YTD (RSP) as well as almost doubling the broad market benchmark.
XHB now enters the seasonally slower period ahead for housing at a time when the FOMC will have some wrestling to do around inflation and how the Fed will do its balancing act on sticky services inflation (see August CPI: Inflation Fears…They’re Back?! 9-13-23). The Fed also must consider what oil could mean for the cost chain and how that flows into prices.
We know the Fed likes Core PCE, but the thing about the energy and petrochemicals inflation is that the downstream effects show up in goods and services pricing and are not so easy to back out with an “Ex-Energy” sleight of hand.
In energy assets, E&P (XOP) is rallying hard and took the lead over 3 months but fell down to the lower end of the rankings the past week despite a very solid a week for oil prices back above $90.
1-Month ETF returns…
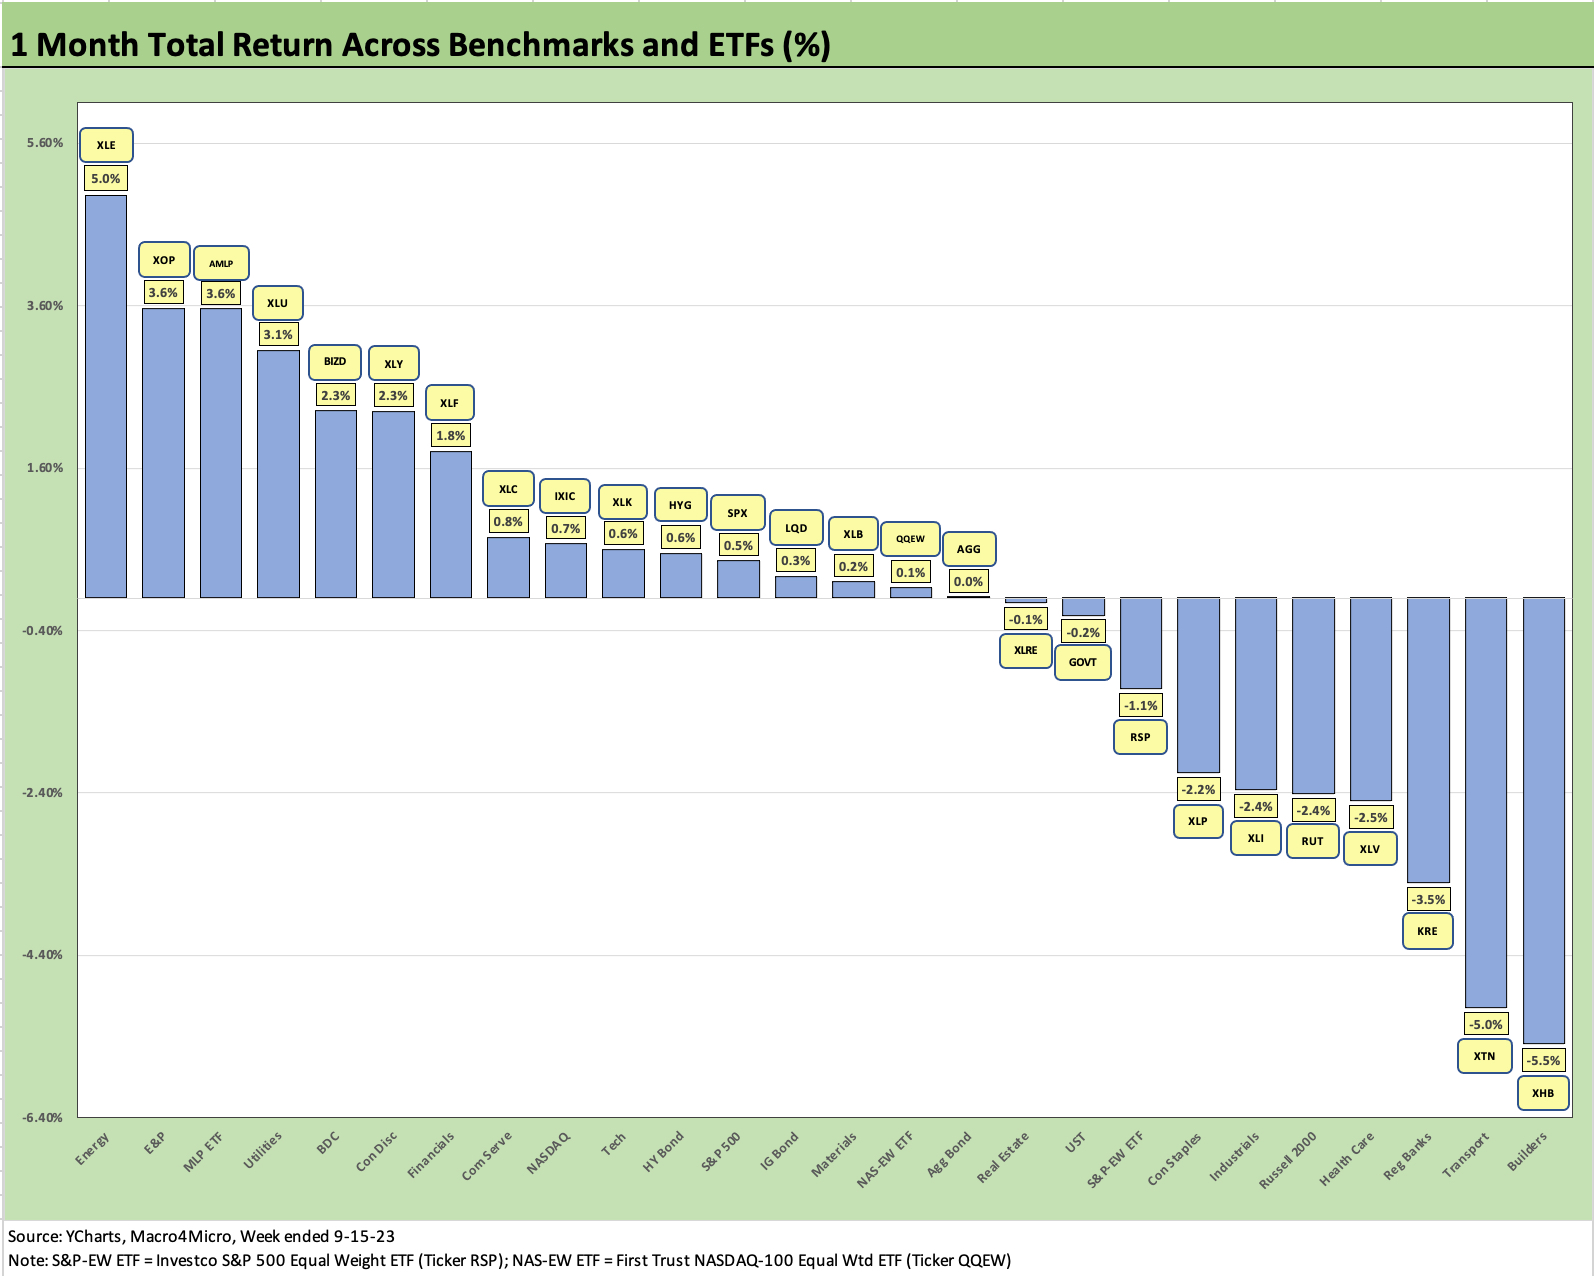
The above chart frames the trailing 1-month that shows 16-10 favoring positive. The positive score is tempered by the fact that you could make the Top 10 with less than a 1% return.
We see Energy ETFs in the Top 3 with E&P (XOP), Diversified (XLE), and Midstream (AMLP) and the more defensive utility sector (XLU) at #4. Consumer Discretionary (XLY) is the best performer of the Magnificent 7 heavy ETFs at #6 and Communications Services (XLC) at #8 and Tech (XLK) at #10. At least the diversity of the top performers have been more balanced in the late summer.
A notable member of the top 5 for the month is the BDC ETF (BIZD) after what was a decent set of numbers reported (earnings, asset quality, dividends) with some dividend hikes in the mix. The BDC universe is riding a floating rate credit asset base and winning converts despite the wide range of views on the sector as a cash flow yield vehicle.
In the interest of disclosure, I have been an active investor across a diversified range of BDC names. I started investing in BDCs against the backdrop of the ZIRP market, but this is one credit asset class in the debt market when rising rates can be a win if you select the right managers with the right portfolio risk policies. Disclosure is good, but there is no doubt you need to have faith in the brand name managers and their ability to underwrite, restructure, and administrate these portfolios.
The BDC sector takes talent, skill, resources, and a belief that these firms will make managing these portfolios a priority. That last part makes intuitive sense given the visibility of the BDC stocks as a bit of an “advertisement” for their separate private credit asset gathering activities from pensions, endowments, and family offices. Self-interest rules in private equity land, and it is nice to have these firms on your side.
3-Month ETF returns…
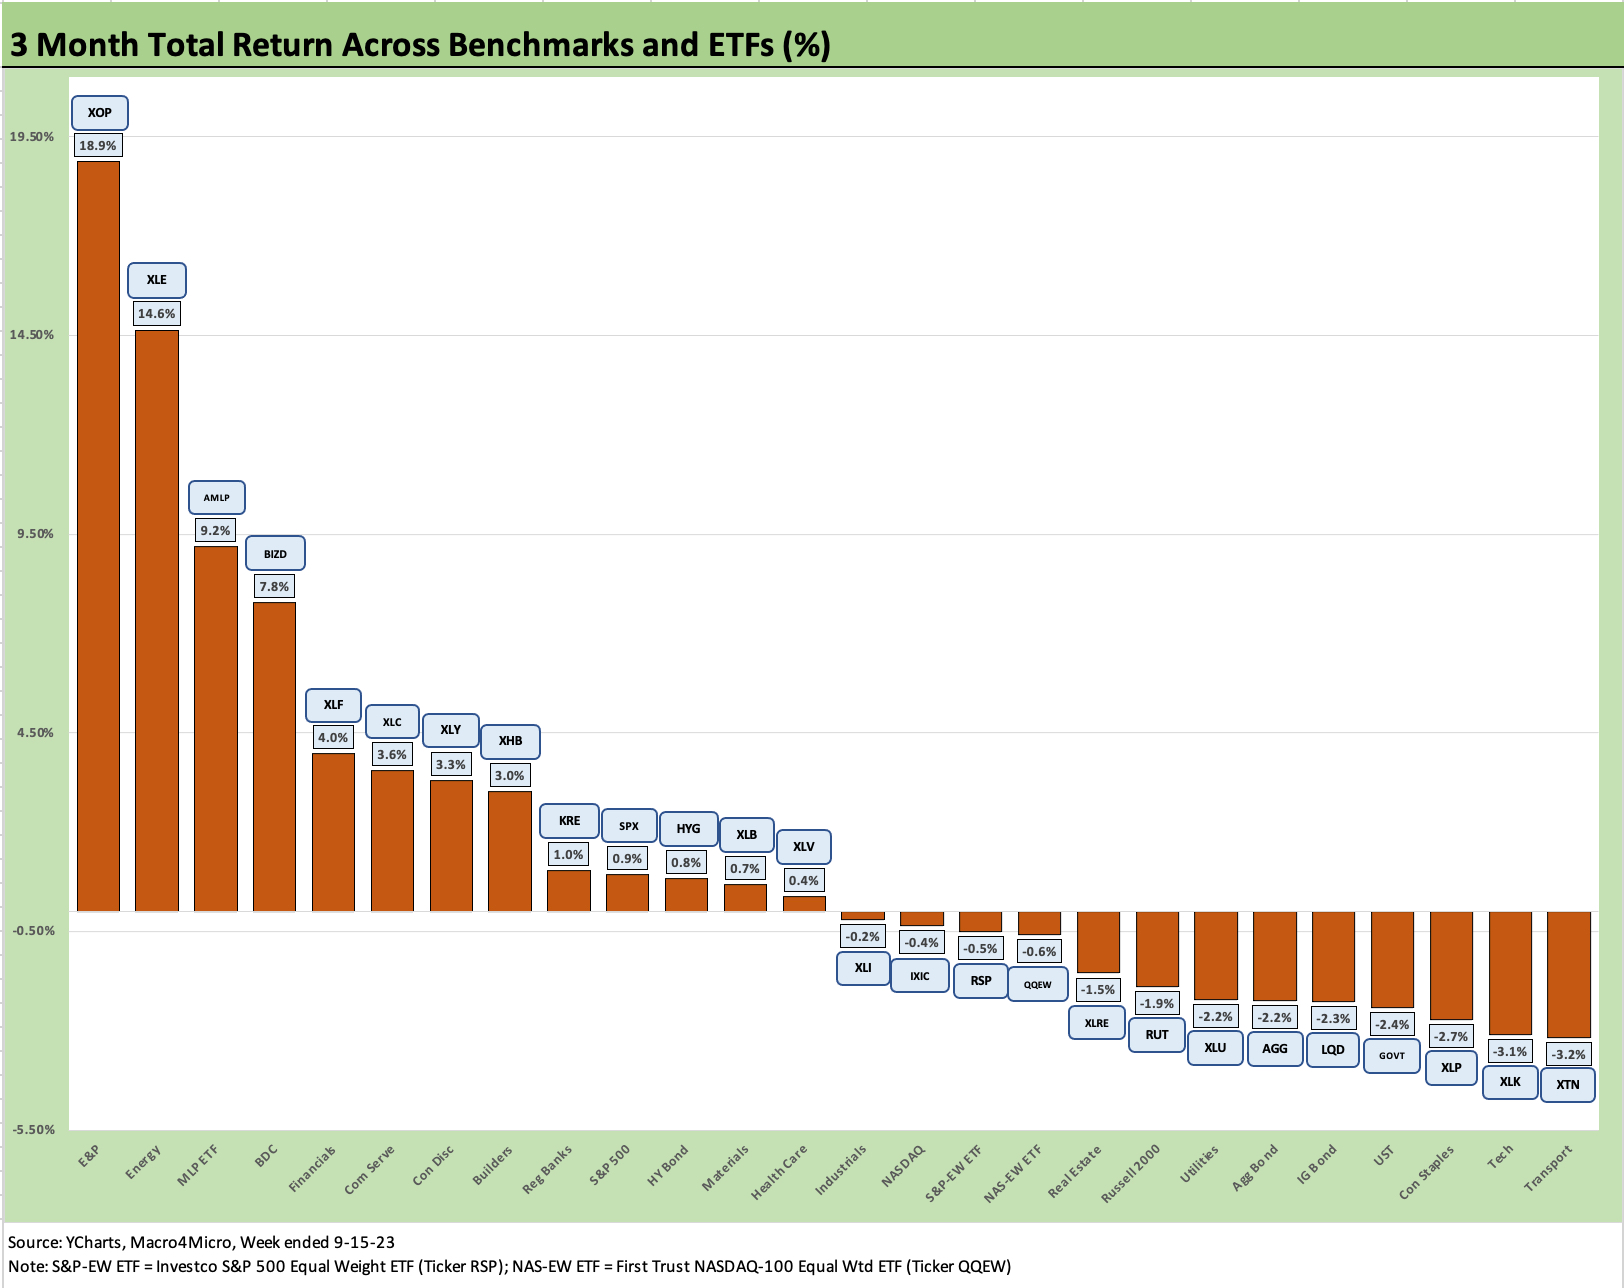
For 3 months, the positive and negative ETFs and benchmarks are tied at 13-13. In a sign of meager market performance over the summer, it only took +0.9% to make the Top 10 for the trailing 3 months. The Hi-Lo range was over 22 points framing the rebound in E&P (XOP) vs. Transportation (XTN). This would go under the definition of why active managers stay confident and day traders stay very well caffeinated.
If we throw out the Hi and Lo ETF, we still see a Hi-Lo range of almost 18 points with Diversified Energy (XLE) vs. Tech (XLK). There are a few ways to play Energy with XOP naturally living and dying by the price of oil and natural gas while XLE is much more diversified around the business range from upstream to downstream and across into oilfield services. Midstream (AMLP) runs the gamut from MLPs to C Corps and are heavily about dividends and qualifying as attractive income stocks.
Again in the interest of disclosure, I have been actively investing in Midstream since 2021 when I sold down my CreditSights stock in an acquisition and could think more about a retirement portfolio (tuition years behind me, etc.). AMLP was one of the names I had been in and out of over time, but I prefer specific midstream name picking. MLPs create some problems for investment in IRA funds and AMLP was one way to work around that.
Midstream equities have had very (!) differentiated performances in equities with some strong performers and some horrid stock performers as well (Oh Canada).
Analyzing the stocks can at times be more like a first cousin of bonds in that the credit profiles of these companies demonstrate very resilient cash flows and dividend safety given the cycle of their capex and expansion plans.
More M&A remains the main credit risk given all the obstructionism in project approvals leaving some in the position where they need to buy and not build to grow their cash flows and asset base rather than wait for more supportive policy actions for project approval. That is a topic for another day.
In the fixed income ETF mix, only HYG made the positive side of the ledger over 3 months at 0.8% as coupon income carries the day and shorter duration helped somewhat mitigate the curve damage. We see the other three fixed income ETFs (AGG, LQD, GOVT) in the negative zone and in the bottom quartile of the mix. The Transport ETF (XTN) sits on the bottom on the back of concerns around growth ahead and on some issuer-specific headaches.
The fall season is upon us…
As we roll into another FOMC meeting and Dot Plot this week and the final GDP stats and PCE inflation metrics the following week, the same cyclical handicapping challenge remains on the front burner. Toxic political tones and absurd commentaries from Washington will be like daily oxygen (or policy carbon monoxide with the engine running and the Capitol window sealed shut?) as the market awaits impeachment headlines, government shutdown risk, whose criminal cases get heard when, who can run for President (or not), among other signs of the times.
In the meantime, I am still searching my John Ford collection of movies for evidence of the “lying dog-faced pony soldiers” (none that I can find or remember, and I have seen them all) cited by Biden again in Hanoi. That was painful. My favorite quote from Fort Apache he should have used was “yellow-bellied polecat of dubious antecedents and conjectural progeny…” Maybe in the debates. Biden just can’t use that on RFK Jr.
As trade tension with China heats up, I am still waiting for Trump to admit that tariffs are paid by the buyer and not the exporting nation. In other words, Trump collected zero from China and not “billions and billions.” (US-based customers paid. Period.) It is a key and legitimate trade policy topic and fair question to see if any candidates (or Biden) knows the answer. Maybe they will ask that in the next GOP debate later this month. Don’t hold your breath.