
August CPI: Inflation Fears…They’re Back?!
We look at the updated CPI numbers with a mixed picture across key line items.


The headline YoY CPI uptick shifted back to the high 3-handle at 3.7% from July’s 3.2% with the MoM change in line with forecasts but still unnerving at 0.6% as Services stay sticky in the 5% handle range and base year effects weighs on the math.
The All Items ex-Shelter number keep spirits aloft for some at 1.9% YoY (0.0% in July to 0.8% in Aug MoM), and All Items less Food and Shelter at 1.3% YoY (0.0% in July to +1.0% in Aug MoM), so the sequential moves undermine complacency on that front.
The asterisk attached to shelter inflation is still more like striking a line through it with Owner Equivalent Rent metrics (25.6% weight of the CPI index at 7.3% CPI) more a theory than a consumer cash experience.
The 7.3% CPI on total Shelter comprises almost 35% of the CPI index, including a +7.8% for Rent of Primary Residence, a metric totally out of line with more timely national scale sources showing that CPI line more than double (at least) market observed trends on a national scale (some data services show negligible rent growth).
August CPI was in line with consensus forecasts on a YoY and MoM basis, so the markets were not overly rattled. The reality still is a reminder that we were in for a protracted period of elevated fed funds unless something starts to crack on the consumer front. As we go to print, longer rates are only slightly higher with 3M UST essentially flat. The stock market was not shocked by the rise of the CPI numbers, but the bear noise will get louder.
As we covered last month, the comps have become more of a challenge in light of the base period effect (see July CPI: All About the Bass). The ability to move the needle on the last stretch might get tricky with oil climbing on OPEC+ supply action and the timeline to peak heating season narrowing in the fall and what that might mean for natural gas uncertainty. Total Energy was still deflating YoY at -3.6%, but the sequential MoM pickup in August was +5.6%. The Energy swings are always tricky to say the least.
Services remains the omnipresent struggle for those hoping for hints of easing or lack of hiking through year end with “Services ex-Energy Services” at +5.9% and Total Services at 5.4%. Services ex-Rent of Shelter weighed in at only 3.1%, so there is still a good point-counterpoint debate to have on where inflation theories end and reality begins given the very dubious nature of the Shelter lines.
The Big 5 CPI buckets…
Below we update our Big 5 buckets that comprise almost 75% (74.9%) of the CPI index, and then we follow that with an additional chart that captures some important consumer line items for many households. Those lines add another 10.8% of the CPI index weighting for a total of just under 86% of the index.
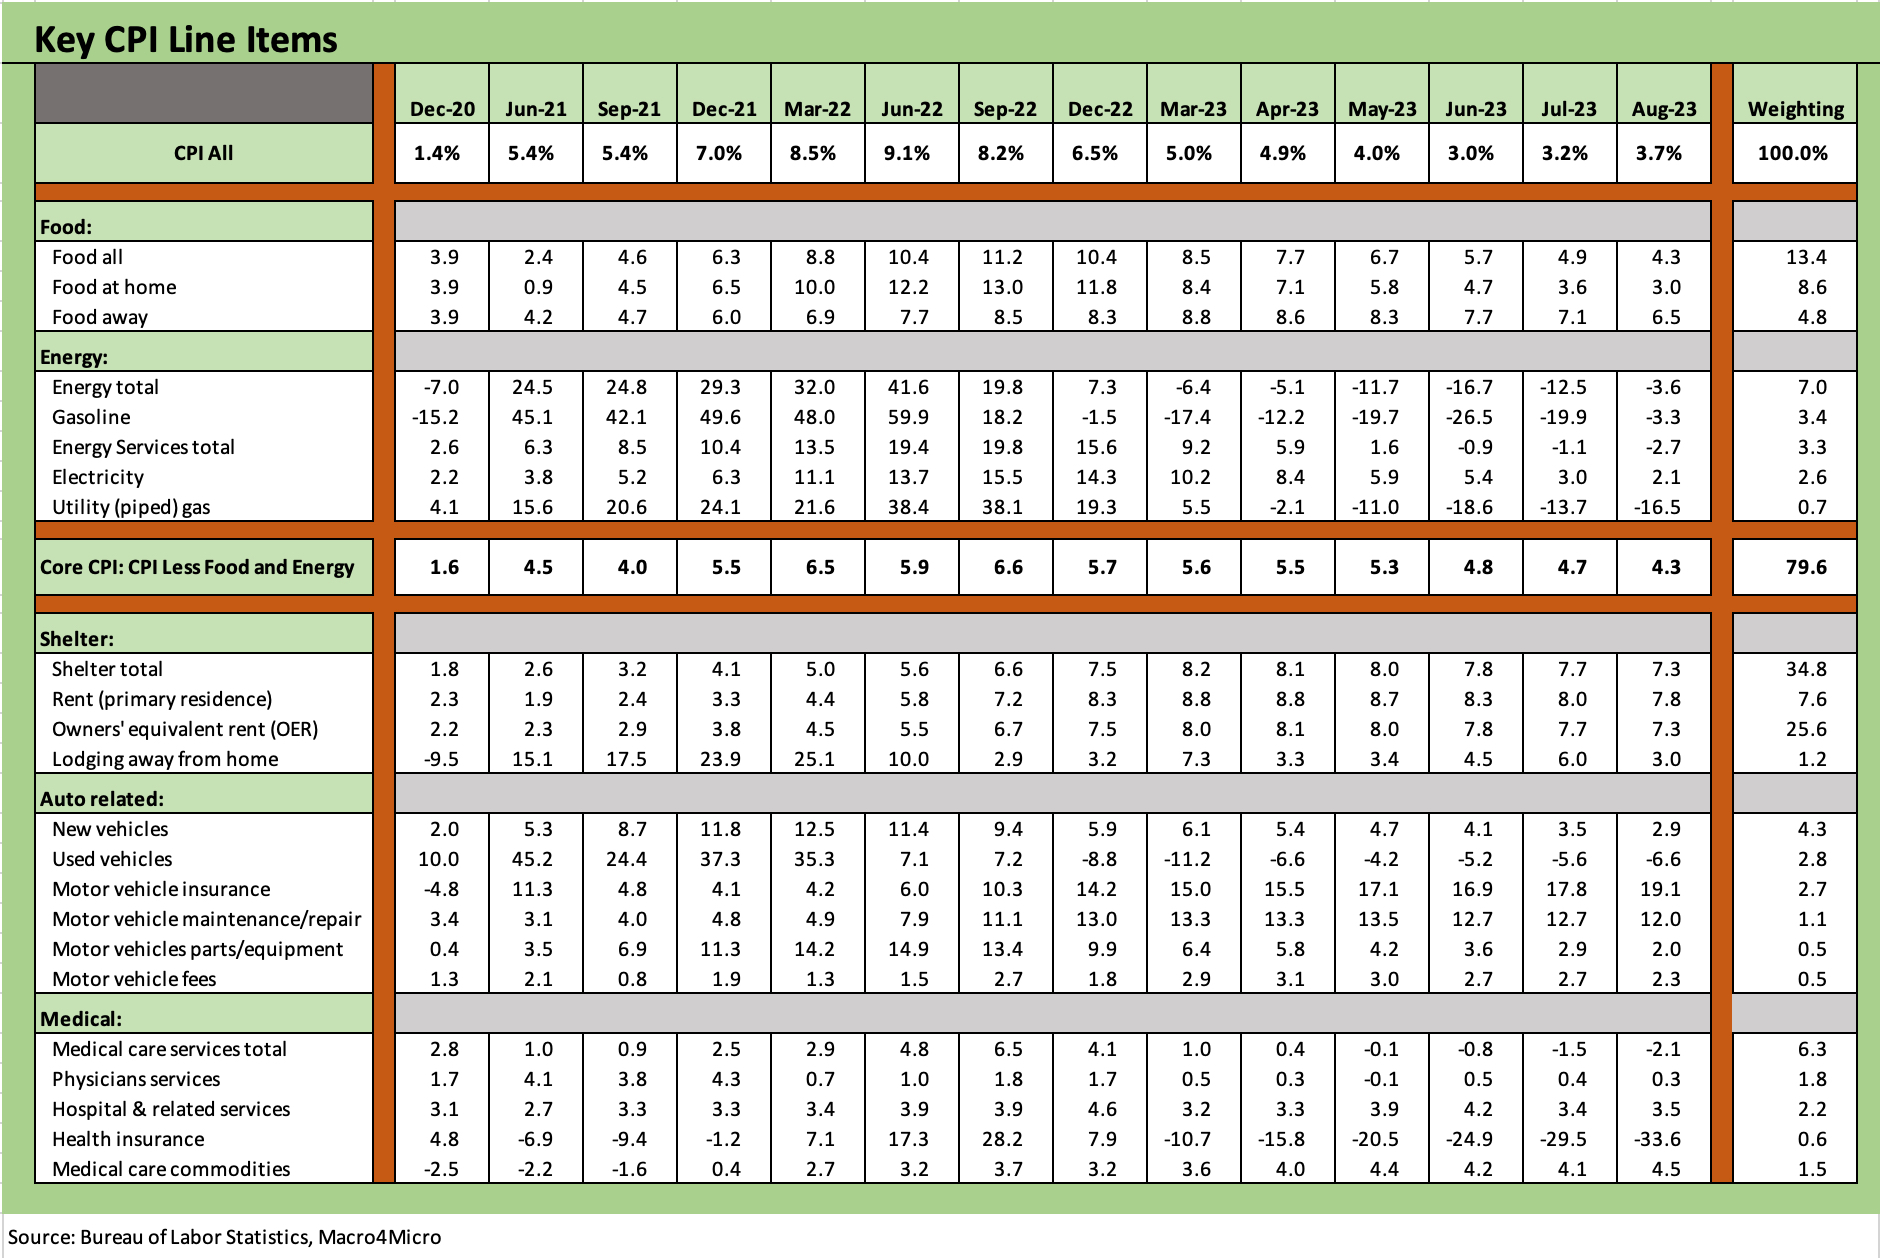
The Big 5 shows a wide range of inflation metrics from very high to negative and deflationary. As covered in past commentaries, we fashioned our own “Automotive” sector that too often gets narrowed to just New and Used Vehicles (see Automotive Inflation: More than Meets the Eye 10-17-22). We offer a quick summary below:
Food: The trends are better in CPI, but the price bar has been set materially higher on a cumulative basis for life in the store aisles. That will be a political issue to exploit. Easing fuel cost trends helps in the area of prices for delivery costs and how that flows through to the consumer, but that is staring at some possible setbacks ahead with oil climbing and operating costs thus rising in freight and logistics (fuel surcharges, etc.).
Energy: The deflation period looks to be coming to an end on the base year effects and rising oil prices. The reality of higher oil prices will roll into downstream effects across refined products and petrochemicals. That cost will need to be recovered or “eaten” by someone along the chain.
Shelter: We have covered our view on this topic at length in past commentaries. The main point is that the rent of primary residence is overstated vs. current market rates and the Owners’ Equivalent Rent line item is disconnected conceptually and in practical cash flow reality from what a homeowner with a 3% handle mortgage and a high base of home equity is feeling. OER is the pedigreed professors taking over the asylum.
Automotive: In the case of Autos, most any car owner feels the effects of spiraling insurance costs and the high cost of auto maintenance in a world where diagnostic and tech skills are driving up the cost of labor at dealers and independent garage operations.
Medical: Services dominate this bucket, and the numbers are very consumer friendly. The low numbers speak for themselves. There are some victory laps on policy and legislation to run here for some, but they never seem to be able to find their track shoes on this one.
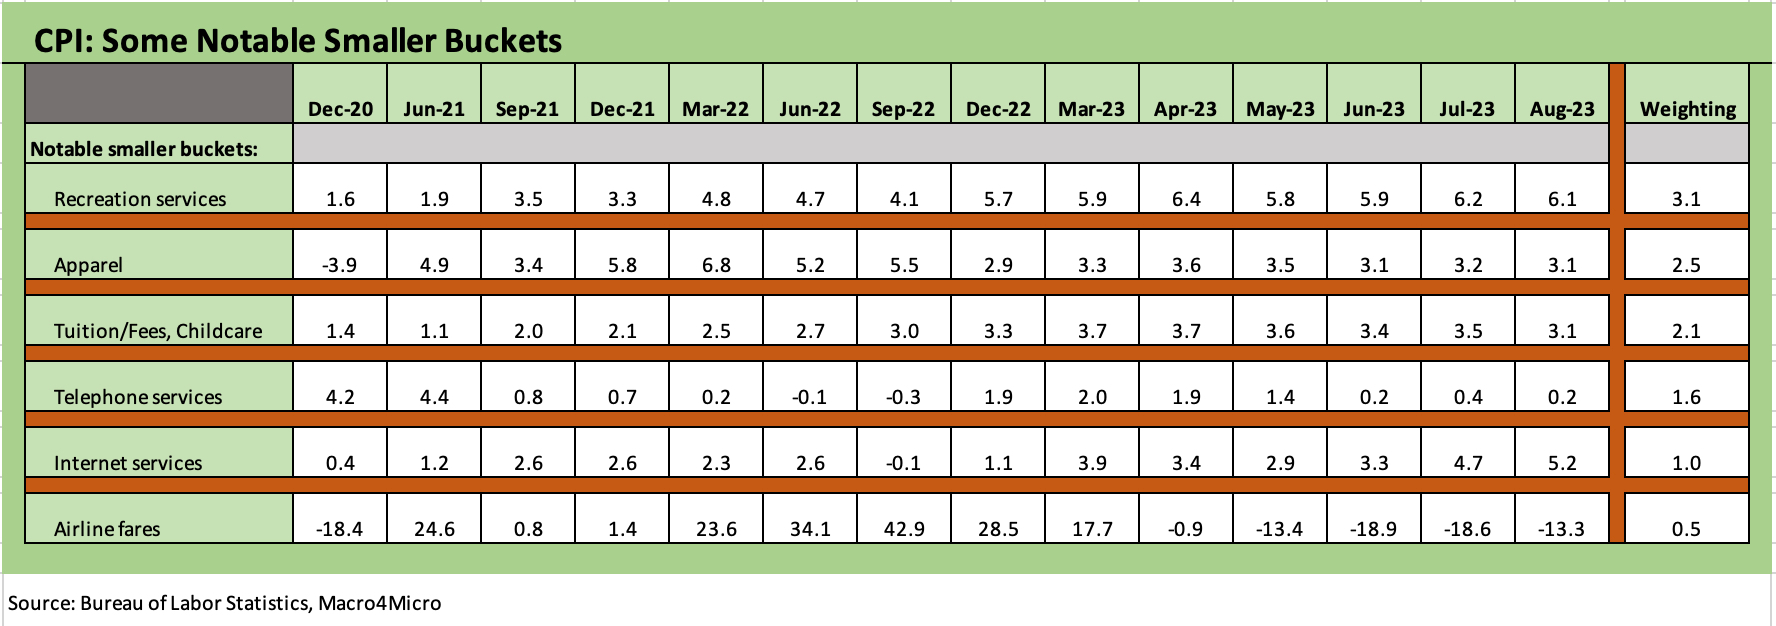
The above chart updates a cross-section of important household line items near and dear to many a consumer’s heart. We include the YoY line for each with the respective details on the CPI index weighting in the index. The YoY moves were mixed. Recreational Services remain high YoY while Apparel remains flattish.
One outlier on a sequential basis was airline fares, which ticked up sequentially to +4.9% MoM after seeing fares easing in recent months on lower aviation fuel expenses and some heightened domestic route competition.