
JOLTS Nov 2023: Let the Games Begin
We update the JOLTS data ahead of the Friday payroll release as Goldilocks stays calm.


The focus on jobs will be picking up again in a hurry as the second-guessing on UST shapeshifting, Fed timing, and implied views of employer expectations get analyzed.
JOLTS saw an 8.79 million headline number with an upward revision for Oct (8.73 to 8.85 million) with a decrease in hires of -363K and a decrease in separations by -292K that included quits down by -157K and layoffs down by -116K.
The 1-month lag on JOLTS still leaves more focus on Friday’s payroll numbers for more signals on the bullish fed funds view in the market calling for March action.
The overall flavor in employment will be a matter of personal taste, but the reality of record payroll counts to start December still makes it tough to bet against the consumer and see the jobs side of the dual mandate being a key factor in Fed thinking relative to making sure the inflation beast is dead.
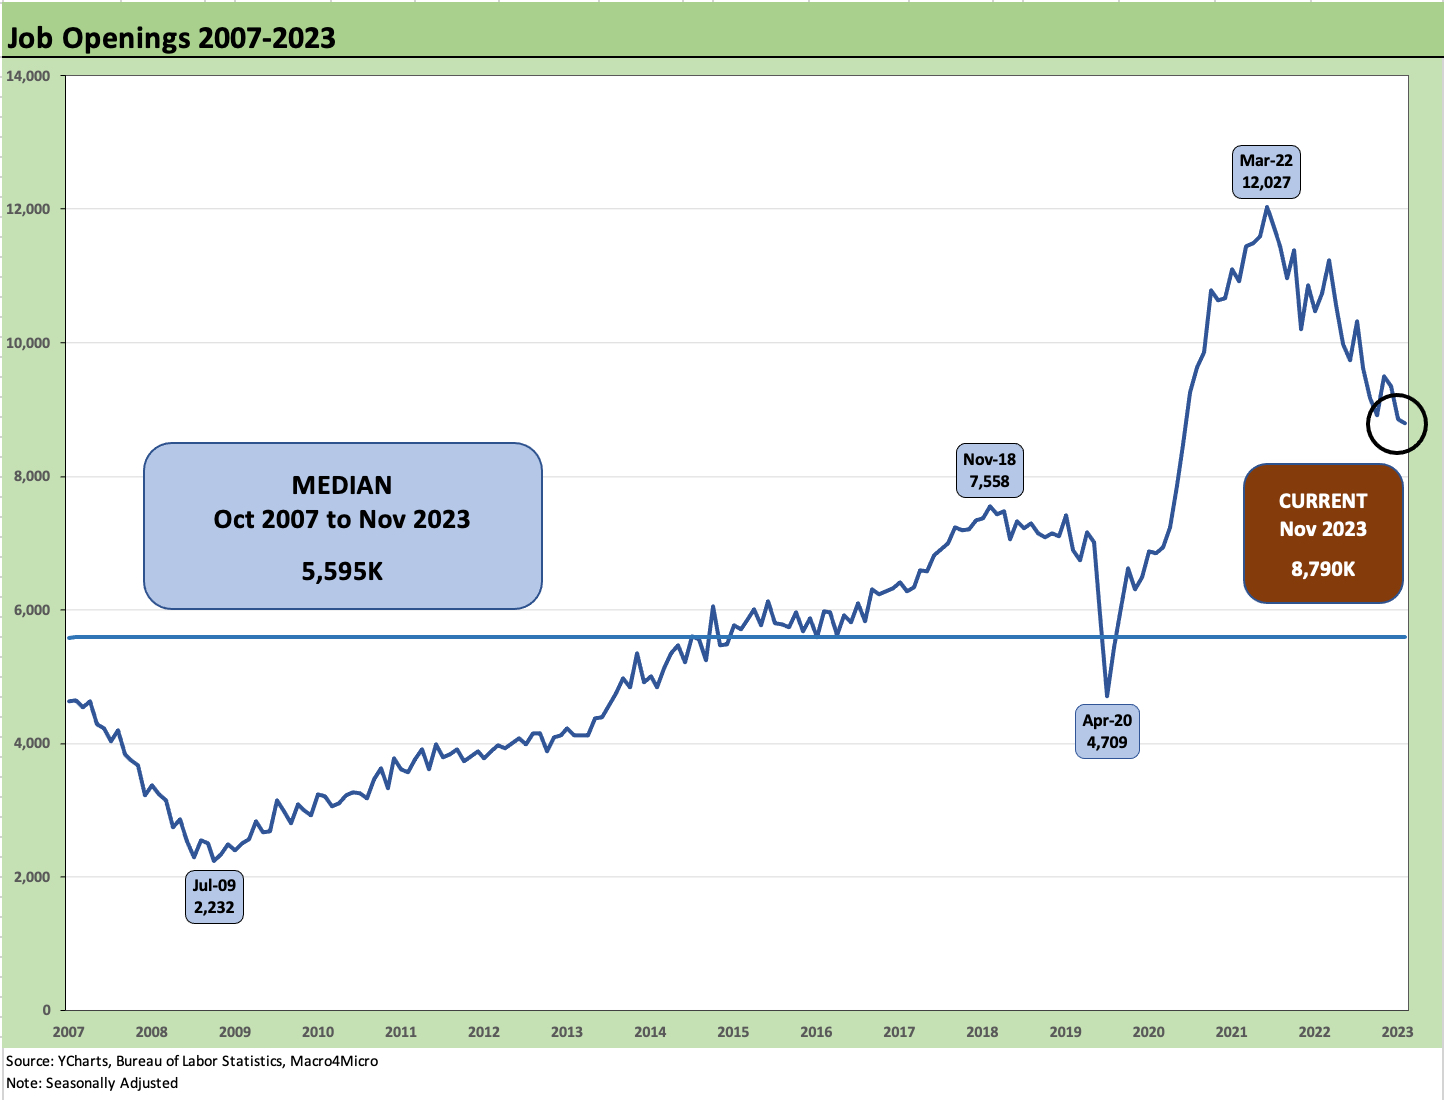
The above chart updates the running job opening numbers including an upward revision for Oct 2023. The job openings count remains well above the median of 5.59 million seen since Oct 2007 (just before the onset of the official recession date and cyclical peak of Dec 2007 per NBER) through Nov 2023. That makes for a downward trend from the 12.0 million peak of March 2022, which was the month ZIRP ended and the tightening cycle and inflation fighting escalated.
With a record payroll count at the end of November (see Nov 2023 Jobs: A Sad Story of More People Working 12-8-23), job openings tailing off makes complete sense. The hires and separations data did not raise flags as we cover below. A material uptick would have rattled the UST market that is already showing a bit of rally remorse to start the new year after the monster rebound of Nov-Dec (see Footnotes & Flashbacks: State of Yields 1-1-24).
The more important set of current data points will come on Friday without the lag effects of JOLTS. The level of debate on the “perfect world” that drove simultaneous UST rallies with booming stocks is tied to a belief in steadily declining inflation trends, no contraction, low relative job loss, and steady earnings growth. The employment piece of the puzzle should play a big role in the consensus on rates.
That perfect world scenario includes some event risk being part of a “cross that tar pit when it happens” mindset that seems to prevail in the market. Geopolitics is way outside the control of the employers and the Fed, but that is another story.
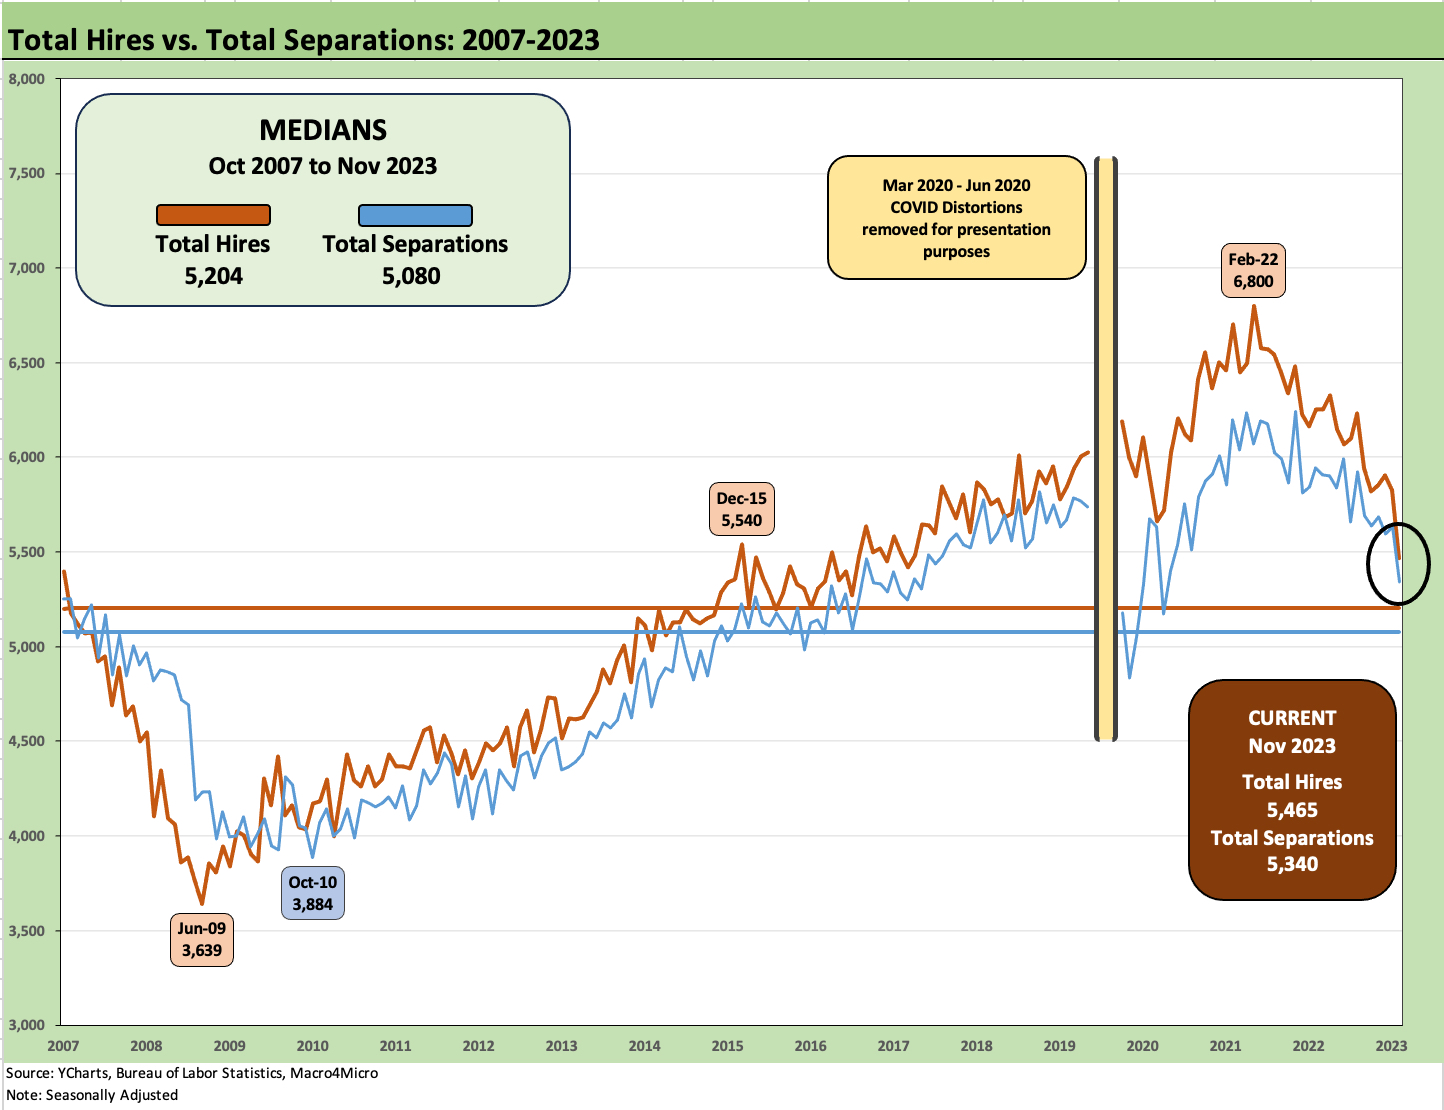
The above chart updates the time series for total hires vs. total separations. Hires ticked lower by -363K to 5.46 million in Nov from 5.83 million in Oct. Hires are still running above median as noted in the chart. Separations also declined along with hires. We see separations down by -292K to 5.34 million. Separations at 5.34 is running above the timeline median of 5.08 million. There is still a lot of two way traffic.
We highlight that the COVID period section of the timeline was removed from the above chart for better granular visuals on the moves in other periods. The COVID swings were “other worldly,” and we break those out below in a text section we put together as a memory jogger in framing the outsized job losses and rehiring process in early to mid 2020.
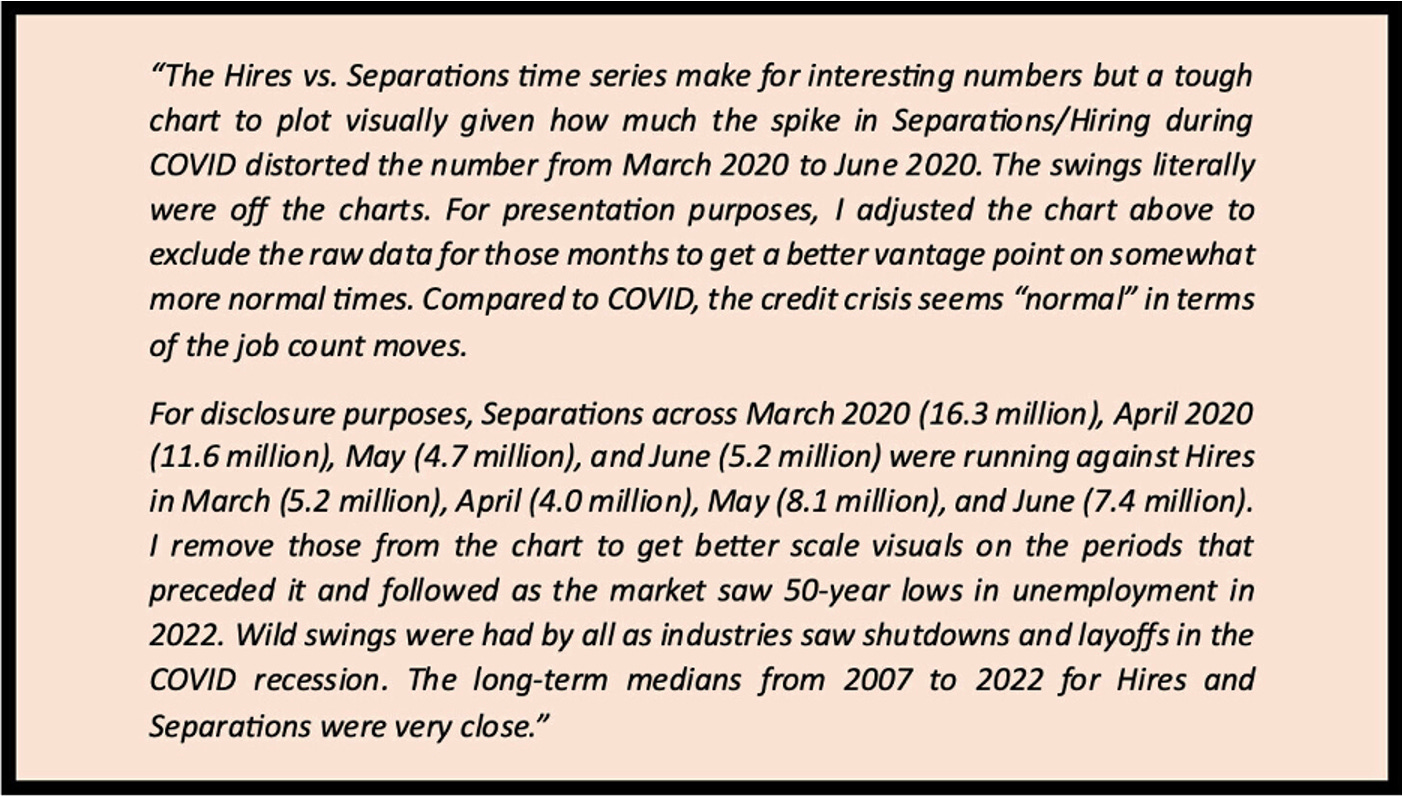
The above chart offers a flashback to the insanity of March and April 2020 as bodies were literally stacking up and getting stored – and in some cases storage was capped off and things got downright medieval. Economic activity was temporarily paralyzed, but the reaction time was quick by the Fed in tandem with the US Treasury. Congress caught up eventually also. The Powell-Mnuchin tag team do not get enough credit for the masterful execution in restoring confidence in credit markets.
The Democrats would not give Mnuchin the credit he deserved on this one nor does the GOP give Powell the credit. Imagine the outcome if mortgage credit dried up (instead of a record low mortgage rate backdrop that Freddie Mac estimated at $800 bn of value to households) or all bank lines were drawn down (or attempted to get drawn down). Imagine what the jobs pain would have been then. Imagine if credit card lines started getting cancelled on a massive scale. The scenario is an easy one to war game out if the inmates took over the Washington nuthouse even more than they already have across the last few years.
After the credit crisis in 2008 after Lehman, when the causes and counterfactual scenarios spun around by the left and right in later years ran the gamut, the pandemic was one of those on-the-precipice economic moments.
Those fat tail events often get recreated in partisan politics for power seeking, and the result is often to ignore the multiplier effects that could have been played out in a highly destructive way. The bank systemic crisis and COVID nightmare are two areas where the more extreme, self-righteous left and maniacal, burn-it-down right had themselves quite a time.
As we start a new year with record deficits and record borrowing needs in an increasingly risky world, the irrational response to COVID in lookbacks offers a tasting menu for what could come later under various scenarios. Politics always interferes with sound “morning after” (and years after) reassessments. Some of the noise is worth ignoring if it did not interfere with preparedness for the “next time.”
In the case of COVID and all the jobs pain, the whole Fauci vilification thing running alongside the deification of some other dubious characters is now the norm. In the end, there are a lot of angry, frustrated, dishonest, willfully ignorant, and often violent morons in the world who want to blame anyone but themselves for their lot. The US has the third largest population in the world. Do the math.
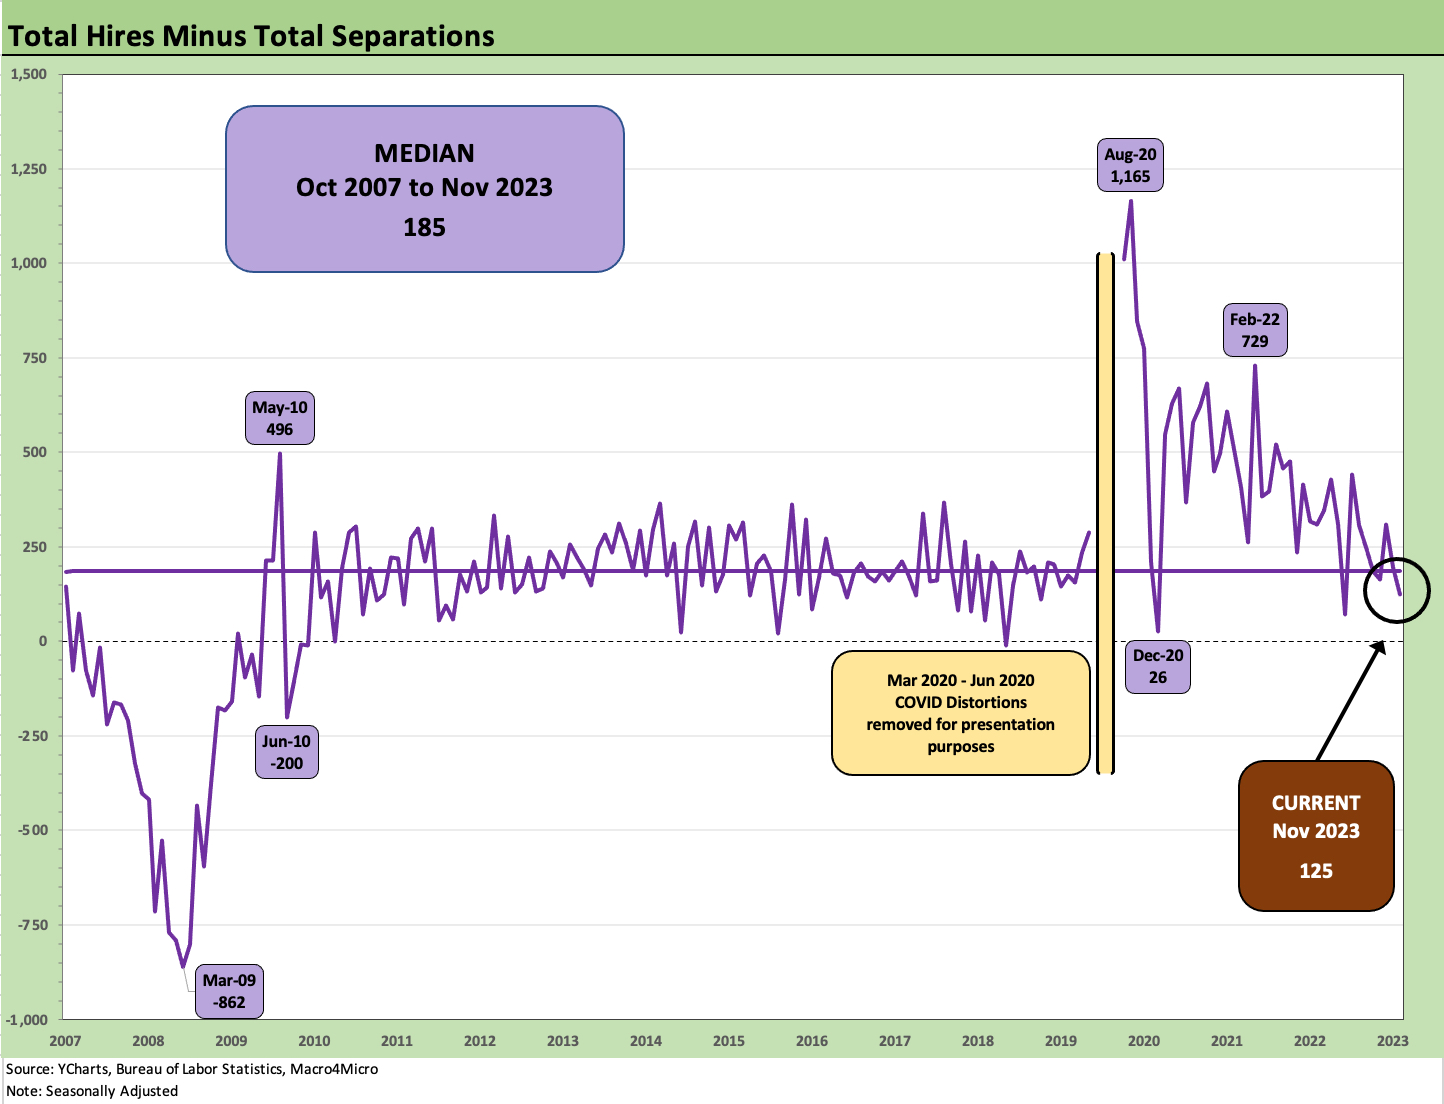
The above chart shows the running differentials of hires minus separations. The number is now below the median and compressing quickly. Within separations, layoffs were down by -116K to 1.52 million. Quits were down by -157K.
There have been a lot of theories on how to view the labor shortages from “hoarding” by employers to a shortage of skills to meet demands in many subsectors. The reshoring themes overlap with immigration reform in a debate that is likely to have no resolution in easing manpower needs, but supply-demand tends to still work in Newtonian fashion. The pricing power of labor clearly has been enhanced in 2022-2023 despite all the bouts of downturn discussions that seem to ebb and flow.
Today saw the latest ISM number releases for manufacturing with the 14th consecutive month below 50 on the side of contraction. The 47.4 headline number was up sequentially from 46.7 in Nov. The ISM is not the topic here, but the breakdowns across New Orders, Production, Prices, Backlogs, and Employment offer good sea level color. That said, the recurring contraction numbers in a very solid 2023 for jobs and economic growth has clipped the value of the metric for many. On the narrow topic of Employment, it rose sequentially by 2.3 points to 48.1. Production rose to just over 50.
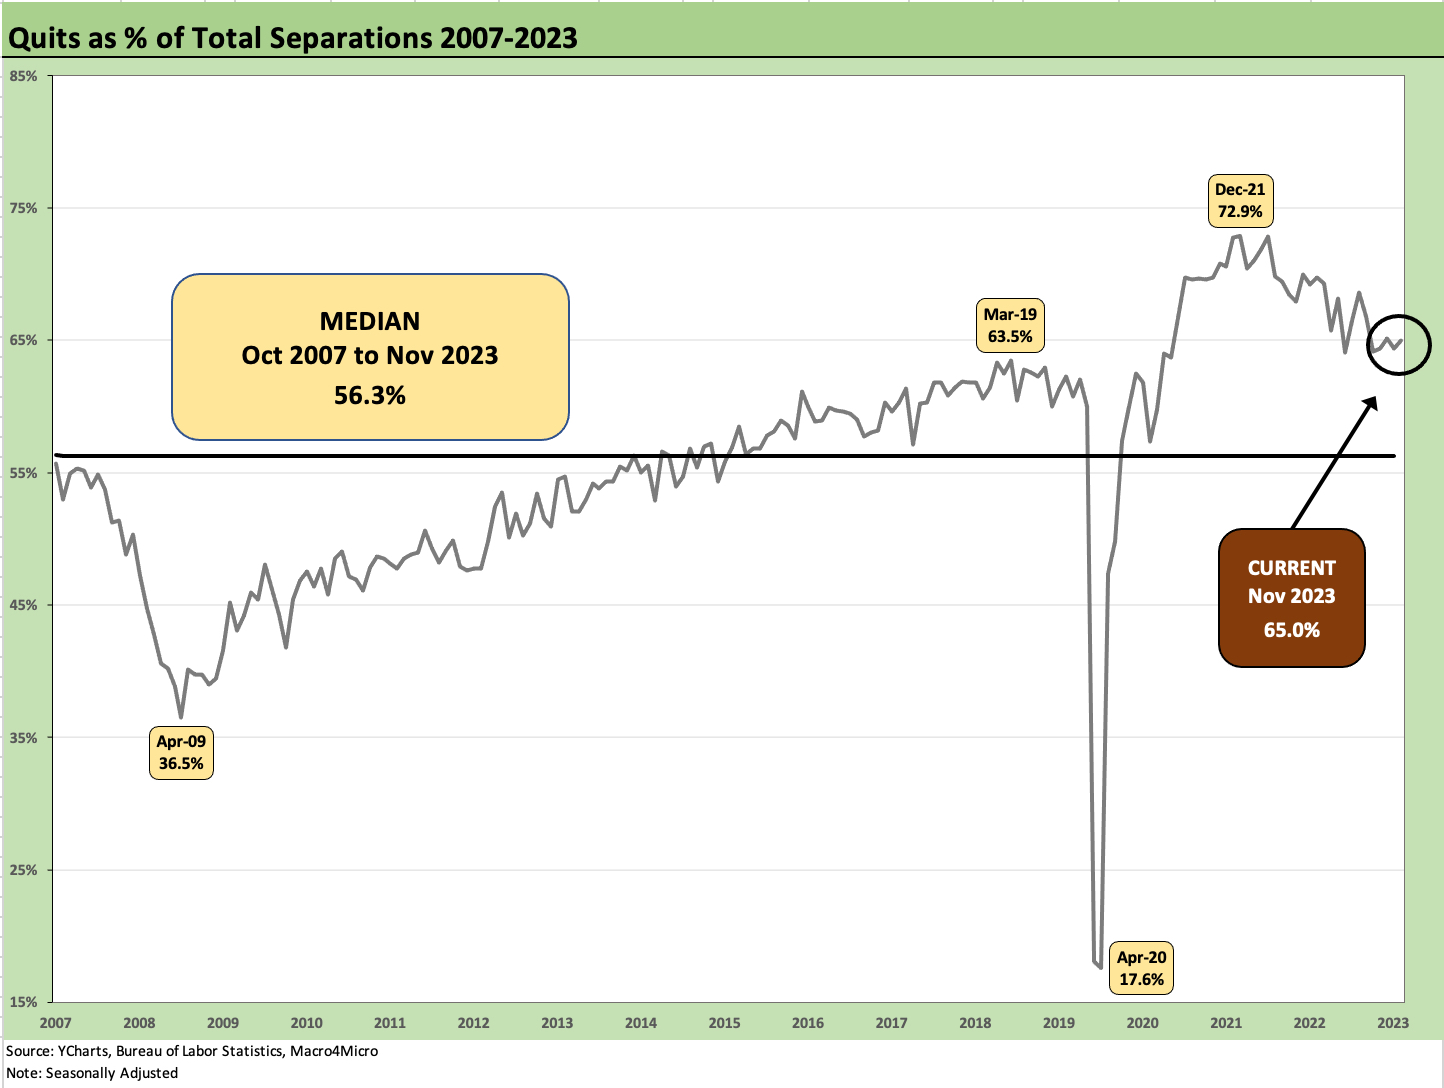
The above chart flags the mix of quits within separations. At 65%, the number remains well above the median of 56.3%. Quits declined by -157K during Nov to 3.47 million with -167K in the private sector. The “Quits Rate” (Quits % Employment) was 2.2% or down sequentially from 2.3% in Oct 2023 and 2.7% in Nov 2022. The theory is that implies lower confidence in quickly finding a job.
Overall, the JOLTS data can still be worked into the Goldilocks theme, but the JOLTS release is not carrying as much weight as it did in the summer and early fall. The payroll release on Friday should be more interesting at the headline level and in digging into the occupation mix.
See also:
Nov 2023 Jobs: A Sad Story of More People Working 12-8-23
JOLTS Oct 2023: Lights Blinking? Dimmer or On-Off Switch? 12-5-23