AutoNation 1Q23: Company Comment
AutoNation weighs in with seasonally slow earnings as four more of the Big 6 are set to report this coming week.
“Used car retail continues to evolve.”
AutoNation posted underwhelming 1Q23 results, but all eyes are looking ahead to the spring and summer selling seasons and where the consumer sector and affordability factors might head.
AN’s product and service mix and trend line offer a reminder of the importance of business opportunities such as Parts and Service and Finance and Insurance in supporting the very strong free cash flows of the franchise dealers.
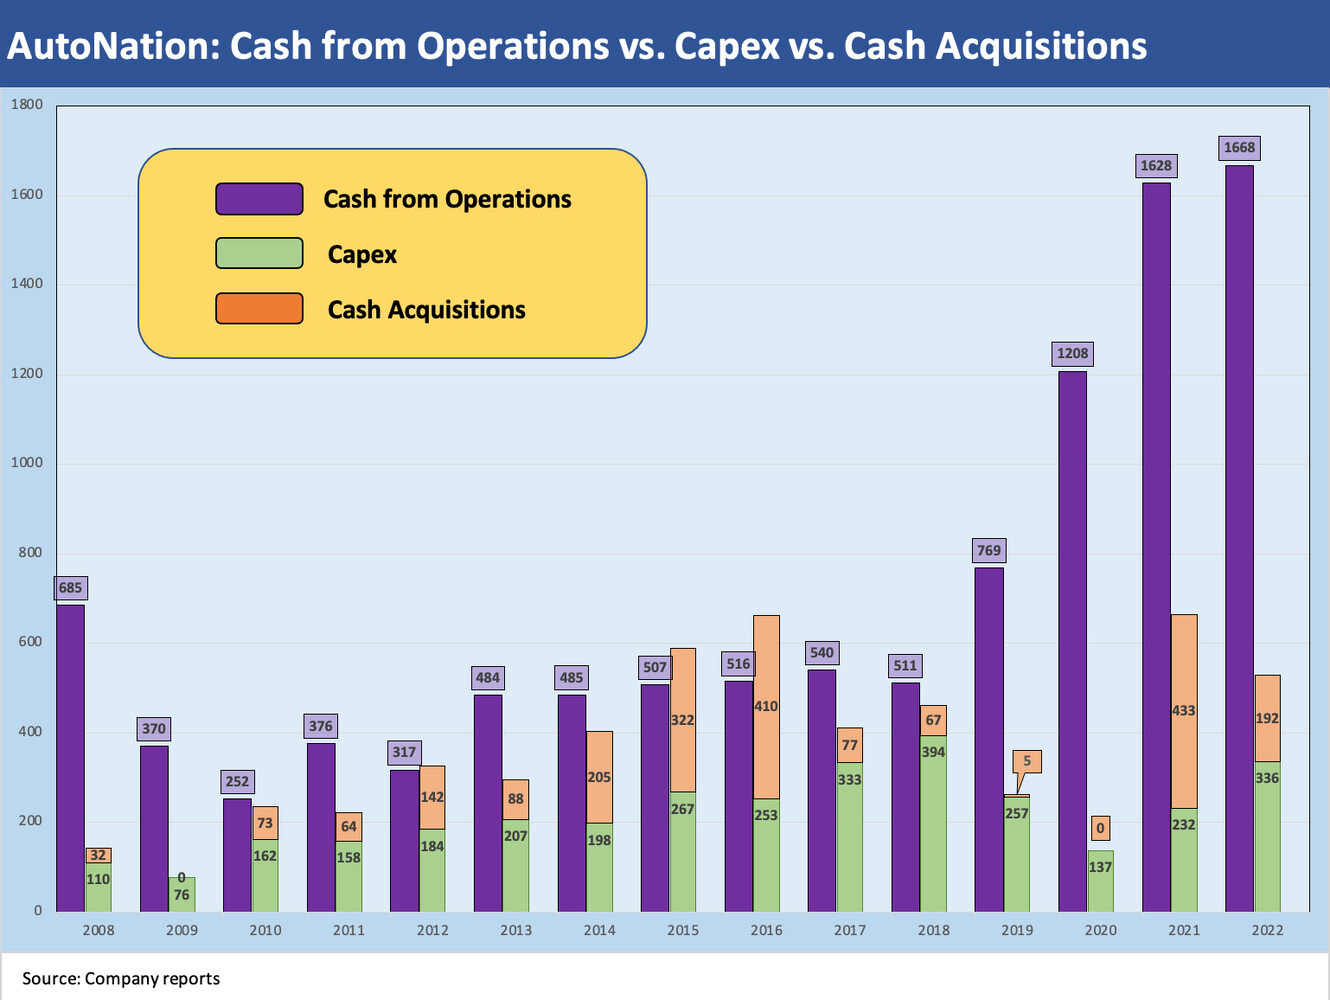
We frame historical cash from operations vs. the history of capex and M&A activity, and the numbers drive home the impressive free cash flow, ability to fund sustained accretive expansion programs, and AN’s ability to ride along with dealer roll-ups into the bigger public entities.
With the franchise auto dealers wading into the spring selling season, the question marks around the durability and resilience of a healthy consumer sector keeps the market looking for useful proxies for household health and spending appetites. The auto retail sector is one of them. We saw some leading dealers weigh in with 1Q23 results the past week as Lithia and AutoNation reported. That leaves the remaining four of the franchise dealers Big 6 to report this week with Penske, Group 1, Sonic, and Asbury teed up.
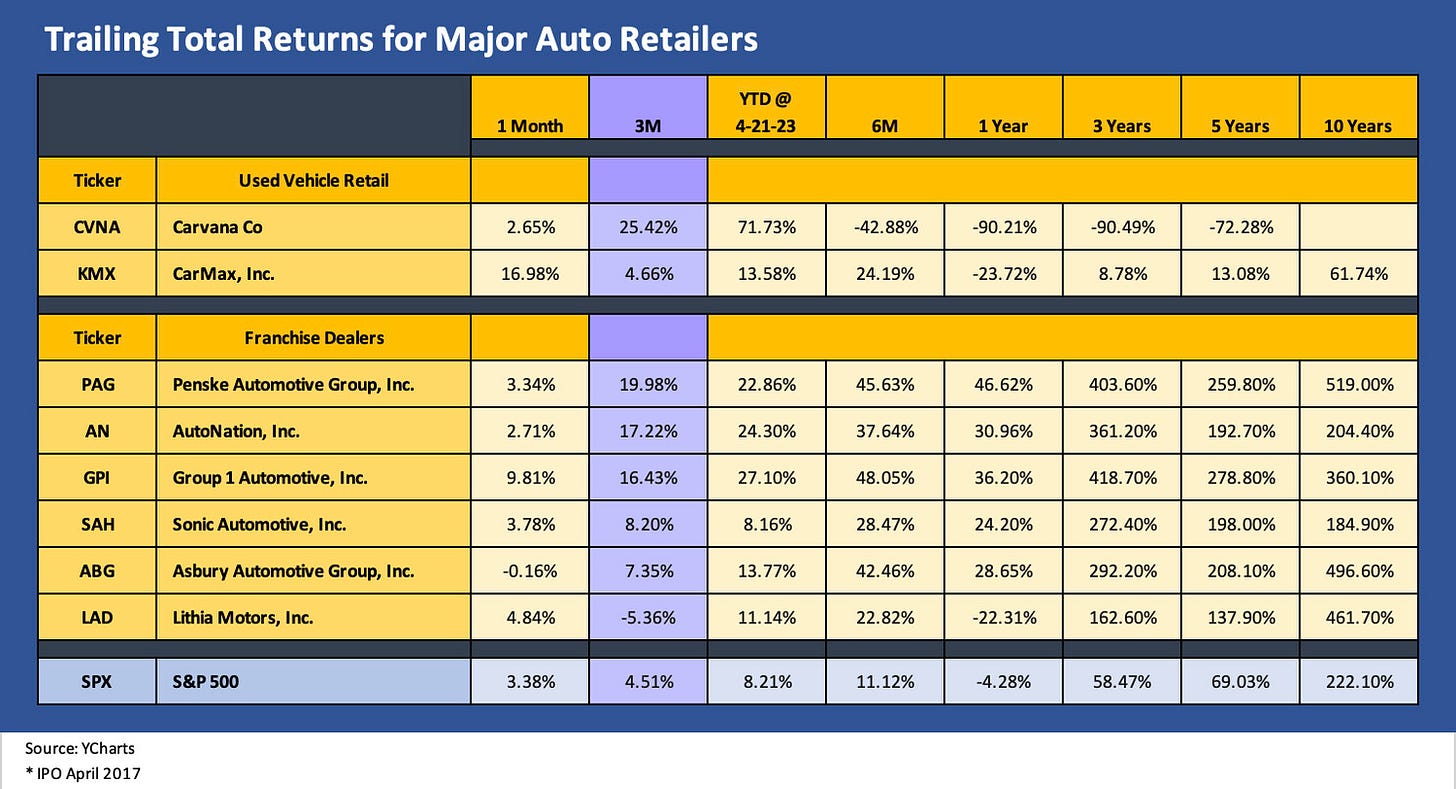
In this update, we look at AutoNation 1Q23 numbers for some signals on the state of the auto retail market. With occasional exceptions over the past year, the rolling returns on Auto Retail stocks have been outperformers (see below). Auto retailers sold off during the depositor panic but most then rallied back. With a distressed Carvana on the ropes and some pure ecommerce names dead in the water, we expect this sector will keep getting a fair amount of attention. CVNA reports after the close on May 4.
Auto retail generally faces the same overall mix of variables…
The same key drivers around used car price volatility, supply demand imbalances in vehicles (notably new vs. used), supplier chain stress, price dislocations, and rising financing costs (i.e., monthly payments) have been overriding risk variables that all dealers share. There are some nuances across geographic exposure for smaller names and the relative brand mix (e.g., premium luxury, imports, domestics), but in the end this is about consumer spending, replacement cycles and auto finance.
The easing of supplier chain stress should help the flow of vehicles into the dealer retail networks and a more normalized relationship between new and used vehicles should at the very least reduce volatility in used vehicle inventory valuations. That could potentially stabilize the trend of used vehicle credit contraction where developments generally have been negative. Affordability pressures remain a headwind in new and used alike.
Below we look at some stock market visuals that shed some light on relative risk perception and expected performance. Then we look at some of the key operating lines for AutoNation.
The above chart flags the performance of the three biggest names of the auto retail pack with Penske Automotive Group (PAG), Lithia (LAD), and AutoNation (AN). PAG boasts the highest market cap as it closes in on $10 bn ($9.7 bn recent close). We also post the timeline for returns for LAD and AN, who are neck and neck for #2 at market caps over $6.2 bn. On the basis of revenue, LAD has pulled ahead of AN with 1Q23 LAD revenues at $6.97 bn vs. $6.4 bn for AN.
The timeline above starts at the beginning of 2019 and then cuts across the madness of the COVID period and the structural imbalances and supplier chain stress that dislocated new and used car prices. All the while, digital strategies were being planned and executed in various stages on the fly even as the franchise dealers were debating the best approach to expand in used cars (see Market Menagerie: The Used Car Microcosm 11-29-22). Over that 4+ year period, AN beat PAG with both materially beating the overall market.
As shown in the stock time series above for the Big 3, the big expansion plans by Lithia and notably in digital retailing and used cars flowed into a lot of excitement around the stock during the used car boom that also set Carvana’s stock on fire. The excitement around some of those expansion initiatives faded as shown in the LAD price action which saw the company reeled back in with the group.
The major public dealers present diverse game plans on their used car strategies and relative stages of their digital retailing buildout in new and used vehicles. Some of the retailers changed branding strategies around stand-alone used cars as well. Branding game plans is a topic for separate commentaries and more in-depth profiles.
Strategies around M&A aggression have also been in a wide range. In LAD’s case, the company made cash acquisitions of around $5.4 bn in total from 2020 to 2022 and issued common equity for just under $2 bn. LAD has been the most aggressive in the pack while AN was much more measured in its growth plan.
Below we present a broader view of the updated Auto Retail peer group equity performance. We also include the two major used car names with CarMax as the traditional incumbent with the more traditional business model and the high-flying (and then crashing) Carvana as the bellwether e-commerce story of this past auto retail cycle.
We looked briefly at auto retail dynamics in one of our weeklies (see Footnotes and Flashbacks: Week Ending April 2, 2023) and an earlier commentary (see Market Menagerie: The Used Car Microcosm 11-29-22). The used car industry has never posted so many headlines as it did during the pandemic given the outsized impact supplier chain problems had on the inflation story in 2021 and into 2022 (see Automotive Inflation: More than Meets the Eye 10-17-22).
The trailing returns above tell a clear story that auto retail has been a good place to be over the last 5 years and especially for the past year and across COVID. Credit quality has been stable across the periods also with the overall peer group posting a BB tier average. AN is the highest rated of the group as a low BBB composite. The rest are BB tier composites.
Mobility was important during COVID and then inventory was short in 2021. That means pricing and margins were strong, but volume was artificially constrained. Low new car availability due to supplier chain breakdowns (chips or otherwise) meant low trade-ins. The 2020 collapse in air travel meant lower used vehicle supply for some time in the seasonal remarketing cycles of the daily rental operators. Rates were low, demand was high, and prices were racing ahead for used cars to be the point of being wholly irrational in historical context. Inventory was marked up and some traded above new car comps. That was nuts.
AN revenue growth on multiple fronts…
The steady growth of the revenue lines for the major public dealers is tied to steady capex and expansion plans in accretive business lines such as Finance and Insurance (F&I), Parts and Service (P&S) and new dealership openings. We also see diverse strategies in the industry around used car expansion whether new branding (stand-alone, branded used vehicle retail locations) or at existing dealerships. The lumpier increase in revenue from M&A presents a recurring theme in the industry as well.
Below we plot the deployment of AN cash flow across the cycles. We frame the line item of “Net cash provided by operating activities” from the funds flow statement and frame that vs. the combined total of capex and M&A. The profile of the cash flows for the franchise dealers vs. capex and discretionary M&A (adding revenue generating dealers) is what makes this industry so attractive to so many investors (and wealthy private owners who have dominated the ownership of dealers across history). That is what inspired Warren Buffet to become one of the largest dealers. As with railroads, Buffet saw the cash cow nature of auto retail. M&A can be “Big Bang” such as the pace set by Lithia, or steady and regular bolt-ons (so far, that has been AN’s style).
The chart breaks out the cash flow from operations for each year from 2008 and stacks “capex + M&A” to the right side of each year. It is a rare year when the left side falls short of the right, but AN can just grow both sides of the balance sheet and keep debt/EBITDA in check with accretive dealerships rolling in from all-new dealerships built out organically or expansion of current dealerships (including additional parts and services and F&I initiatives at existing sites).
The balancing act of capex and M&A has allowed AN to keep its financial risk profile in check and stabilize leverage in line with IG ratings. AN bonds are positioned in the low BBB composite rating tier with bonds at the holding company level without subsidiary guarantees. That lack of subsidiary guarantees presents some structural risk issues if AN were to get very aggressive in the use of leverage for whatever purposes (M&A, etc.). That said, AutoNation has traditionally been the most conservatively positioned of the peer group with the other 5 of the Big 6 dealers with bonds in the BB tier zone.
The main event risk theory out there right now revolves around what is in store for Carvana. Carvana has gone from the “superstar” of post-COVID tech stock excess to a financial restructuring waiting to happen (see Carvana: Prisoner’s Dilemma, Used Car Getaway 3-22-23, Carvana: Credit Profile 3-5-23). In contrast to Carvana, the financially healthy incumbent CarMax has the benefit of a solid balance sheet and successful operating history to face the headwinds in used vehicles (see CarMax 4Q23: Wacky Market, KMX Stays Steady 4-11-23).
1Q23 by the numbers…
The seasonally slow 1Q period only tells you so much since the real action lies ahead in the peak selling season. The income statement story was decidedly mediocre for AN in 1Q23 with revenue off by -5%, gross profit by -2% and net income down by -20%. Volume in new vehicles was off by 2% and in used by 15%.
The market is looking past the seasonal slow period as evident in the equity performance of most of the peer group but will remain highly sensitive to any material changes in how the consumer sector is perceived. The consumer has been viewed as the anchor of the current cycle to this point with unemployment low and payroll at record highs and job openings still very robust.
The US is a commuting country and that takes mobility. The old Census stat is that over 75% of the US commutes to work alone in vehicle. Adding in those who commute with another, gets up into the high 80% range. The number of licensed drivers keeps on rising, payrolls are at record highs, and retirees don’t stop driving (usually until someone insists). That is not a bad multicycle story for demand.
Getting into the business line weeds across new vehicles, used vehicles, F&I, and P&S, we break out the revenue lines below by major line items. Parts and Services is worth highlighting given its very high margins and an intrinsic cash flow advantage that the dealers have in their arsenal to compete and underwrite expansion in technology initiatives.
The Finance and Insurance business has been a priority business line across dealer networks as well. When you think about the role of online retail and more narrowly the fate of Carvana, a major ecommerce initiative still would be more logical as a wedge in someone else’s pie (i.e., a strategic acquisition). In a downturn, these other business lines also have the value of allowing the dealer to keep investing while “performing with a net” in supporting cash flows.
The table above breaks out revenue lines by business and unit volumes. The year 2019 gives a sense of what a “normal” new vehicle volume year might look like. That offers a lot of comfort for securities holders. The growth of the Parts and Service revenue line and expansion of F&I products and services also tells a good story in the face of the expansion of used cars, certified pre-owned vehicles, reconditioning investments, and new warranty offerings.
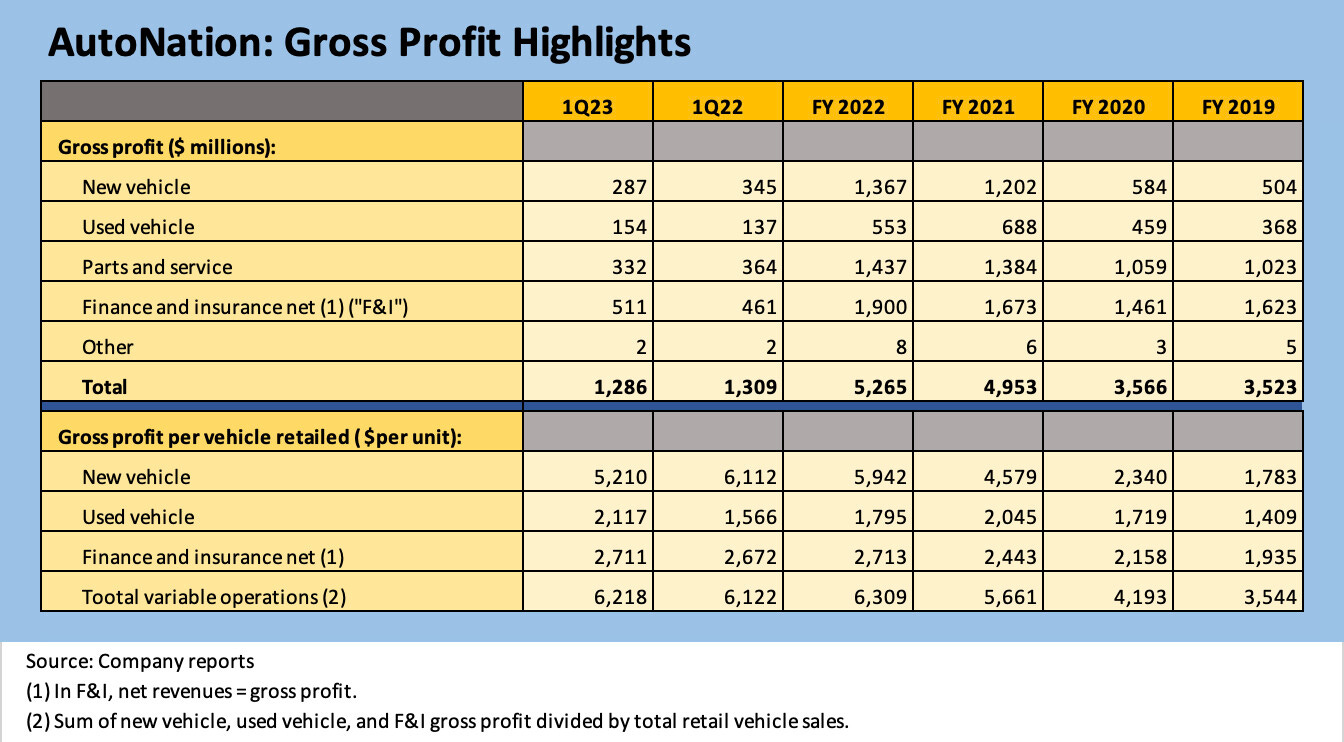
In terms of profitability, the gross profit performance by AN was off slightly by -1.7% as stronger gross profit numbers for Used Vehicle and Parts and Service were more than offset by declines in New Vehicle and Finance and Insurance gross profits. Gross profit per vehicle was up in FY 2022 but down in used vehicles. For 1Q23, both new and used vehicle gross profits per unit were higher YoY. Then again, volumes were off on a total unit basis. Starting off with well over $800 million in F&I and Parts and Service is a good running start even before vehicle margins.
We are not going to drill down into the more involved brand story lines for AutoNation in this note, but all three major brand groupings showed segment operating income declines across Domestic, Import, and Premium Luxury. Domestic posted a -20.7% YoY decline in segment income for 1Q23, Imports as a segment posted a -13.9% decline in segment income, but Premium Luxury was only off -1.2% in segment income. The brand mix profiles for the major dealers varies with the 1Q23 revenue mix for AN at 41% Premium Luxury, 30% Domestic, and 29% Import. A notable contrast would be Penske Automotive, which reports this week, as a franchise dealer with negligible exposure to US brands.
A quick note on the balance sheet…
Low BBB rated AN posted 1.82x leverage metrics under its Credit Agreement vs. a 3.75x max. The Capitalization ratio was 61.3% as defined vs. a 70.0% max. The $3.6 bn in total long-term debt (including current maturities) plus the $285 million in commercial paper comprises $3.88 bn in debt vs. book equity of $2.0 billion and market cap of over $6.2 billion. AN had $1.5 bn in availability under its revolver per the 10-Q.


