
Boeing: Peer Group Performance and Pension Details
We frame Boeing’s stock performance vs. peers and dig into the pension footnote for BA, the #1 corporate entity in total pension assets.


We use a review of the Boeing (BA) pension disclosure as an excuse to update BA’s relative equity performance across various time horizons within the broader peer group of defense and aerospace names.
BA has the largest pension plan asset balance of any private sector corporate entity if we include both defined benefit and defined contribution plans, so it was worth a more detailed look at their footnotes as a gut check on liabilities and expense/income related to pensions.
BA still has one of the highest GAAP unfunded pension obligations and some earnings quality question marks that show up in their pension story, but the intermediate term risks are very low on the funding side based on ERISA funding rules.
The most interesting twist in the BA defined benefit pension disclosure is the rate of pension plan asset drain with benefit payments well over 9% of ending plan assets with BA’s pension asset allocation showing a heavy weighting of fixed income.
In this commentary, we look at the moving parts of the Boeing pension liability and pension-related income statement components. Pensions at BA don’t make the short list of financial moving parts to worry about right now, but BA has more defined benefit and defined contribution assets than any other company, so that makes the pension liability risks an item to check off the list.
There will be no shortage of focus on BA’s MAX problems and how that can shift forecasts around new aircraft certifications and flow into volume and pricing pressures. The top line and cost risks and supplier chain challenges are still threatening the bigger cash flow and balance sheet picture (see Boeing: Different Scales, Different Magnitude 1-10-24). Those are much bigger risk factors than pension exposure, but the sheer size of BA’s legacy obligation and its role as one of the largest BBB issuers (and on the BBB cusp) makes every financial risk metric significant these days.
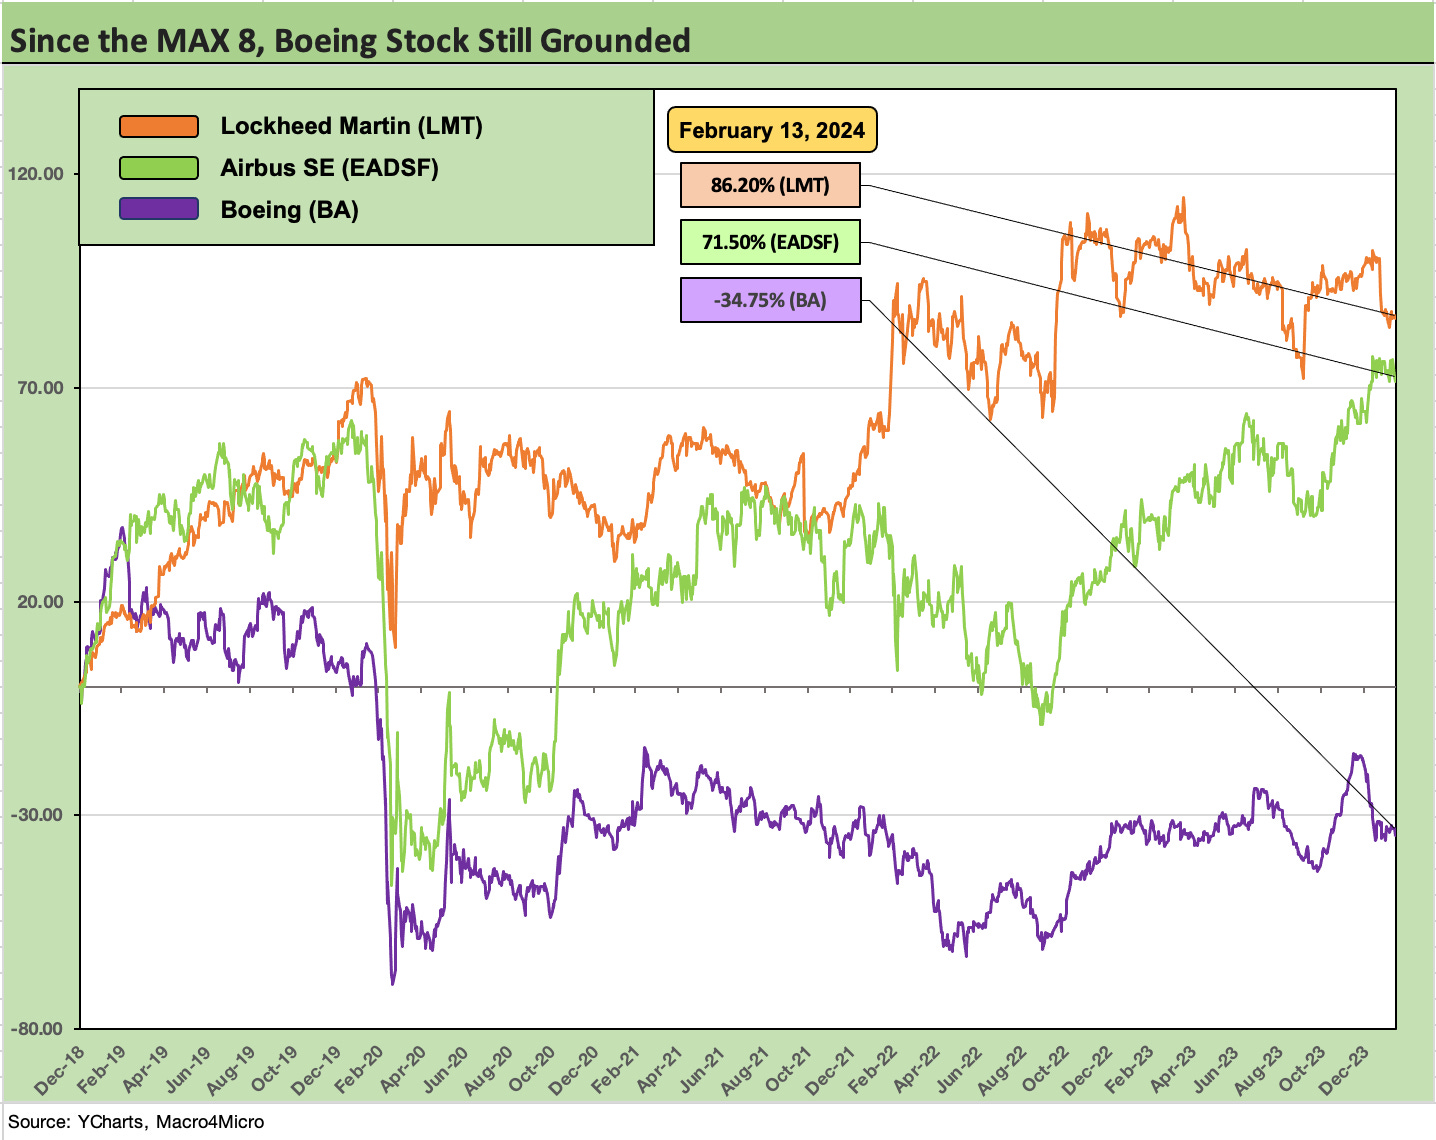
The chart at the top of this piece presents an update on market reaction across time to BA’s various “adventures.” We frame Boeing vs. Lockheed (#1 in defense) and Airbus (new #1 in narrow bodies). The timeline shows an unsurprising reminder of the challenges BA has faced in the Defense and Aerospace OEM peer group.
We plot the comparative performance from the end of 2018 to capture a timeline that includes the MAX 8 crisis of 2019 (reminder: grounded in March 2019) and the COVID meltdown of 2020 that required a government liquidity bailout of the domestic airline industry. During this latest stretch, BA faces the MAX 9 SNAFU and the questions around how much this whole fiasco will cost the company as it slows down the timing for its major 737 program (and gets more potential customers worried about other models including widebodies).
Away from the cost and contingent liabilities lines, BA analysts will need to consider to what extent volume adjustments to the planes currently in production will weigh on the top line and how they should handicap forward looking risks to the green light on the MAX 7 and MAX 10 certification in the backlog revenue stream. Threats to price adjustments to current order books will play a wildcard role as well.
The biggest worry will be that a few mega-customers (e.g. United) might choose to mitigate Boeing risk and change to Airbus for a bigger slice of their capacity expansion plans and fleet replacement needs. That will start to play out over 2024 as more issues get sorted with the FAA and major customers. There are also some event risk issues around the supplier chain and whether a failure to make progress will lead to demands for BA to make more radical changes to unwind some of its unbundling initiatives in its supplier chain (notably with Spirit AeroSystems).
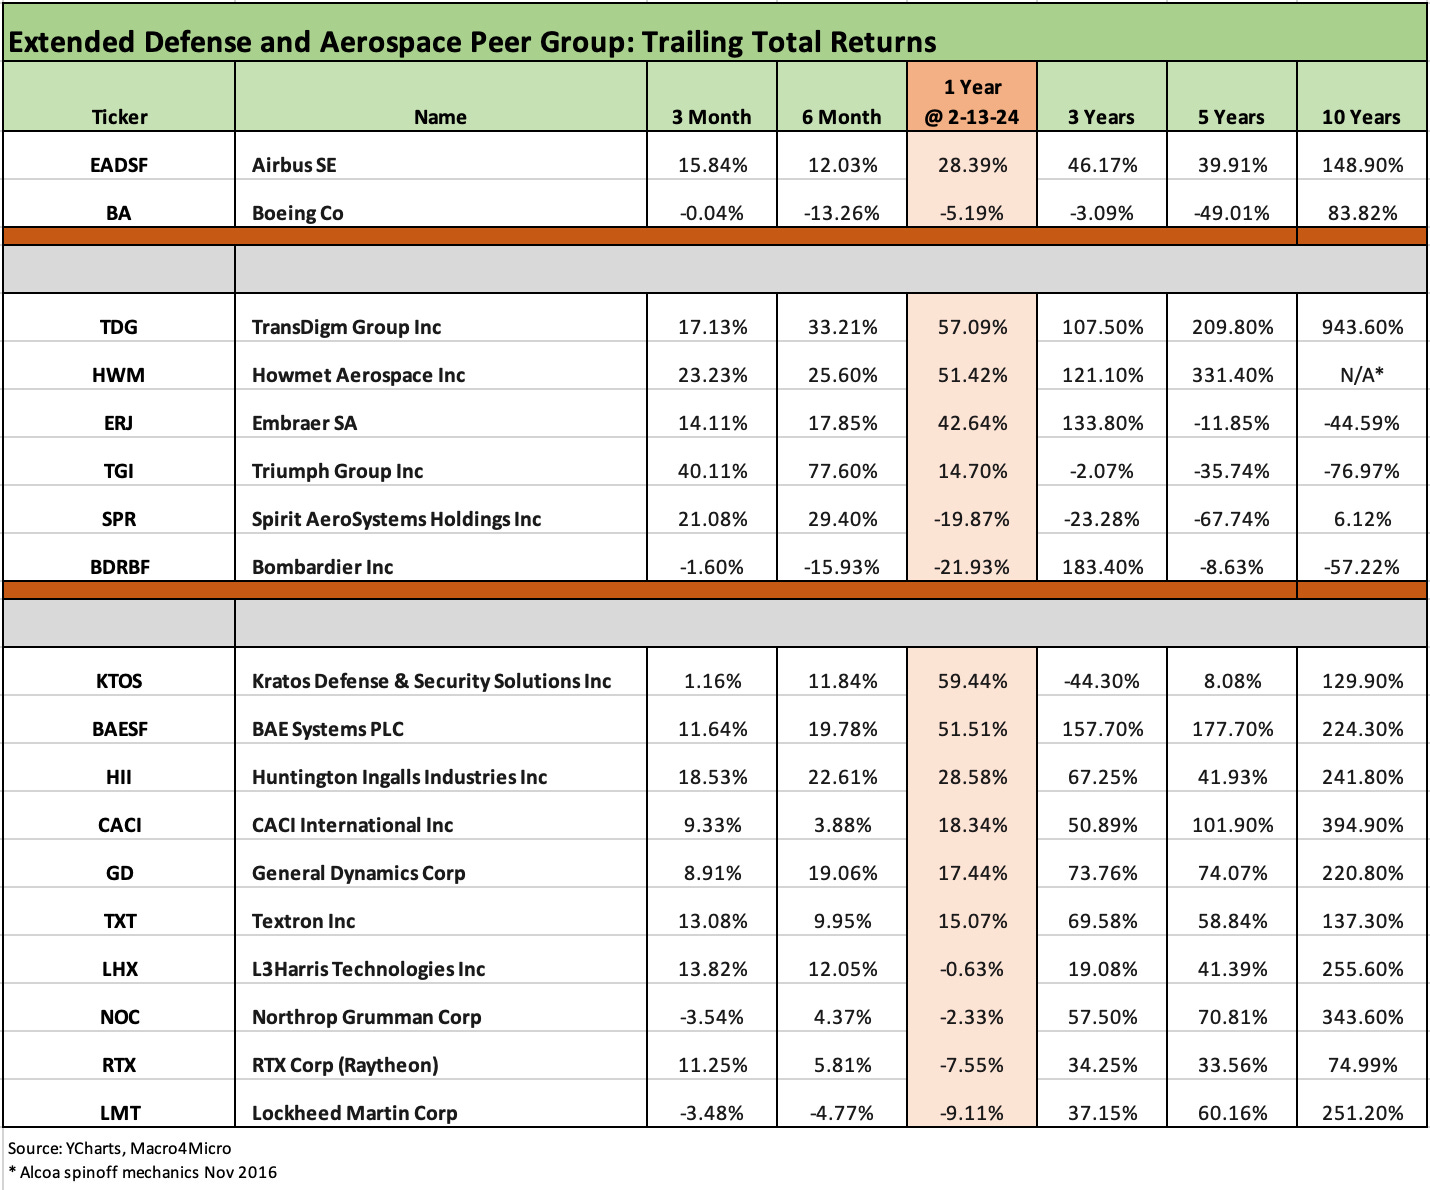
The table above frames a range of aerospace and defense names from supplier chains to aircraft manufacturers and those in defense and weapons systems. We break out the publicly traded companies into convenient groupings with the dynamic duo at the top.
The chart lines up the companies by subsector group in descending order of 1-year total returns for each subset. Interestingly, a significant slice of the largest prime defense leaders are struggling in a time of wars and major order books. Looking back 5 years, the worst two performers across the names are BA and Spirit AeroSystems. The COVID meltdown can explain some of that, but Airbus takes that excuse away.
The scale of the defense and aerospace end markets across both developed and emerging markets brings tens of thousands of companies in the supplier chain (Tier 1, 2, and 3) as well as with aftermarket players and service providers (MROs). That makes for multiplier effects across exports and imports. As badly as BA is doing (and they are struggling), the systemically important role played by the broader industry takes a lot of the edge off during periods of financial setbacks.
BA’s massive scale and position within a commercial aircraft global duopoly and as a member of the top tier of prime defense contractors allows the rating agencies and bondholders to cut the company a lot of slack in financial risk metrics criteria.
There is a lot going on across defense and commercial aerospace, but the theme is certainly not secular decline. There are myriad emerging technologies from unmanned to VTOL (“urban transport”) to cyber world and sustainable aviation fuel demands among other areas.
To quote the legendary Herb Kelleher of all-737 airline Southwest on the airline business: “Our job is to put butts in seats.” That takes large commercial aircraft - and a lot more than any one player can provide. That also takes planes with superior operating economics. That also means invisible doors cannot have loose bolts (or missing bolts) or improperly assembled air frames. Imagine if an avionics manufacturer had such problems?
Boeing bonds…life on the cusp as a long bond mega-issuer…
For BA narrowly, the net asset base shows an equity market cap of around $125 billion, so that makes a lot of other numbers look quite small. In the days right after the Alaska Air incident, BA’s market cap was around $137 bn, so there has been some pressure, but the moving parts are more about what it all costs in top line weakness or in “fix-it” outlays in expenses and capex. BA has been talking a relatively optimistic game qualitatively on 737 deliveries even if it has to step back from being too specific for 2024-2025 delivery schedules. That does not change the uncertainty much.
A massive supply of long-dated debt that is unrivaled in the BBB tier along the low BBB ledge still will keep market makers on edge if they see more adverse developments in the months ahead. As covered in our last commentary on BA, when you start looking across the debt beyond 10 years, BA is a very rare beast with a low BBB composite rating. BA had around $21 bn in bonds beyond 10 years with around $14 bn of that maturing in 20+ years.
Boeing’s pension is a perennial leader (or near leader) in the corporate ranks…
With BA consistently ranking among the highest in Projected Benefit Obligations (PBO) as well as unfunded pensions (on a GAAP basis), the pension disclosure is always worth a look for any signs of shifting risks or earnings quality dilution. The 10K disclosure for defined benefit plans comes around once a year for the major corporate pension plan sponsors.
According to rankings in Pension & Investments (one of our favorite publications), Boeing is a clear #1 by a material increment over AT&T in total pension plan assets when you combine Defined Benefits (DB) plan and Defined Contribution (DC) plans.
In the P&I rankings, Boeing was ranked #12 among all plans but #1 among corporate entities. The leader ranks are dominated by public sector sponsors (state funds, teachers etc.). Boeing was #2 in DC plan assets at $68 bn in the rankings. Public sector plans are heavy on defined benefit plans.
The survey included BA pension assets of $119 bn in combined DC and DB assets in the fall ($68 bn DC and $51 bn DB), but the year end DB assets were at almost $49 bn. In broader context, the DB plans are the ones you worry about in terms of funding requirements and the statutory clout of ERISA liabilities. The majority of employees at Boeing (and in the corporate universe generally) have migrated by choice or by mandate – to DC plans.
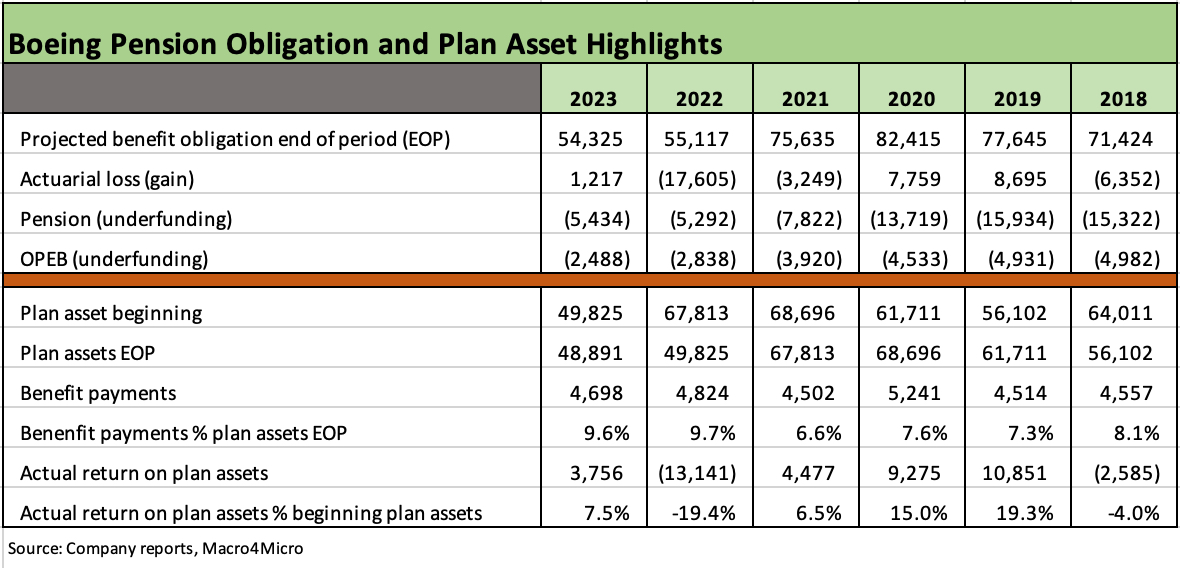
The above chart breaks out the Boeing pension obligations, assets, actuarial gains/losses in the PBO, relative funding position, and the benefit payments and returns on the plan assets. With $54 bn in PBO and almost $49 bn in plan assets, Boeing has always ranked near the top of the corporate defined benefit leaderboard in projected benefit obligations (PBO) and underfunding, and the same is true in 2023. A $5.4 bn unfunded GAAP obligation sounds high until you frame it against $125 bn in market cap (unfunded obligations just above 4% of market cap).
We also break out the benefit payments and frame it vs. ending asset base as a proxy measure of what could follow in 2024 for the pension plan asset “drain rate.” The 9.6% rate of payout from the plan is an eye opener on the cash flow demands. For now, the next 5 years are estimated to see pension benefit payments average over $4.3 bn per year with over $4.5 bn in 2024. We also record the actual return on plan assets each year in the chart. That benefit payments schedule calls for a lot of cash flow generating assets. Such a level of cash flow underscores the natural appeal of private credit for more pension funds.
While GAAP liability pension and OPEB metrics are not taken as seriously as they were in the early 2000s with the airline and auto adventures of past cycles, it is a box to check and can illuminate differences across those companies with the largest PBO and their varied funding and asset allocation strategies.
ERISA relief and the legislative easing of funding demands since the credit crisis and COVID pushed statutory discount rates lower before the recent shift in the US curve. The more relaxed funding demands since the crisis has kept onerous pension cash flow demands low for many corporate plans.
The ERISA pension focus went from being tougher on pension plan sponsors to fund their plans before the credit crisis to sponsors being given a lot of relief in measurement rules so the most exposed did not blow up on cash flow stress and drop the obligations into the hands of the Pension Benefit Guarantee Corp (PBGC).
The legislative history across the post-crisis period into the COVID relief bills are for another day and broader pension review, but the policy goal was to relieve liquidity stress on companies and to get them investing and hiring. Whether that reduced cash flow demand went in that direction (investing, hiring, reducing financial risk, etc.) vs. buybacks and M&A is a separate debate on a case-by-case basis.
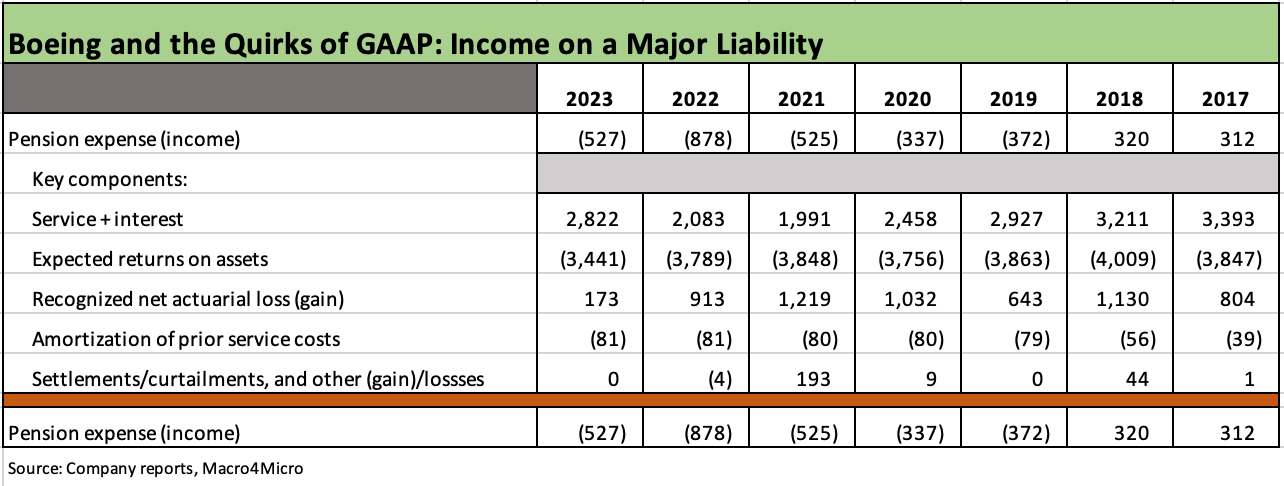
A material income line instead of an expense for a major liability is always a head scratcher even if GAAP compliant, but we thought it was worth breaking out in the above chart. Pension “expense” in BA’s case is actually posting net pension “income” of $527 million for FY 2023 based on the accounting rules. That is the case even with an unfunded liability of over $5.4 bn.
As detailed above, once you drop in the “contra-expense” line from the expected return on assets, you see BA generating income on a major pension liability line. That has sometimes been a strange side effect of GAAP. That pension obligation at some point will need to be funded with cash (subject to ERISA rules and IRS guidelines among other factors). BA gives some additional adjusted income disclosure lines for core operating income with some tweaks on pension treatment, but the GAAP reporting distorts the bottom line.
We do not focus on OPEB liabilities and expenses in this note, but the OPEB expense is also a small income line in 2023 (small expense in 2022) despite benefit payments of around $375 mn in 2023. These income lines vs. cash demands are GAAP compliant and not atypical for companies that expanded in highly unionized industries. The effect is to overstate income even if the measurement is fully legitimate GAAP.
On a separate note, the expense for BA’s defined contribution (DC) plans amounted to $1.56 bn in 2023, up from $1.26 bn in 2022. BA ranks as the #1 corporate entity in DC plan assets according to Pension & Investments.
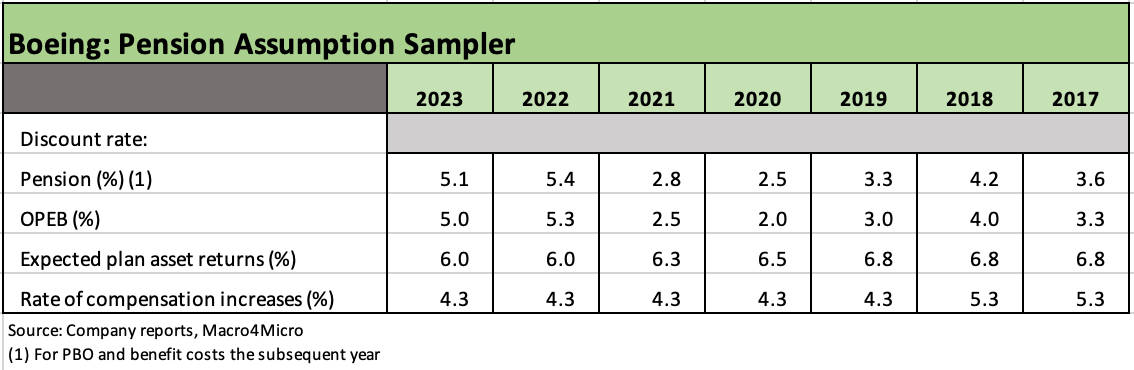
The above chart details the plan asset return assumptions across the years when discount rates were low with UST rates so low during ZIRP. The 6.0% plan asset return assumption is reasonable with the overall asset allocation picture. The assumed rate of compensation increase with a low 4% handle is a useful input in these days of inflation debates. The discount rate increases in 2022-2023 took the PBO numbers lower as the tightening cycle kicked into gear.
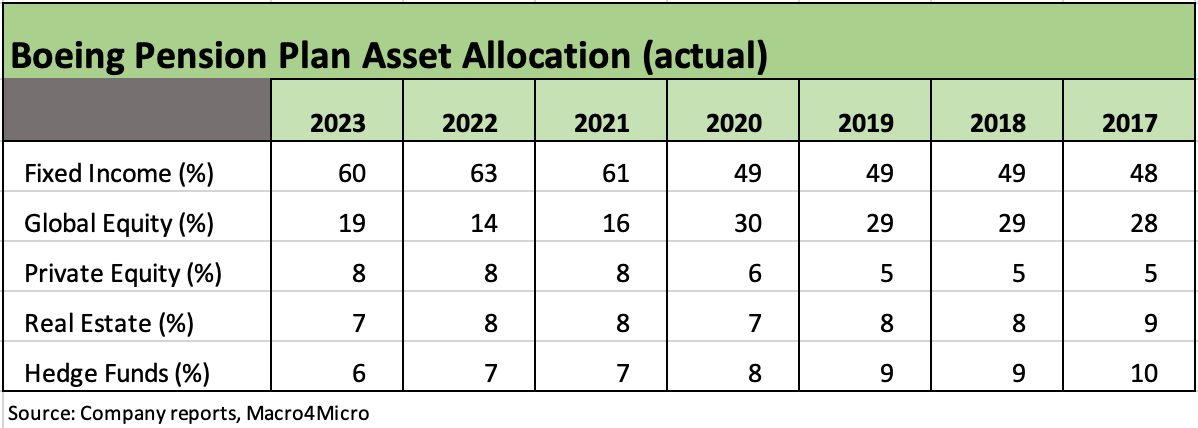
Such pension footnote exercises also remind us of the asset allocation strategies that have been rolled into place over the years as defined benefit plans mature and more bonds show up in the mix for a range of reasons. The growing mix of bonds in the BA pension plans saw the whipsaw of the UST curve down during COVID and then materially higher during the tightening cycle.
The fixed income mix trends above show an allocation of 60% fixed income to end 2023, which is up from 48% in 2017. Global equity is down to 19% from 28% in 2017. The remainder is a single digit mix across private equity, real estate, and hedge funds. That mix can easily defend the 6.0% expected plan asset return rate. Whenever you have equities and higher-risk-reward asset classes such as equities, private equity, and hedge funds, you have a lot of room to maneuver on assumptions.
The pitchbooks for retirement asset gathering are staying very busy and certainly not getting less complicated as more asset managers seek to offer their expertise in debt and more narrowly in credit with private credit rolling in as a growth asset class. Credit risk in retirement funds will be (and should be) on the rise.
Pension plan sponsors can reallocate from volatile equities with low cash flow streams into credit risk with high cash flow generation. It is a question of how much credit risk and how much secondary liquidity is needed. You can bet everyone is gearing up on credit background information with all the private credit pitchbooks streaming in.
The disconnect between where credit asset subsectors fit along the risk-reward continuum has always been an area of confusion for some asset allocation strategies over the decades. For those who use 60-40 as a starting point before migrating into other asset classes, you can allocate into credit out of the 60% (equities) or the 40% (bonds) to optimize income generating assets with various maturities and structural seniority subject to portfolio risk appetites. In the case of BA’s pension plans, a benefit payment rate of 9.6% is tough to satisfy.
The move toward more fixed income in the asset allocation is consistent with the de-risking trends seen over the past two decades. Many major employers have shed liabilities and assets in pension risk transfer transactions with major insurance players in the space. Many large plans in the corporate universe are closed, frozen and sometimes (rarely) terminated in Chapter 11 as part of the ongoing shift to defined contribution plans. Demographic trends lend themselves to a high mix of bonds and cash flow generating assets to service the benefit payments of an aging retiree base.