
New Home Sales: Holding Pattern
We look at new home sales volumes and price trends in a market that has stabilized but still subject to the peak season selling test.


“Circling patterns will find a direction soon enough.”
The Feb 2023 numbers show an uptick in price and volume vs. January 2023 but still down materially YoY as expected.
The steady rise in the mix of “completed homes sold” and reduction in the share of “homes sold under construction” keeps the working capital cycle going as homebuilders steadily bring inventory into line with fewer buyers at current mortgage rates.
Many homebuilders have been selling later in the building cycle with a higher spec mix to have move-in ready homes as they keep an eye on mortgage rates as peak selling season proceeds in the spring and summer.
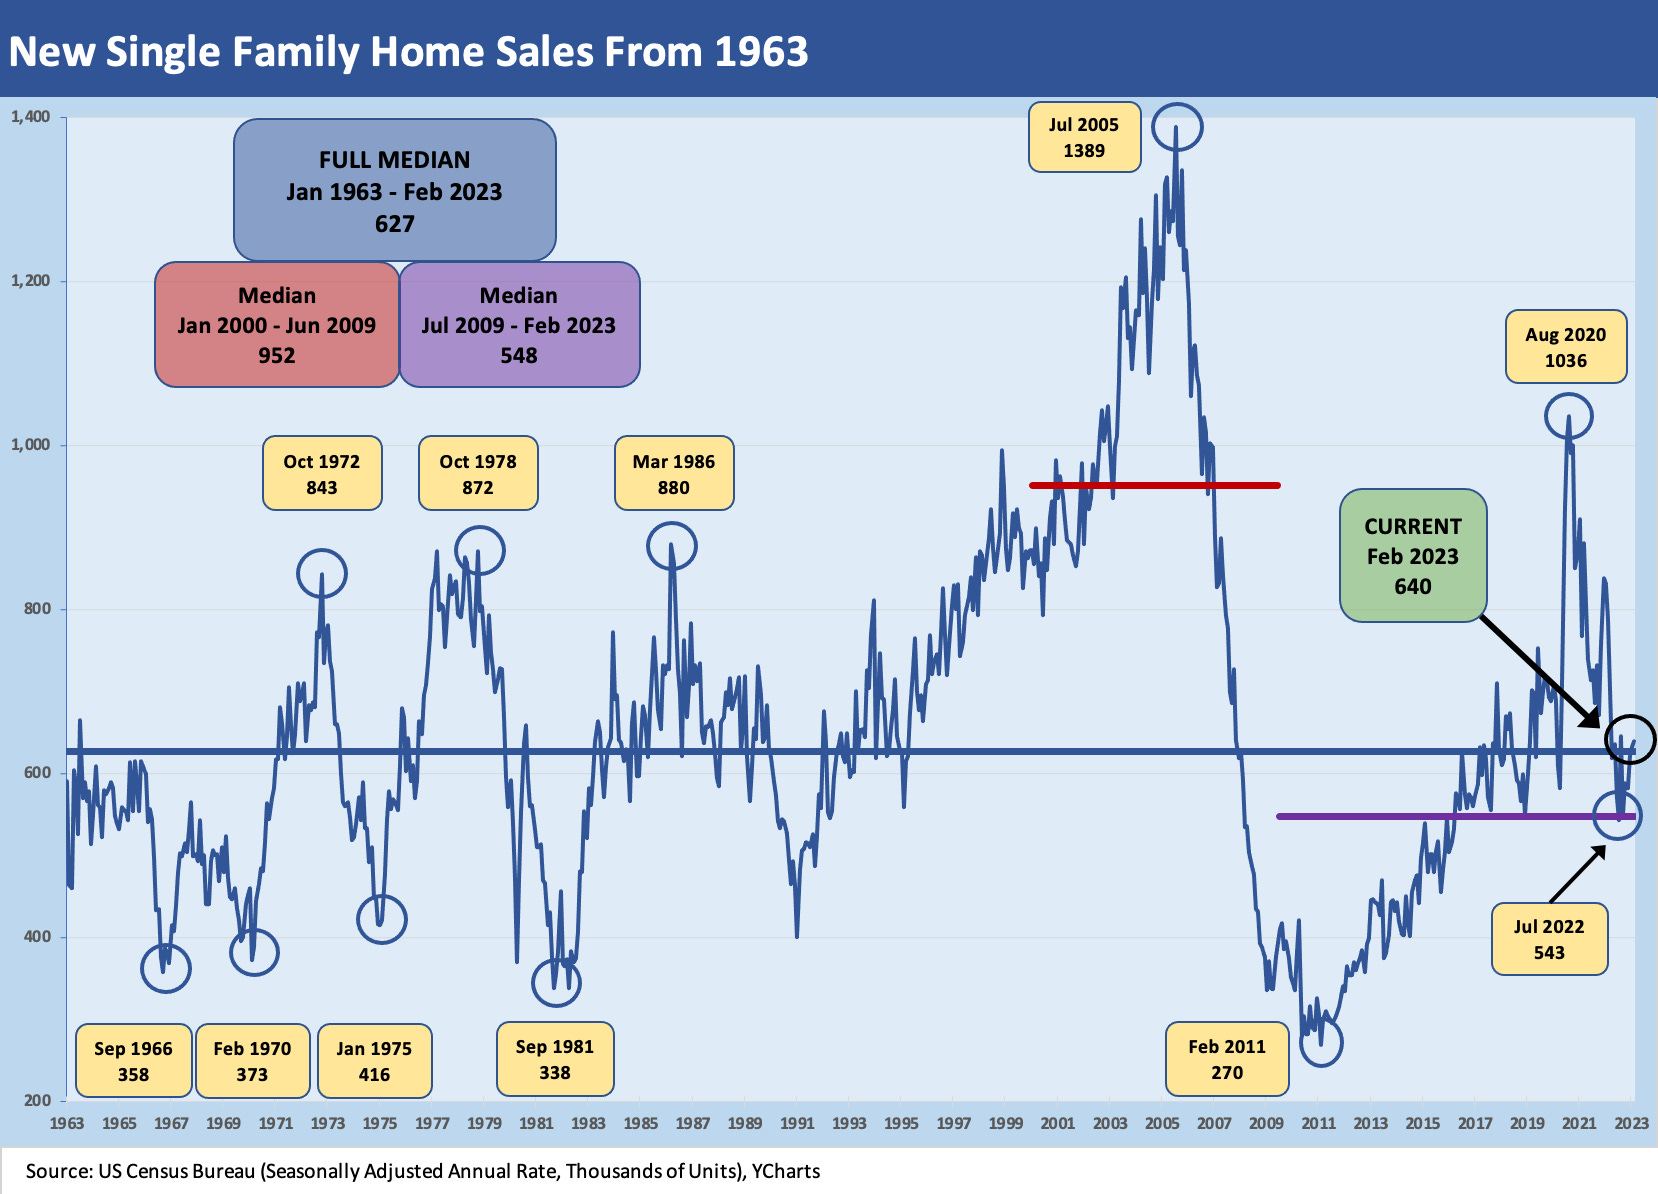
The above chart updates the new single family home sales numbers for Feb 2023. There is a heavy mix of revisions in these data releases each month, and we revise the time series accordingly. The 1.1% sequential increase in new home sales is like last month’s theme in that “it beats the alternative” (see New Home Sales: Sequential Stabilization Beats a Sharp Stick 2-24-23). We see upticks sequentially in the South at +3.0% (#1 by volume with TX and FLA in that category) and in the West at +8.1% (#2 by volume). The Midwest was essentially flat and the Northeast (the smallest region) down by 40% MoM and YoY by 55%.
The inventory story line is interesting with a sharp rise in the total homes “for sale at end of period” in the category of “completed” homes. That inventory mix at period end mirrors the rising share of homes sold during the period in the “completed” category. Builders have built up controlled lot positions that use a growing mix of their lots under options this cycle. They have ample room to maneuver in the controlled lot planning if the market unravels. The strategy has evolved since the housing bubble and credit crisis.
The steady decline in sales of homes under construction is in part by design with more home sales late in the building cycle. As we cover in the home starts commentaries (see Housing: Starts, Permits, Construction, and Cyclical Moving Parts 3-16-23), the “under construction” line item had reached historical highs and is now being gradually drawn down as land spend declines and inventory gets worked through.
With mortgage rates bouncing around from low 6% to 7% in recent weeks, the waiting game on mortgages is part of the process since buyers often need credit and the mortgage process can lead to a rise in cancellations. Last night we saw 6.4% on 30Y fixed, so the market is more agreeable than the recent revisiting to high 6% and 7%. The mortgage buydown strategies of the builders have helped keep volume firm in recent months in a brutal market.
The UST curve is now more worried about recessions and credit contraction driving bigger macro problems and that is flowing into the yield curve. With the 10Y UST as the driver of 30Y fixed rate mortgages, the decline of the 10Y UST is under 3.5% at today’s midday pricing, or down from over 4% in the fall and earlier this month.
The credit contraction process and how that influences credit availability in housing will be one to watch, but the tradeoff of better affordability at lower rates is the more important factor. Unemployment is still exceptionally low and workers on payroll is at a record. That factor is what keeps most investors comfortable with the vagaries of the housing cycle. Favorable supply demand fundamentals in housing remain the interim theme if not the short term reality.

The median price detailed in the new home sales report always comes with the asterisk around product mix, price tier, and regional mix shifts. The $438.2K median is up sequentially from Jan 2023 but below the July 2022 to Dec 2022 price levels. In terms of geographic mix, we already cited the rise of +8.1% in the West and a +3.0% increase from Jan 2023 in the South, which is by far the largest region. Those stats are on a seasonally adjusted basis. The West is a high price region.
Earlier this week, we covered the volume changes in the price tiers for existing home sales, and that offers somewhat of a proxy for what is going on across product tiers from homes in the low price range ($100 to $250K) to luxury tiers ($1M+) (see Existing Home Sales: The Sun Will Come Out…When? 3-21-23).
The new home sales release also addressed the price tiers, and we saw an increase in the mix of $500 to $750K band (23% to 30%) and a decrease in the $300 to $399.9K range (33% to 26%). The $750K and over tier share was flat at 11% and the $200 to $299.9K tier was flat at 12%. It is a big country out there and the Hi-Lo mix nationally as well as by region and builder is always an eye opener (see Homebuilders: Average Selling Prices by Company 2-17-23).