New Home Sales - Now the Leaves are Falling Fast
Record new home median prices reflect the sales contract lags, but the YoY numbers get worse from here.
New home sales rang up some good numbers as a seriously lagging indicator of a strong market earlier in 2022 with Oct 2022 posting record high median prices for New Home Sales.
The median price of $493K indicated a level of market strength that builders took pains to explain away on their earnings calls. These favorable trailing conditions are now gone.
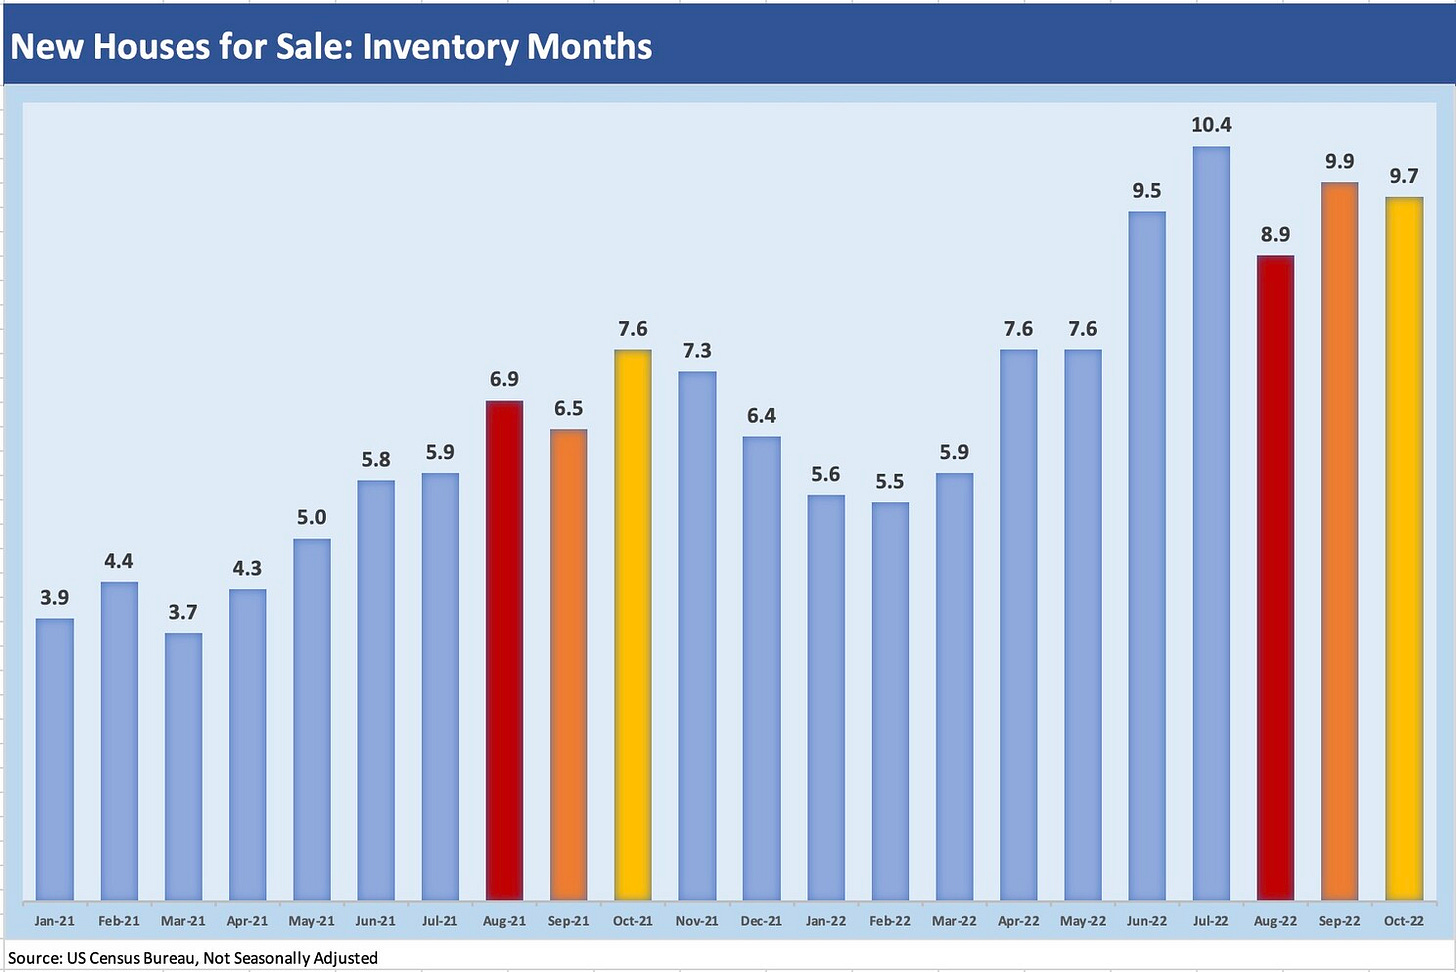
The months of inventory detailed in Houses For Sale (using “not seasonally adjusted” data) had already taken a grim turn starting in June with more 9-month handles and a 10-month handle thrown in.
The last of the Big 3 housing releases tells a mixed but lagging story…
The housing sector is going to remain under intense scrutiny as the market keeps rolling into what is a sharp downturn. With Wednesday’s New Home Sales release, the market just got through the Big 3 of monthly housing releases over the past two weeks. As a reminder, Existing Home Sales is over 90% of total home sales and is the best metric on supply (see Market Menagerie: Existing Home Sales – Supply Swing Factor). The New Home Sales data is especially important for the major industry issuers trading in the debt and equity markets. This high level data helps for color, but for the builders there is no substitute for the quarterly earnings report and especially given the pace of change not captured by headline Census reports. The same is true with the suppliers.
There will be waves of data points ahead from the builders, mortgage bankers, and the realtor trade groups (NAR) and other major trade groups (NAHB). The macro reverberations are here every time the Fed makes a speech. The macro prognosticating will pick up after the Dec 13 CPI numbers on how the UST 10Y will flow into long dated mortgage levels and affordability. The questions around supply-demand in housing and the strategies of the builders and buyers will loom large and will need to be revisited along the way (see Market Menagerie: Housing Questions to Ponder). The bears and bulls will have much to play with.
Since I try to read as many of the major builder’s earnings transcripts as I can, I tend not to find as much value in the New Home Sales data reports as I get from Existing Home Sales and Housing Starts (see Market Menagerie: Homebuilder Fits, Starts, and Permits). All the headline releases fit into a pattern to watch, however, so I break out the new home sales information herein across three charts: 1) the long-term time series on single family new home sales, 2) the median prices on new home sales, and 3) the months of supply measuring the inventory of “Houses for Sale” (as defined by the Census).
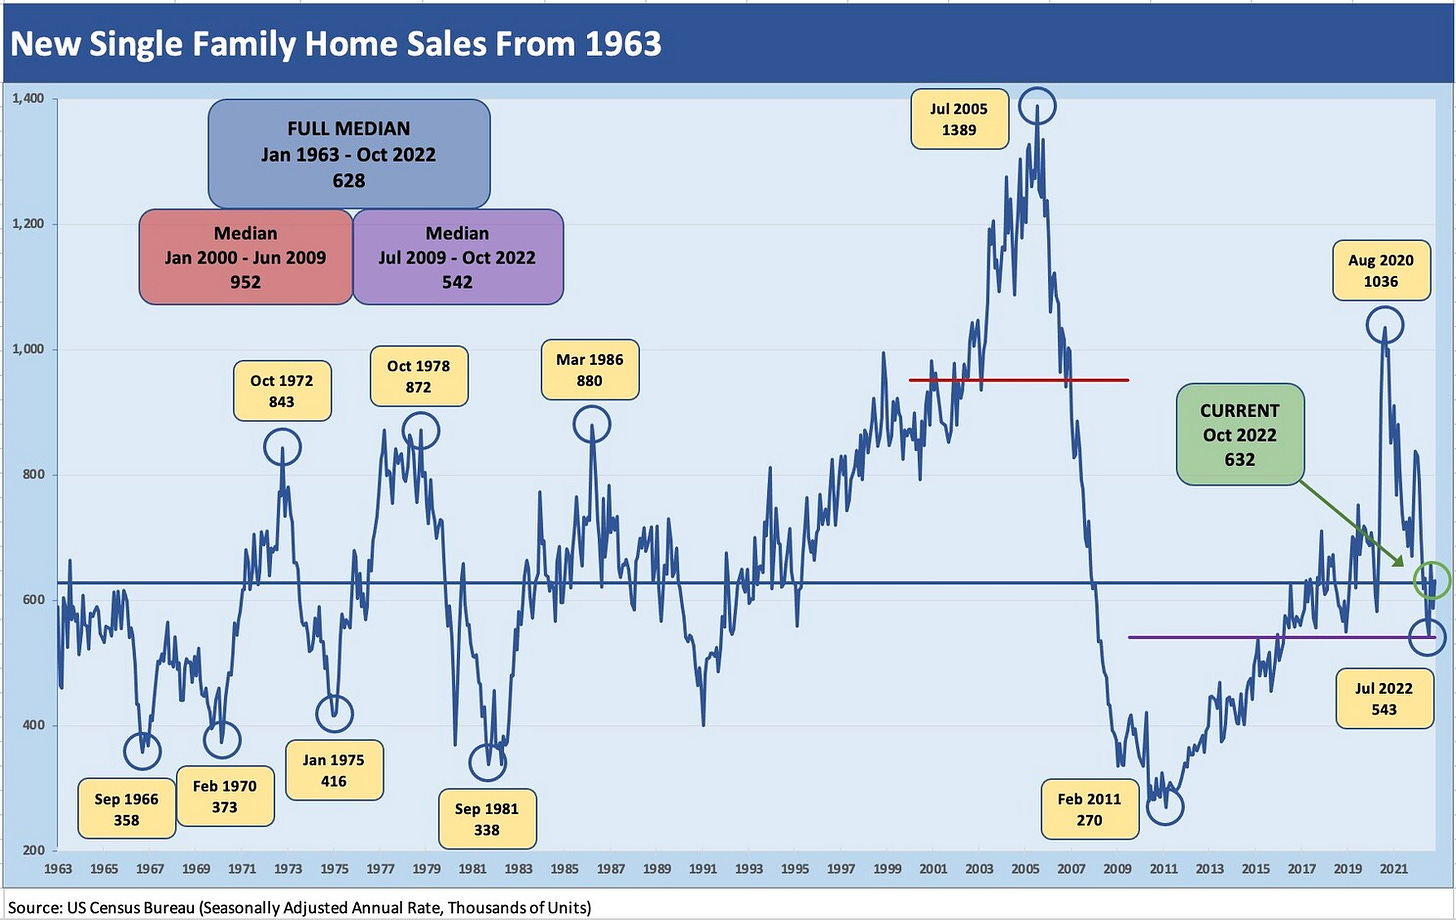
The long-term time series shows a pattern that most of us have gotten used to at this point for new or existing sales. We see the massive, credit-driven spike of the 2004-2006 period rolling into a deep dive on the way to a housing sector crisis and mortgage market meltdown (see Wild Transition Year: The Chaos of 2007). The chart above details a median of only 542K for new single family home sales (seasonally adjusted) after the post-crisis economic cyclical low (June 2009). That 542K level stands in contrast to the long-term (beginning 1963) of 628K. The Jan 2000 to June 2009 period posted 952K in a period that included the housing bubble. That is a stark differential. More recently, the market saw a brief spike in the summer of 2020 at 1036K and a plunge to 543K in July 2022.
The main value of this monthly Census chart is it gives a high-level estimate on the running sales volumes and supply for sale from a very fragmented homebuilder sector. The top-down charts complement the color offered by the major public builders on their recent sales experiences. Various major builders have different reporting periods, so there is a steady supply of details at the national and regional level that discusses in qualitative and quantitative terms what is going on in pricing (materially weakening from here net of incentives) and cancellations (rising sharply).
In looking at this month’s rather robust pricing numbers and volumes in the Census release, those watching the housing sector need to consider what is already unfolding (plunging demand on affordability pressures, many buyers losing access to credit, recession fears postponing decisions, etc.). The chart offers a reminder of how low new home sales already are in historical context despite a material shortfall of supply relative to the demographic need. The long-term demand fundamentals are quite favorable, but the reality of near-term industry dynamics are decidedly unfavorable.
Supply-demand governs as always, and the new vs. existing home supply will need to be watched in tandem with builder supply. New home median prices ($493K) are higher than existing homes ($379K), but there are plenty of barriers to existing homeowners selling given low mortgage rates they locked in combined with the challenge of “where to go next” (and at what mortgage rate and monthly payment). The supply chain and labor issues had already been a source of headwinds for industry supply this past cycle before the UST shift and mortgage spike, but now the homebuilders have a whole new array of challenges.
The good news for builders had been that the imbalances of excess demand had afforded the builder pricing power. Gross margins soared in recent cyclical context. That pricing power is not the case now. The economics of new home sales (downward price pressure) now come into conflict with cost pressures for the builder. The demand side will compel builders to offer sales incentives (base price cuts, mortgage buydowns, deals on fees, etc.). As we covered in our commentary on housing starts and construction, the builder strategies will entail a shift on land spend vs. development spend and require a hard review on timing and mix. Those are discussions for other days.
Median prices defy logic and reflect lags…
Below we post a bar chart that shows record median new home sales prices reported as part of this monthly release. One caveat on medians is that the number can distorted by regional mix and price tier shifts across time. It offers the value of a good snapshot on typical pricing in any given market.
The trade rags and market watchers are already assigning a grain of salt to the bullish pricing numbers. The latest quarterly earnings reports from the major builders took pains to detail that the very strong reported numbers were generated by contracts signed in much stronger periods or by buyers who were rushing to get ahead of further rises in mortgage rates. The sentiment for builders and buyers alike has been going “dark side” of late, and the industry is hunkering down.
Houses For Sale inventory signals price pressure and incentives will dominate the near term…
Below I post a bar chart on months inventory of Houses For Sale at the end of each monthly period. We color code the trailing three months for comparison YoY for August, September and October. The timeline runs from the start of January 2021 (3.9 months) across a very bullish 2021 into the tumultuous mortgage rate moves of 2022 to a current preliminary number of Oct 2022 of 9.7 months (not seasonally adjusted, but it is 8.9 months seasonally adjusted). These numbers get revised for the trailing 3-4 months in later releases. I looked at some old releases and saw a low point of 3.4 months in July 2020 with 3-handles from June 2020 to Oct 2020. As a reminder, I use “not seasonally adjusted” data for the monthly details, which I think better reflects what is going on at sea level with the builders.
I need to highlight up front that the “Homes For Sale” inventory metric is not what the typical person on the street might use. There are no contracts on these homes, but some have not even been started. The headline numbers used to compute inventory months includes three buckets: Not Started, Under Construction, and Completed. As an example from this month, “Not Started” was 23% of the Houses for Sale (not seasonally adjusted) while “Completed” was 13%. The remainder was in the largest bucket of “Under Construction” at 64% of the total.
The high 8 and 9 handles for months of inventory lately (a 10.4-months eye-popper in July) signal the need for a heavy and creative use of incentives and pricing concessions ahead at a time of more cancellation risk. The magnitude of those pressures will play out over coming months subject to CPI/PCE and the Fed, the market expectations for inflation and how that flows into longer maturities, actions by mortgage lenders (mortgage applications) and how aggressive non-QM lenders get in the periods ahead, and the builder strategies around pricing and mortgage buy-downs, etc.
I will look at some of those topics in coming weeks. This is a sector with a lot going on that touches many households and dozens of related industry subsectors. When you listen to a builder earnings call (or read a transcript), the level of complexity across builders, suppliers, real estate brokers (e.g., Anywhere Real Estate [formerly Realogy]), or mortgage lenders (notably specialty mortgage originators with all their jargon. e.g., Rocket Companies) can be daunting.


