Homebuilder Fits, Starts and Permits
The starts and permits numbers show the recession in single family, but total “under construction” is booming.
Highlights
The latest trend line for new residential construction shows a logical downsizing of permits and starts as the housing cycle turns down, but the cyclical high in homes under construction gives potential buyers and builders time to watch the variables (mortgage rates, employment, etc.)
In this commentary, I look across regional breakdowns for 1-unit starts to give some context to what is shaping up as an orderly balance of less permits, fewer starts, and a shift in spend from land to development and then to monetization and free cash flow for the major builders.
The longer-term reality (see multi-decade charts herein) shows a market that will remain short of supply vs. demand even if new construction slows down and pulls back the throttle in the face of inflation, a whipsaw in mortgage rates, battered affordability, and recession anxiety.
Permits and starts keep plodding downhill in 2022…
While it is important to watch the Census Bureau’s month-to-month releases for New Residential Construction, it is also key not to lose the bigger context of housing sector activity. Demographics and supply-demand still favor builders across a time horizon looking out just a few years. The monthly release posts headlines that tend to feature the starts number (for good reason) and, to a lesser extent, permits. The release also includes completions and houses under construction in total and by region. The houses under construction numbers highlight the high rate of activity that keeps wages rising and material prices high.
The forward-looking view is clearly negative, but don’t lose sight of the very high current rate of activity. The “mortgage watch” will remain in effect as the fed battles inflation and companies revisit their payroll planning and inventory management. The headline and core inflation metrics will benefit from favorable YoY comps in 2023 vs. 2022, so that helps. Inflation expectations and recession fears will see the longer end of the UST market react as the Fed manages the short end. The 10Y UST is critical in mortgage pricing, so a 4% area UST would likely be a relief to many if that can hold with a soft landing and tamed inflation. Builders and buyers can make their plans on timing if that unfolds.
Starts and permits frame a cyclical downturn…
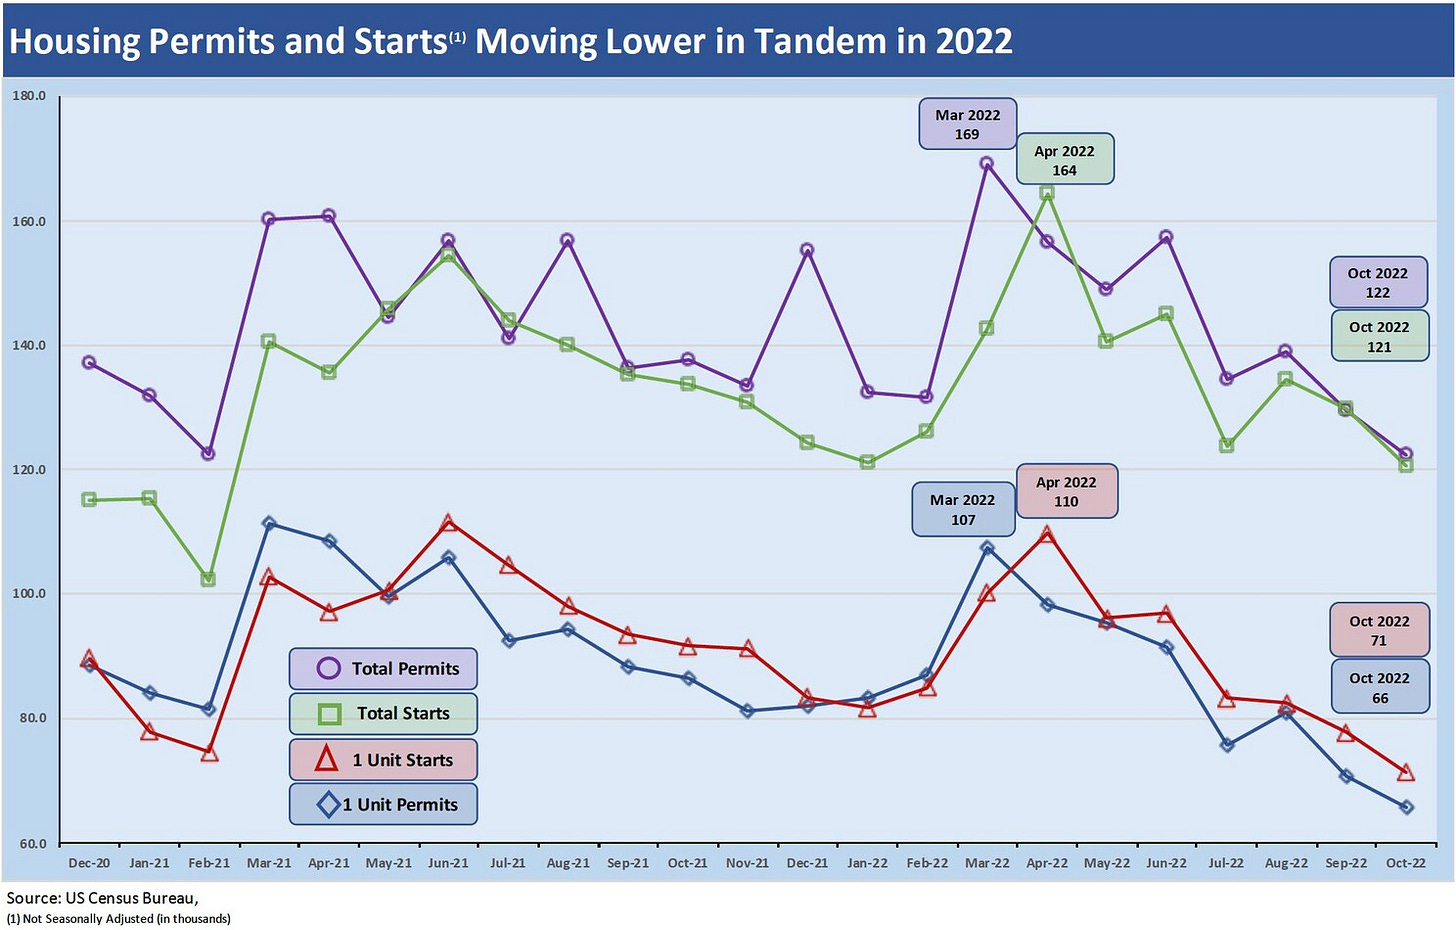
We see Total Starts (including multifamily) not seasonally adjusted down by 9.7% YoY for Oct 2022 and 1-Unit Starts down 22.2%. The fact that Multifamily is up YTD in 2022 by 17.1% (not seasonally adjusted) also tells a story on demographics and how the housing market is evolving. Below I lock in more on the 1-unit data from the release.
For broader context, it is important to consider the steady drumbeat of permits across time and the fact that the market is posting highs in total housing units under construction with multifamily growth as a solid contributor. The 1-unit count in homes under construction is off the highs. I like to watch 1-unit numbers more closely than the Total for a clean snapshot of the typical new homebuyer. I will look at multifamily and other major drivers of housing (rentals) separately.
The above chart shows the path of permits and starts for Total Units and for 1-Unit Starts and Permits. The downturn in permits and starts tells a story of sector contraction even if the pace varies by region. The unit metrics only get you so far, since whether permits or starts, the analysis at the homebuilder levels get back to where, at what price tier and what the cost of those units are that will flow into homebuilder margins. Community planning by the builders will be a builder-by-builder exercise.
The exercise also gets back to consumer preference and how much a potential homebuyer will want in terms of “house for the buyer’s dollar.” Supply and demand patterns by both region and community matter as do price incentives. Securities holders and lenders will be on the lookout for impairment risks and how that frames up vs. cancelled option costs. The increased use of options this past cycle will cap loss exposure to some plans, but the impairment risk still lurks.
Will the South rise again?
The chart below looks at the path of 1-Unit Permits and Starts by region since Dec 2020 as activity was picking up after the vaccine news and well before inflation started rearing its ugly head. The position of the regional timelines highlights the importance of the South and, to a lesser extent, the West in the overall picture. I flag Oct 2022 housing starts for each region.
I also highlight April 2022 since that was the month of the LTM peak and the peak for the South. The range of new home pricing across those regions is quite dramatic from the luxury players such as Toll Brothers in the high-price tiers through LGI on the low end with its focus on entry level and first time buyers. I should highlight that I like to look at monthly starts and permits metrics “not seasonally adjusted” since this more accurately reflects actual construction on the ground.
The South (includes Texas and Florida) is by far the largest region on the Census map (56% of Total Starts, 59% of 1-Unit Starts for Oct 2022), and this crucial region saw permits down by 23% YoY for 1-unit metrics with single family starts down by -17.6% (unadjusted). The West (approximately 19.4% of 1-Unit Starts) was under serious pressure in 1-unit differentials vs. Oct 2021 with starts at -39.5% (unadjusted) and permits at -31.5%. Just a glance at the time series highlights the smaller role played by the Northeast (6.3% of unadjusted 1-Unit Starts in October preliminary numbers) with the Midwest (15.3% of unadjusted starts) registering higher in the ranks.
An important note is that “housing units under construction” are at a high in the South over the past year and modestly below a high in the West. The oil patch is in good shape, and the market is still assessing housing needs in Florida after the hurricane disaster. Overall, there is plenty of activity in construction even if the clock is ticking into 2023 as land spend, and eventually development spend, starts to decline and investment gets reassessed. The lag time to the full impact of the declining permits and starts offers plenty of reasons to watch for the catalysts to shift into 2023, with mortgages rates and employment at the top of the list.
Cash flow cycles in housing should ease financial risk anxiety…
From a financial risk standpoint in the homebuilder sector, the high variable cost mix comes with an asterisk that the result is high cash flow generation to go with the steady declines in revenue and earnings. I typically phrase this as “the risk analysis moves from the income statement to the cash flow statement.” Finding the bottom in housing broadly and homebuilding narrowly will be tied to gauging where the baseline demand will stabilize as the combination of slowly eroding affordability, mortgage rate equilibrium, rising unemployment, and tighter credit play out.
The ultimate ace in the hole for homebuilders is that demographics support demand, and the supply-demand shortfall for housing (owned or rented) is not going away anytime soon. Regional supply-demand and product segment mix dynamics will vary by builder and region, but the fact that existing home sales will also face headwinds (e.g. homeowners with very low mortgage rates will think twice about moving) is going to keep the supply analysis a complicated one. Declining home equity values will be in a battle with fear around what is on the other side of the sales with higher mortgage rates and associated monthly payments.
Some risk mitigating comfort in terms of credit quality for the builders can be gained from the view that they can trim land spend, focus on development, and generate cash flow from the existing pipeline and houses under contract. The mix of spec home expectations vs. build to order can get reviewed at the builder-specific level—another day, a different commentary.
The long-term single family time series is a case study in volatility…
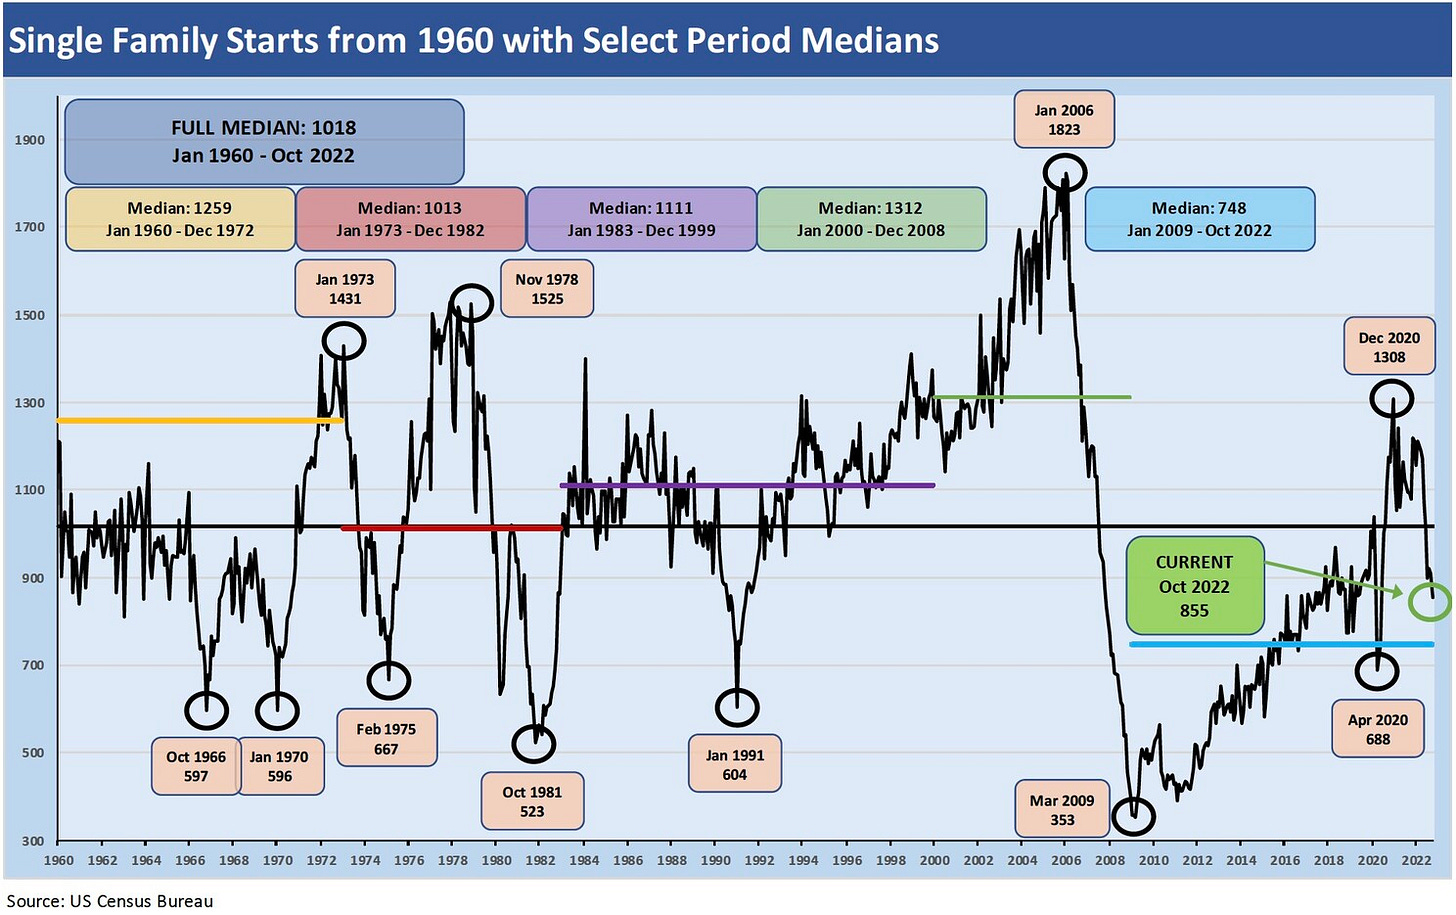
The interesting twist in the long-term timeline for single family starts detailed in the chart below is that the slow-and-steady march of demographics that anchors long term and intermediate term demand contrasts with the major cyclical swings in new home supply. The chart underscores how risky the markets can be at times for the revenue and earnings line. Builders and lenders have not seen a mortgage swing like this in decades, so the big shift in volumes is coming back. The refrain in life is that a home is the best investment and a natural hedge against inflation, but looking back across time, the pain in builder equities and RMBS tell a story of significant volatility.
I drop in this longer timeline for single-family starts for historical context on how low the current rate of starts actually is when framed across the cycles. The chart plots single-family starts from the Go-Go 60s into wilder times like the stagflation years of the 70s and early 80s. The housing bubble spike and crash to an early 2000 low is in a class by itself. The COVID period of 2020 was another wild one even with many housing projects classified as essential services that were less restricted by the state. The bounce from the early 2020 low to the Dec 2020, post-vaccine spike was outsized. The post-COVID inflation cycle we all live in now includes adverse affordability trends more akin to four decades ago.
In the chart, I frame some notable medians across the decades as well as some major moves to highs and lows. The numbers speak for themselves. Among the highlight across the median is how low the median single family starts number was from 2009 to 2022 vs. history. With solid demographics tailwinds, that would appear to be too low. The builders frequently site a range of obstacles to the build rates going higher – and that was before mortgage rates spiked and COVID struck. That is a topic for another day, but the biggest categories were labor (skilled and semi-skilled) and subcontractor shortages, but with a lot of fingers pointed at local regulations.
The volume trends into 2023 will be very interesting given the good, bad, and the ugly of current industry dynamics. Even if it gets much uglier, the builders have proven themselves to be very cash flow resilient with their main assets carved out of negative pledge language (limitations on liens) to engage in refinancing if the world falls apart. That was demonstrated after the crisis. At this point, this is not a financial risk crisis for the builders by any stretch of the imagination.
Housing Units Under Construction and the economic activity factor…
Below I plot the time series for “New Privately-Owned Housing Units Under Construction” from Jan 2004 through current times. I start at Jan 2004 since that year started at a 1% fed funds rate and then the boom really kicked into gear with the subprime lending wave rolling alongside structured credit. Both ended badly, so housing anxiety creeps into the headlines more often of late (See Market Menagerie: Housing Questions of Ponder 10-27-22 and Wild Transition Year: Chaos of 2007 11-1-22).
The timeline for “Units Under Construction” highlights the lag effects of a collapse in starts and tight credit. Basically, it takes a while for run rates of residential construction activity to slow down. Starts and permits are leading indicators. Looking back, the lows in the 1-unit category for “under construction” rolled out across 2011 and reached the bottom in Dec 2011 at 222K. That came a few years after the starts collapse in early 2009. At 1,739K, the Total Under Construction level of Oct 2022 is very high in absolute context. At 812K, the 1-Unit tally for Under Construction in Oct 2022 is lower than the summer 2022 peak.
The Oct 2022 1-unit under construction statistic is higher than any pre-2022 month going back to the end of 2006. The Oct 2022 level of 812K units under construction is not too far from the peak bubble period in 2004-2006 but is well below the 985K of Oct 2005 and the 900K handle levels of the first 11 months of 2006.
The housing units under construction all translate into a lot of economic activity, jobs, materials demand, and credit extension going on in 2022 and 2023. The multiplier effect of the homebuilding ecosystem is alive and well, but it is also on a shorter fuse now. What comes next is the big debate. Lower mortgages would go a long way toward finding a less daunting consensus floor level for starts and construction activity in 2023.


