


Donald, did you say “blow up” again?
With the Saudis requesting help with the Houthis and sharing some missile defense supply problems, Trump has turned to openly musing about “whether to blow the entire nation up.” Then he talks about meetings with Iran and oil tanks. For now, the geopolitical game theory is more about roulette than poker. Chess was never on the list. The same applies to oil price effects as refined products seem to be the only one heading in one sustained direction near term – averaging higher. That is, unless the US bans diesel exports and upsets the oil companies while crushing some trade partners.
The past week set the course for more FOMC tightening in 4Q26 or at the very least assured independence with a 12-0 vote. The bear flattener hit short duration bonds harder this week with the 10Y UST reaching 5% (4.97% as we go to print). 30Y mortgages hit 7.2% in the Mortgage News Daily survey and 6.95% for the higher quality Freddie Mac benchmark (see Mortgage Rates vs. UST Curves: Spooky Memories to Ponder 9-20-26, UST Curve and FOMC: Mornings After 9-19-26)
Overall asset performance was weak in equities even if tech showed resilience (see Weekly Returns: Benchmarks and ETFs 9-20-26, Tech Check: Weekly Price Returns 9-20-26). The return bias was again on the negative side overall but not as bad as feared given the AI headlines, the FOMC action, and mixed views on oil as WTI was essentially flat around $100 Friday to Friday after making a brief leap to near $106 during the week. As we go to print today, WTI is below $96.
This week we get more consumer flavor from Costco earnings. We also get more housing color from KB Home (KBH) after weak numbers from Lennar last week as the #2 builder (see Lennar 3Q26: Metrics Keep Weakening 9-18-26).
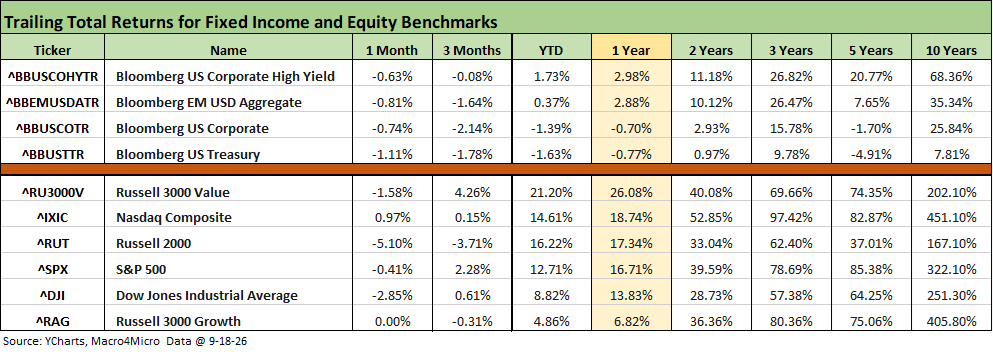
The above table highlights all negative fixed income returns for 1month and 3 months for these benchmarks. Equities have been erratic with 4 of 6 negative and one at 0% for the 1-month timeline with the Russell 2000 taking it on the chin.
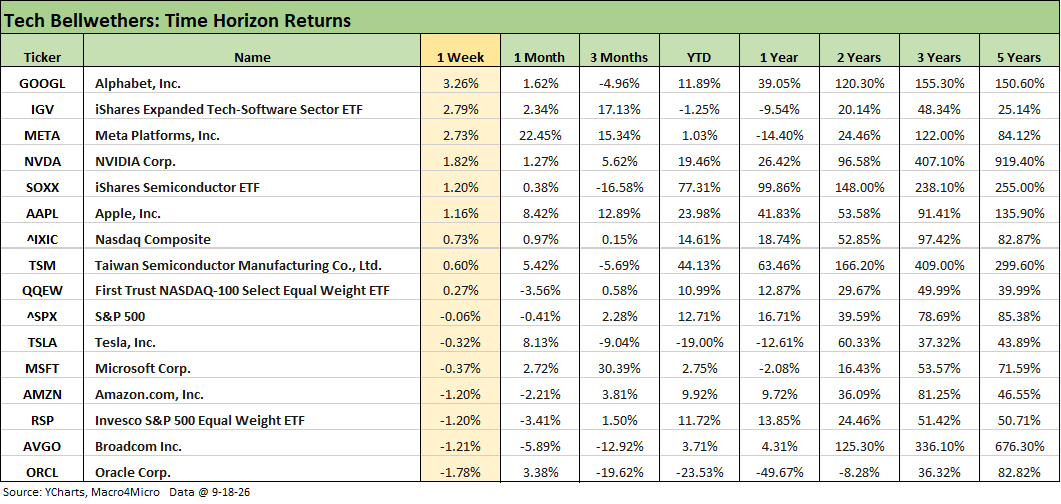
The tech bellwether list was mixed with 4 of the Mag 7 positive for the week with 3 negative. Oracle continues to struggle. The Semi ETF (SOXX) posts an unsightly -16.6% for 3 months but remains at +77.3% YTD. In contrast, the Software ETF (IGV) is +17.1% for 3 months but -1.25% for YTD.
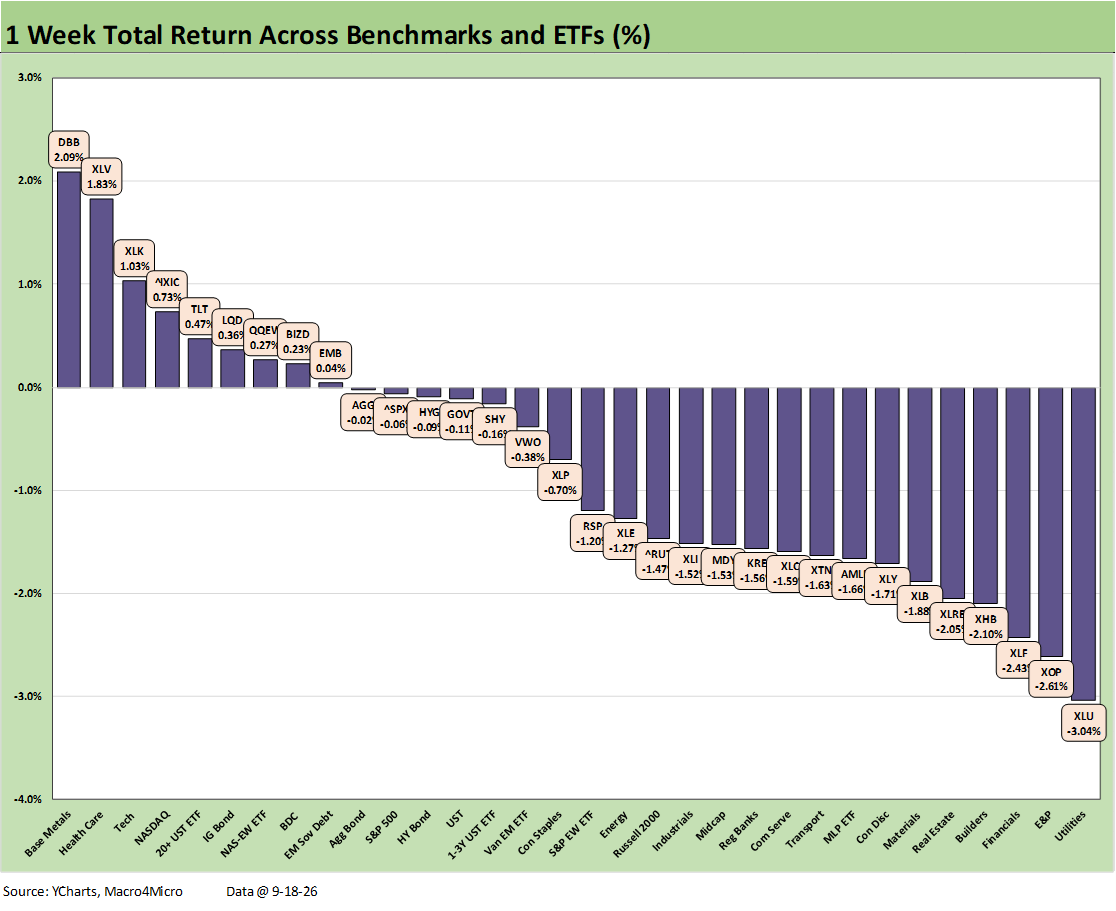
For the full rundown of the weekly return mix for the broad market benchmarks and ETFs please see our separate commentary. The 9-23 positive to negative score left little to brag about other than the fact it could have been worse with unfavorable UST news and too many headline threats over AI safety and regulatory needs (see Weekly Returns: Benchmarks and ETFs 9-20-26).
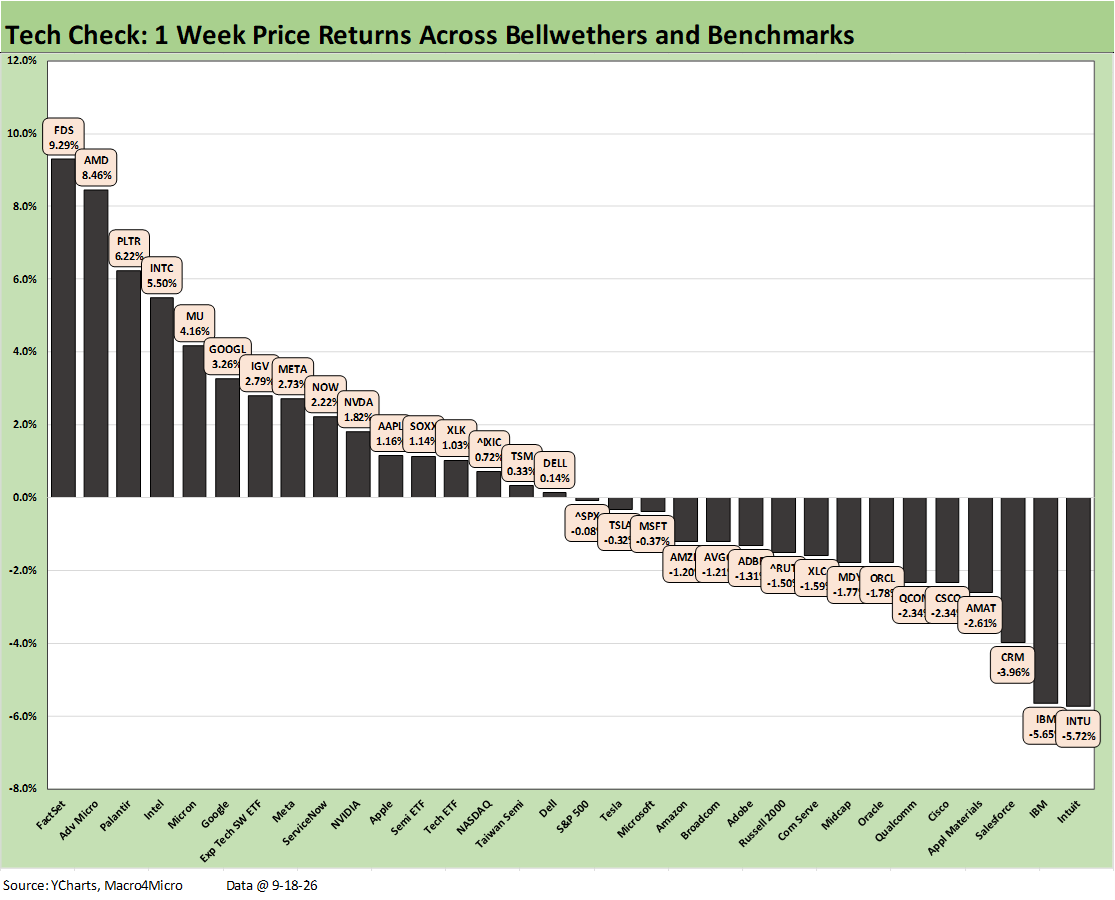
For the full rundown or weekly return mix for the Tech Check list of single names, tech ETFs, and broad market benchmarks please see our separate commentary. The commingling of the semiconductor and software names in the high and low quartiles was more balanced this week than in prior weeks in the 16-16 positive vs. negative score (see Tech Check: Weekly Price Returns 9-20-26).
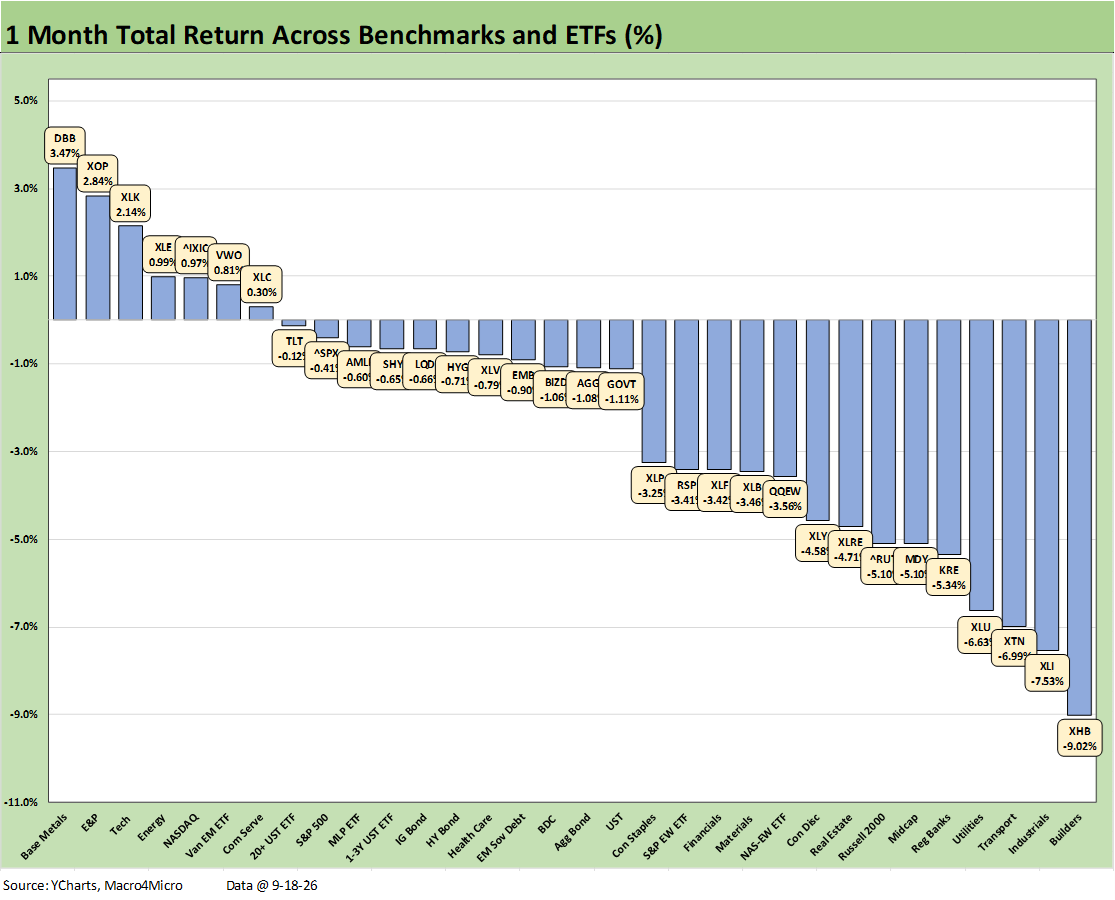
The 1-month benchmark and ETF returns highlight a difficult stretch for asset performance with a positive-negative score of 7-25. The winners are led by tech (XLK, NASDAQ, XLC), base metals (DBB) and oil (XOP, XLE). EM Equities (EM) also made the positive ranks. We only see the large cap NASDAQ in the top quartile with the tech-heavy S&P 500 just across the line in the 2nd quartile. Russell 2000 and Midcaps (MDY) sit in the bottom quartile.
The weakest performers on the month included those that are highly sensitive to FOMC tightening and rising longer term UST curve moves. We see Homebuilders (XHB) in dead last with Utilities (XLU) and Real Estate (XLRE) in the bottom quartile.
The worries around interest rates and potential slowdown and also the battering of diesel and heavy refined product users generally (including aviation fuel) are also evident with Industrials (XLI) and Transports (XTN).
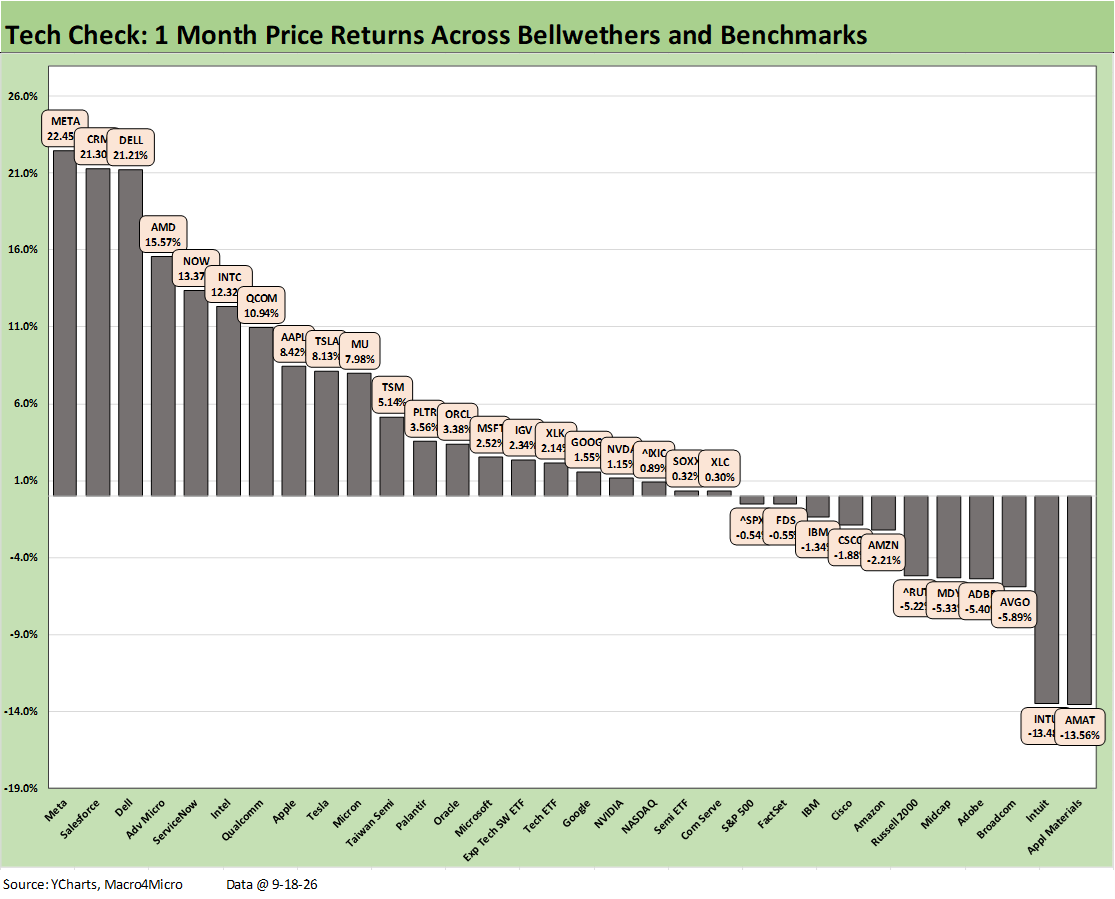
The Tech Check mix had a more respectable trailing month with a score of 21-11. The rankings blend a more diverse mix of semiconductors and software, and Mag 7 names were more notable in the top and bottom quartile. For example, the top 5 includes META at #1 with Salesforce (CRM) at #2 and ServiceNow (NOW) at #5. In the bottom quartile, we see Applied Materials (AMAT) in last place with Broadcom (AVGO) 3 off the bottom.
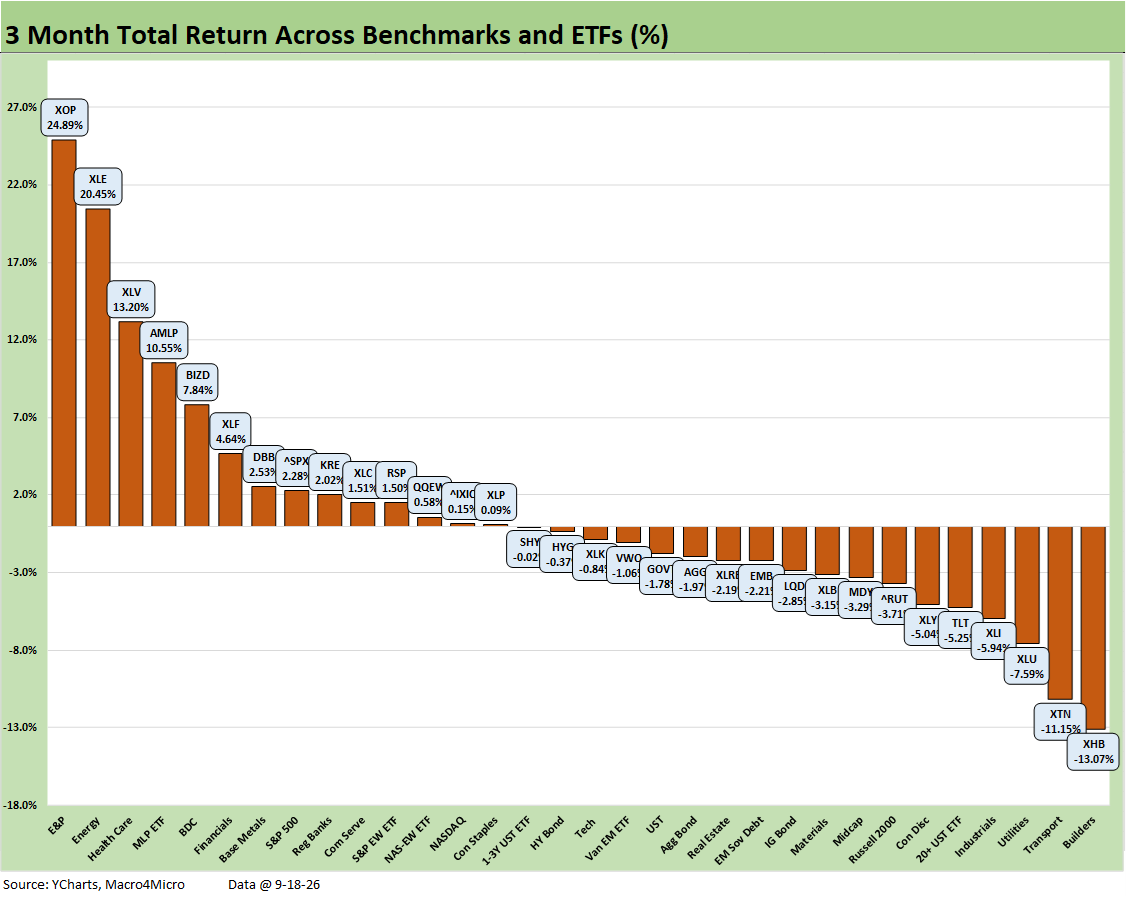
The rolling 3-month score of 14-18 on the broader benchmark and ETF asset lines is more favorable than the recent trends. We see weakness in the curve-sensitive sectors in equities and all 7 bond ETFs in negative range. The long duration 20+Y UST ETF (TLT) sits in the bottom 5. Homebuilders (XHB) again ranks last at -13.07% with oil, diesel, and fuel sensitive Transports (XTN) in 2nd to last.
The winners include energy-related equities in 3 of the top 4 slots with E&P (XOP) at #1, Energy (XLE) at #2, and Midstream (AMLP) at #4. The BDC ETF (BIZD) ranked in the top 5 as the asset quality disaster fears eased with another round of earnings and more pushback from the managers of the BDC’s. The worries around rising private default rate risk are certainly not gone even if the “overseers” of the default rate numbers vary notably.
Either way, the structural risks of a public BDC with a portfolio that can be tracked and priced into the net asset value is different than a massive private credit exposure subject to redemption risk where illiquid assets might be exposed to mark-to-market risk by selling into a buyers’ market that drives material repricing.
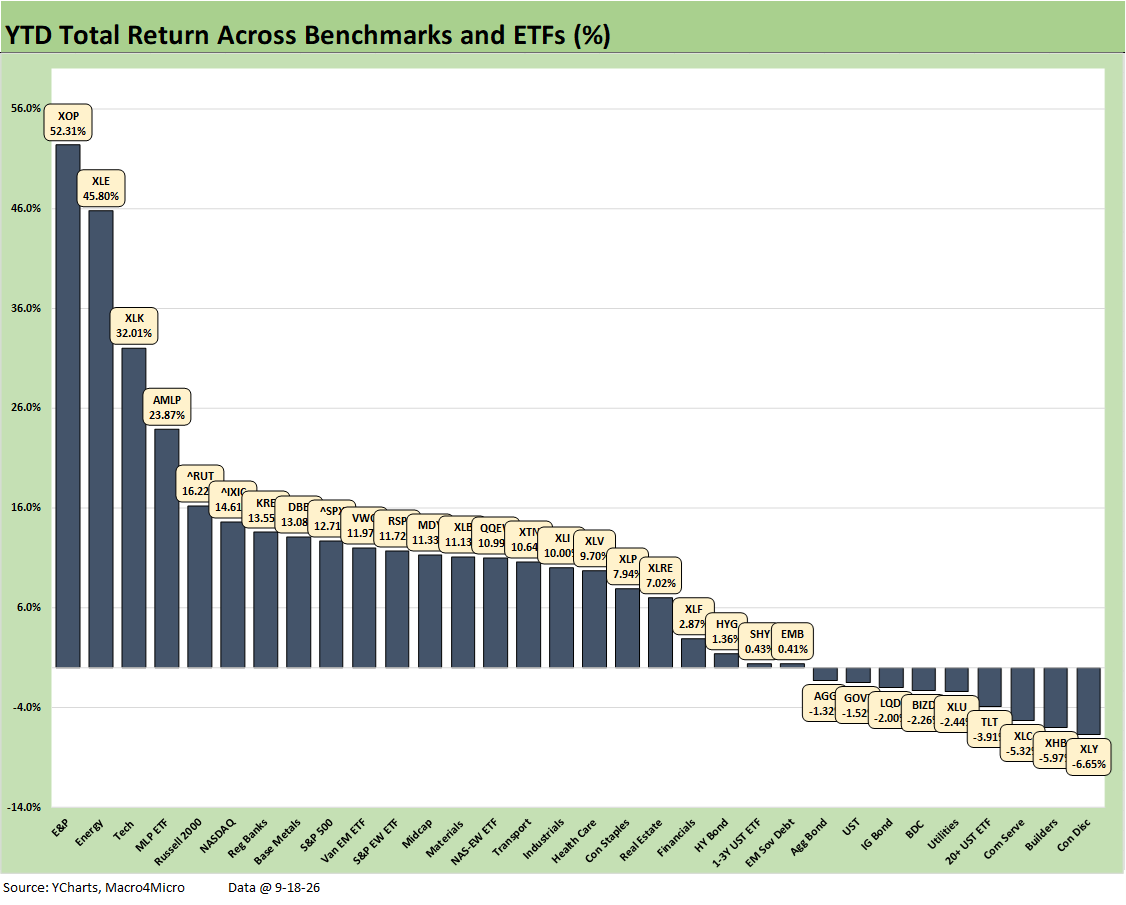
The YTD returns for the broader mix posts a score of 23-9 with Energy in 3 of the top 4 slots broken up by the Tech ETF (XLK) at #3 with Russell 2000 #5. The top quartile was filled in with NASDAQ, the Regional Bank ETF (KRE), and Base Metals (DBB). That is a healthy mix of commodity-based names, tech, and financials.
The asset line returns in the red include 4 bond ETFs (TLT, LQD, GOVT, AGG) with 3 slightly positive (EMB, SHY, HYG). Consumer Discretionary (XLY) sits in last place with Homebuilders (XHB), Communications Services (XLC), the long duration 20+Y UST ETF (TLT) and Utilities (XLU) rounding out the bottom 5.
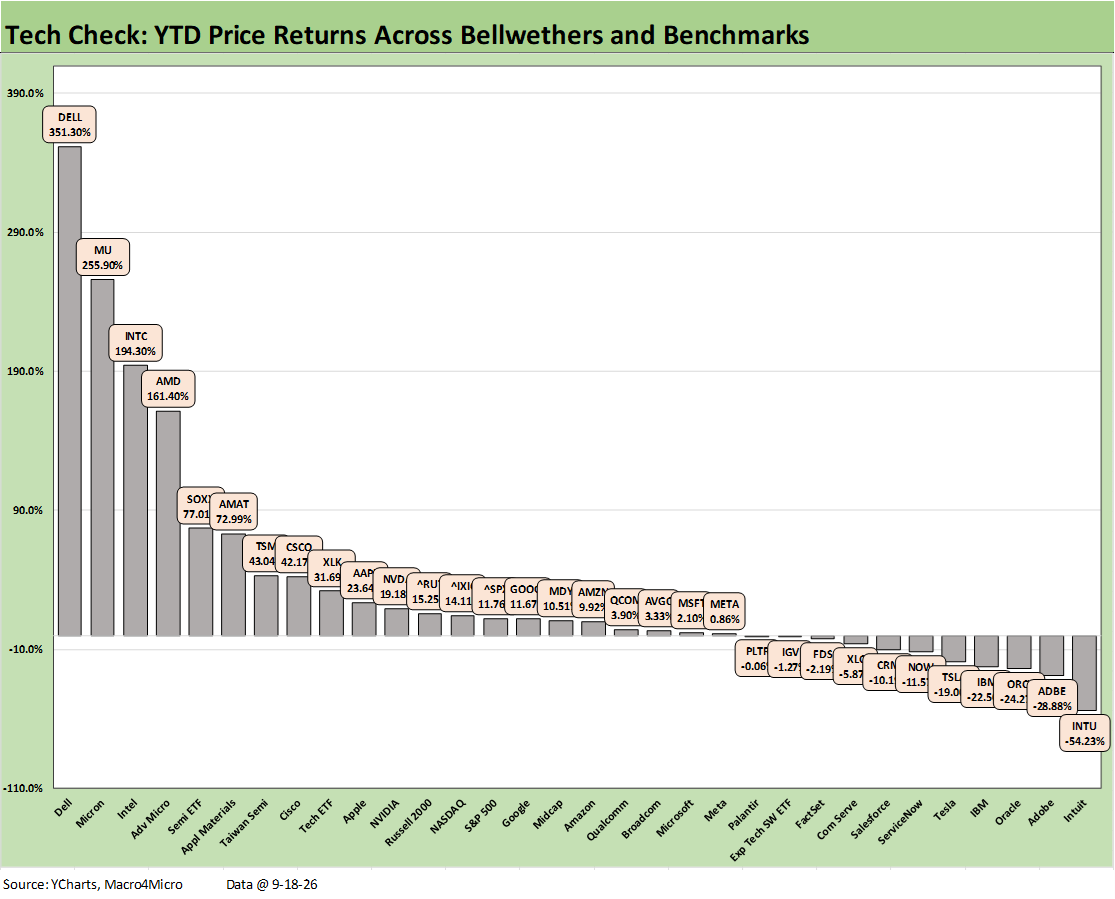
The YTD Tech Check mix has not morphed much after a dramatic run through the the 1H26 period with the top quartile dominated by Semiconductors and AI Infrastructure bellwethers including DELL at #1 with its major role in data center spending. Micron (MU) and Intel (INTC) are in the top tier that also includes Advanced Micro (AMD), Semiconductor ETF (SOXX), Applied Materials (AMAT), Taiwan Semi (TSM), and Cisco (CSCO) as a bellwether beneficiary of the AI boom.
The bottom quartile has been consistent with major concerns around how the software and SaaS-based services business models will come out on the other side of the “AI tunnel.” Intuit has struggled the most at -54.2% while other software-based plays have attempted to mount rallies and gain market support across earnings season. Tesla has also been mired in the bottom quartile YTD as the only Mag 7 name in the tank. That said, META, MSFT, and AMZN are in the 3rd quartile with META less than 1% YTD.
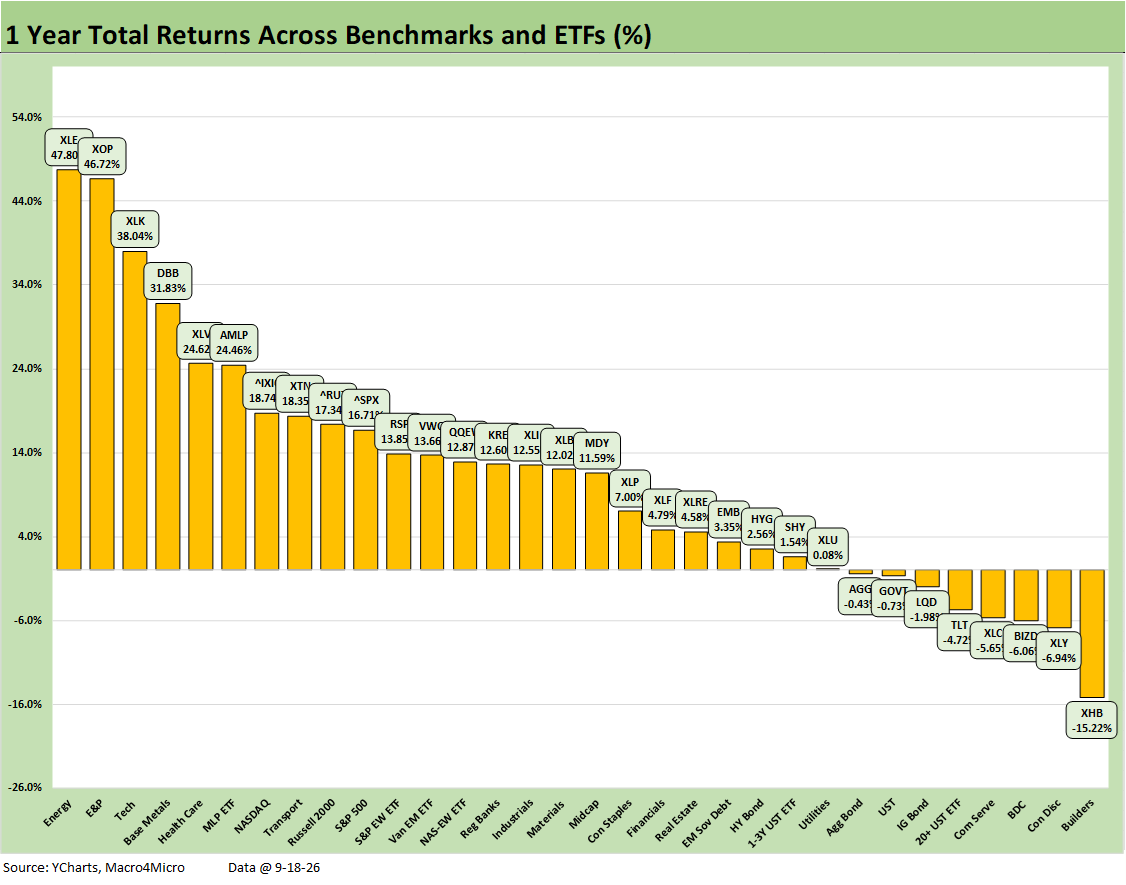
The trailing 1-year returns have gradually added to the negative return ranks after spending a good part of the year with only 1 or 2 in the red (typically BIZD). Homebuilders have been punished by higher mortgage rates and weak housing fundamentals. That was demonstrated recently by Lennar as the #2 Homebuilder (see Lennar 3Q26: Metrics Keep Weakening 9-18-26). The XHB return of -15.2% was more than double the 2nd to last asset line with Consumer Discretionary (XLY) at -6.94%.
The LTM winners are the usual suspects led by energy and tech. Those were joined by pharma-heavy Healthcare (XLV) with Transports (XTN) squeezing in on the strength seen before the Iran diesel crisis. Earlier, the AI boom drove a lot of multiplier effect benefits for freight and logistics.
See also:
Mortgage Rates vs. UST Curves: Spooky Memories to Ponder 9-20-26
Weekly Returns: Benchmarks and ETFs 9-20-26
Tech Check: Weekly Price Returns 9-20-26
UST Curve and FOMC: Mornings After 9-19-26)