


The asset pricing picture is getting more abstract.
As we have covered the past two weeks, a massive UST rally set against rising inflation and an oil price spike above $100 makes for a strange mixture of inputs and dislocations from the usual cause and effect patterns. AI nerves seem to be taking over the broader story line.
The increased focus on credit risk and rising credit derivative activity will naturally raise questions on whether the unlimited supply of debt and equity capital will get more disciplined, skeptical, and/or more defensive. That of course flows into pricing credit as well as equity capital when the AI ecosystem needs a lot more of both.
Musk trash-talking credit quality in the neocloud subsector is not an aphrodisiac for more cheap and bountiful credit availability even if more investors get directed his way as he seeks domination of more business lines. As usual, he will likely succeed.
The impressive UST curve rally rewarded bonds but is not the “good kind” of rally when oil and inflation is rising and core demand fundamentals remain steady in the overall economy.
We get a slew of key feedback and data released this week including the FOMC statement, PCE inflation and income/outlays details, and the advance estimated for 3Q26 GDP. Framing flight-to-quality flows is a highly subjective call over time when inflation, oil, and UST supply chaos point at higher rates.
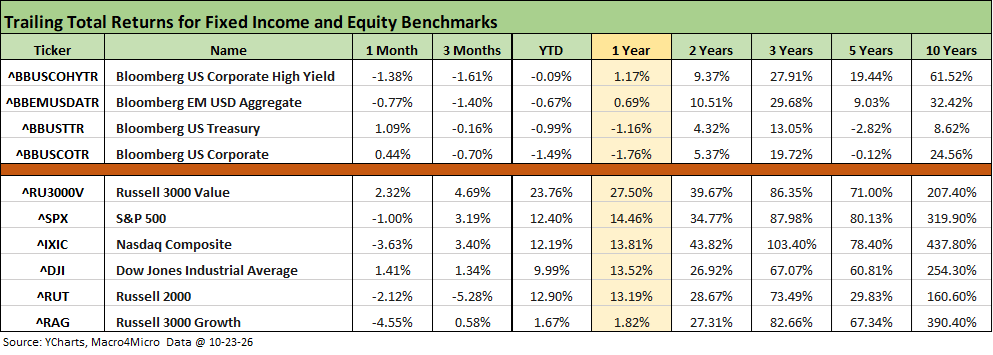
The above table updates the time horizon returns for the debt and equity benchmarks we monitor. We see bonds mounting a comeback with the past two weeks bringing substantial curve relief and supporting duration returns. We see two asset lines in positive range for the month. The trailing 3 months are still all negative and the same YTD.
The painful bear flattener YTD still rules even with the long end rally in the recent AI turmoil. The YTD 2Y UST ended last week at +122 bps YTD and the 10Y at +82 bps. That has been tough on financing costs for the consumer and industrials in areas such as vehicles and equipment but also for the 30Y mortgage rates driven by the 10Y. Housing is suffering.
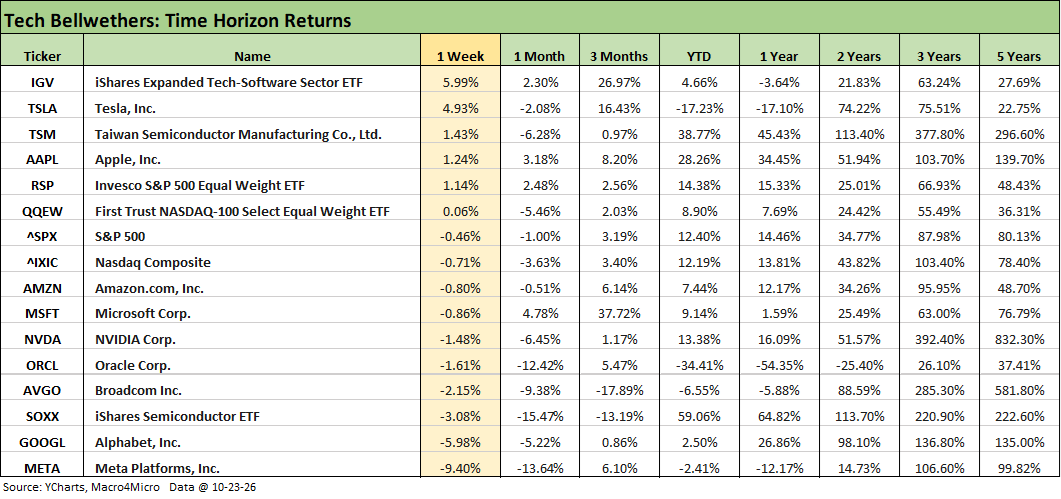
The tech bellwethers had another mixed month with 5 of the Mag 7 posting negative returns and the Semiconductor ETF (SOXX) in the red and over 9 return points behind the Software ETF (IGV), which took the #1 ranking this week.
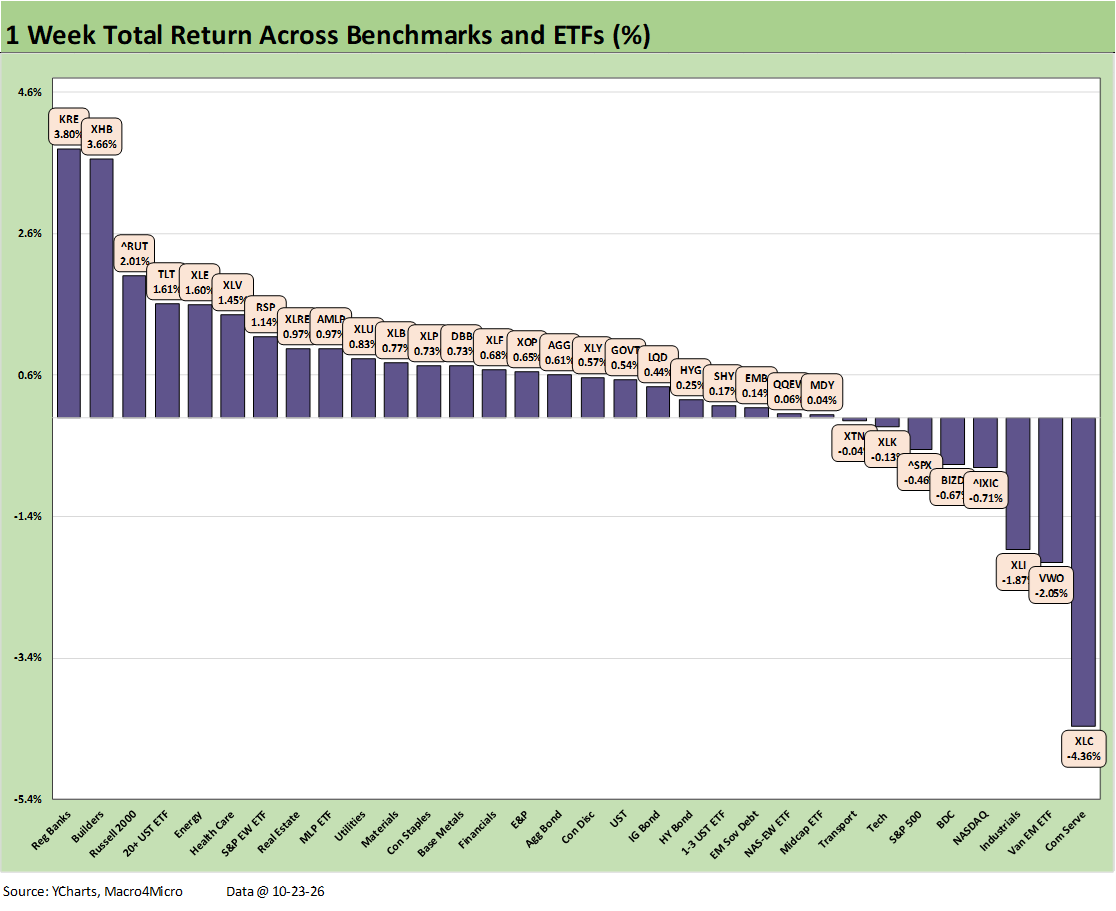
We already posted a commentary on the weekly returns for the broader group of 32 benchmarks and ETFs (see Weekly UST Deltas: Flight Effects vs. Inflation 10-25-26). The score of 24-8 was good news for breadth. The fact that the S&P 500 and NASDAQ were in the bottom quartile and the Russell 2000 and Equal Weight S&P 500 (RSP) were in the top quartile also revisited the obvious fact of tech domination at the headline level.
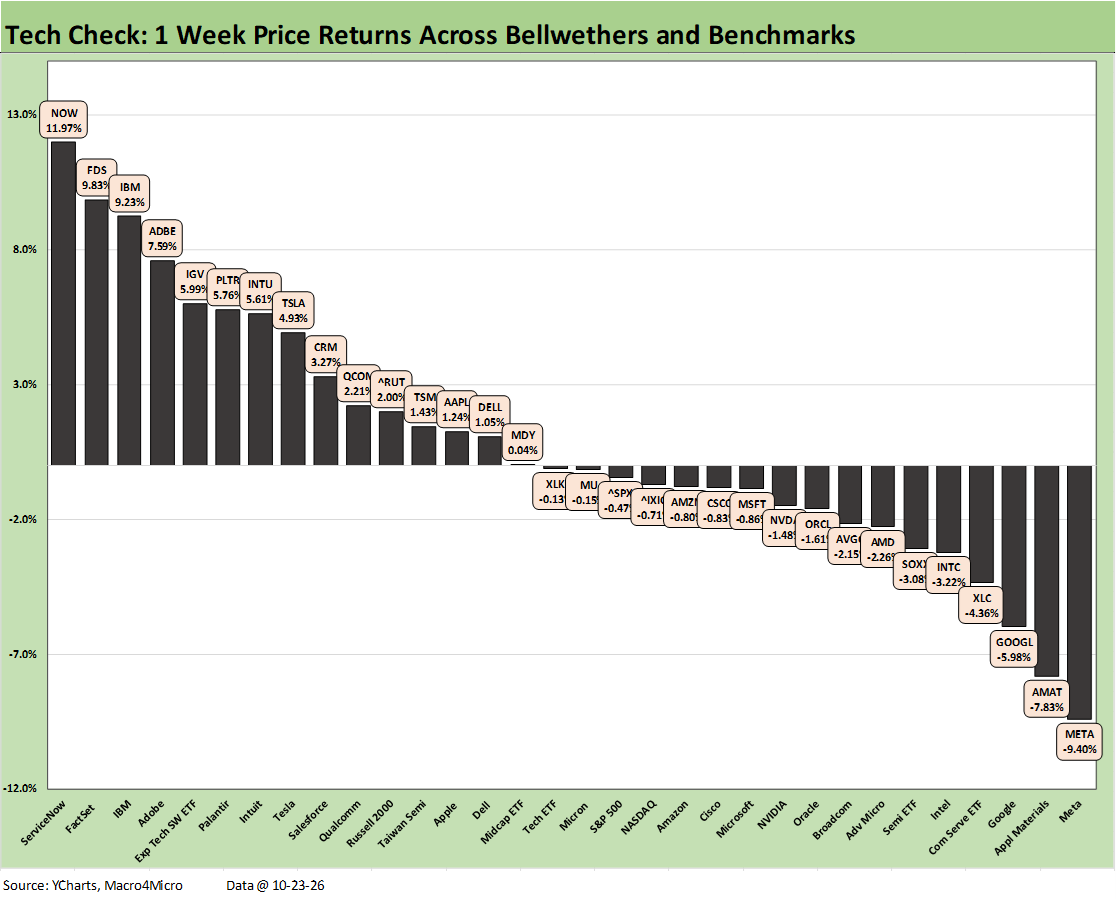
We already posted a commentary on the weekly Tech Check list and relative performance at the benchmark, ETF, and bellwether single name level (see Weekly Asset Returns: Tech Check 10-25-26). The week presented another picture of a “software/SaaS comeback” on the left in the top tier and “AI ecosystem valuation fear” in the bottom quartile. Meta was in last place despite a good quarter as capex anxiety remains a major theme.
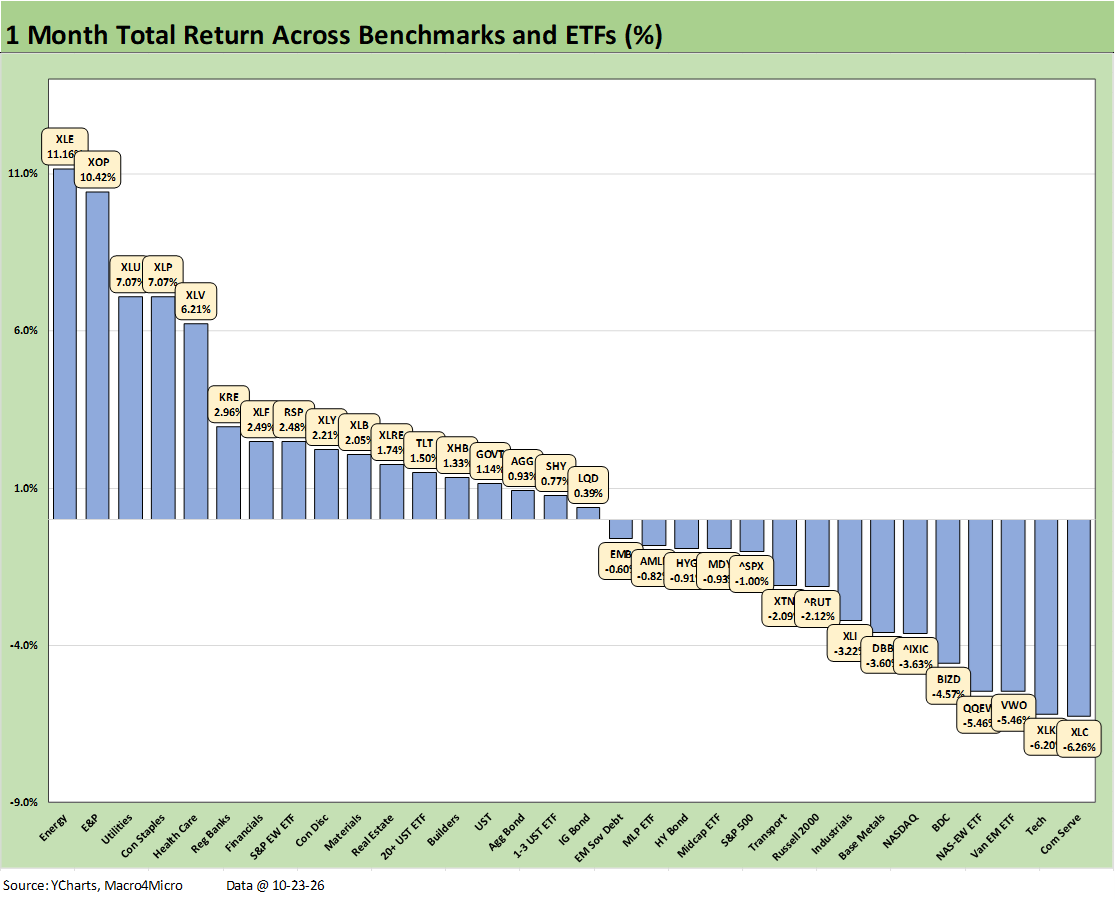
The 1-month score for the broader mix of asset lines was 17-15 with tech in the red zone again leading the count in the bottom quartile. Communication Services (XLC) was in last with the Tech ETF (XLK) just ahead of it. NASDAQ was also in the bottom tier along with the Equal Weight NASDAQ 100 (QQEW).
Notably, the Equal Weight S&P 500 ETF (RSP) was in the top tier, but the S&P 500 was in the lower half of the 3rd quartile in the red.
The winners included Energy (XLE) at #1 and E&P (XOP) at #2 with defensive and dividend heavy ETFs in the top tier. In a positive sign for bank health and earnings reports, the Regional Banks (KRE) and Financials (XLF) were in the top tier. The financial system vote of confidence matters in a volatile market.
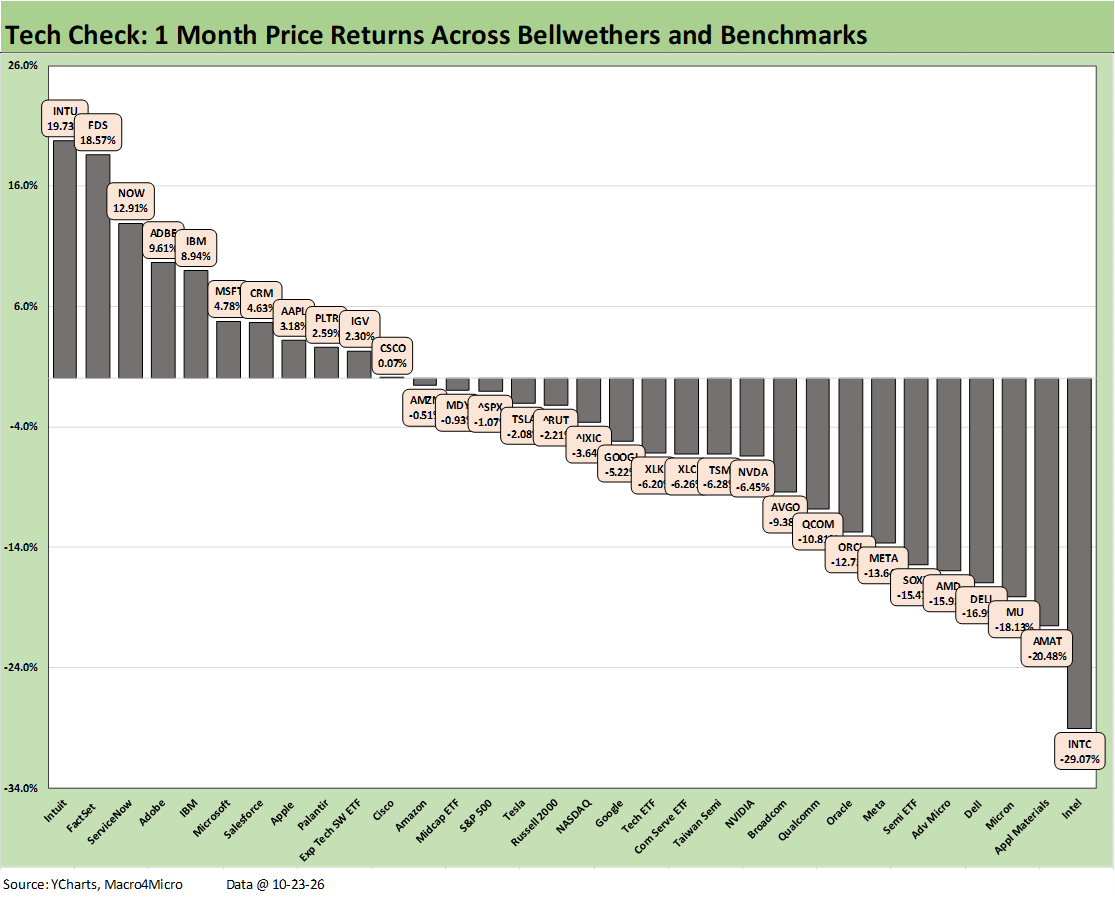
The 1-month Tech Check mix shows the fallout from AI ecosystem jitters and repricing in semiconductor stocks as we covered along the way. The 11-21 score shows the comeback of software and SaaS names, which includes more than a few that are still in the red YTD as detailed in a chart further below.
We see 2 of the Mag 7 in the red spread across all the quartiles with 1 name (META) in the bottom quartile and MSFT and AAPL in the top quartile.
We see the bottom 6 all directly tied to semiconductors (INTC, AMAT, MU, AMD, SOXX) or AI infrastructure needs (DELL). Meta and Oracle were in the upper end of the bottom quartile. The Software ETF (IGV) is 17.7 points ahead of the Semiconductor ETF (SOXX).
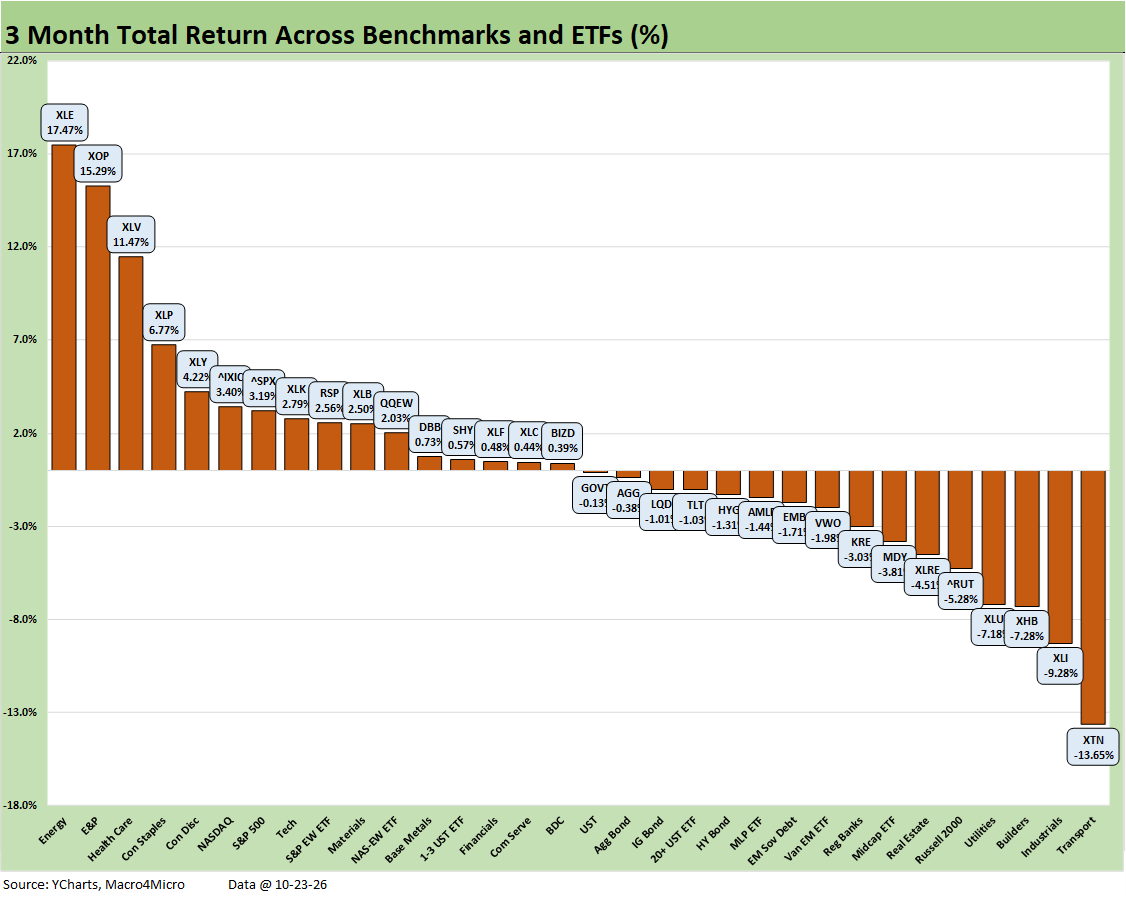
The 3-month score for the broader group of 32 is 16-16 with 6 of 7 bond ETFs in the red despite the rally of the past 2 weeks. Only the short duration 1-3Y UST ETF (SHY) edged into positive range.
We see how energy costs hit Transports (XTN), which ranked last at -13.65%. That is ugly. The cost pressures have been flowing into any combination of margin erosion or inflation across numerous industries as evident in PPI and CPI readings. Energy (XLE) and E&P (XOP) accordingly took the top 2 slots with defensive and quality dividend sectors rounding out the top 4 with Health Care (XLV) and Consumer Staples (XLP).
The bottom tier also features Homebuilders (XHB) and Real Estate (XLRE). The slide in Industrials (XLI) should be watched since fixed investment and the macro cycle has been steady, but interest rates and cost stress can weigh on a wide range of manufacturing equipment categories globally. Tariffs and material costs are weighing on numerous subsectors.
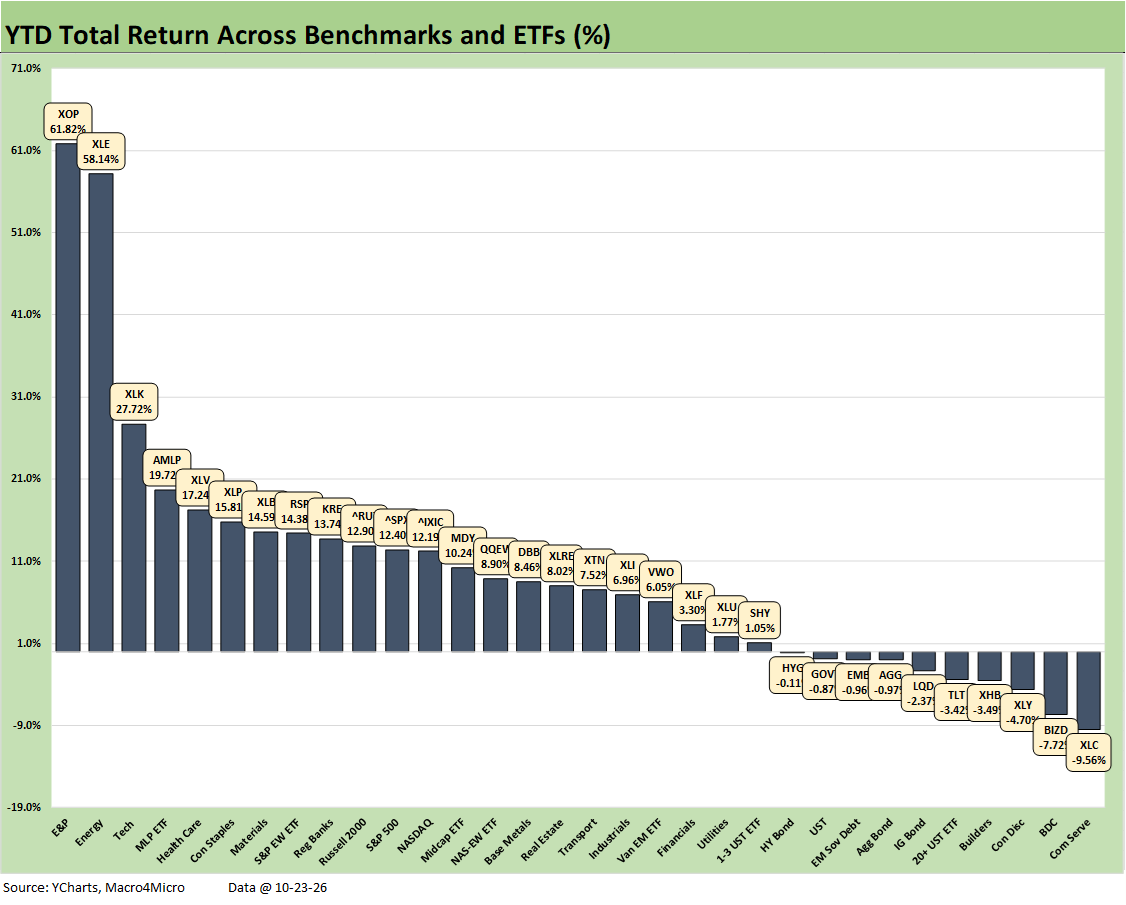
The YTD returns for the broader group of 32 asset lines weighs in with a score of 22-10 with 6 of the 10 in the red comprised of bond ETFs.
Communication Services (XLC) holds down last place. XLC had poor performance from names such as AT&T (T), T-Mobile (TMUS), Take-Two (TTWO), and AppLovin (APP) along with mediocre performance from Meta (META) and Alphabet (GOOGL).
BDCs (BIZD) also felt the drag of private credit fears and challenges both real and imagined around underwriting excess and the quality of marks.
Homebuilders (XHB) felt the mortgage rate rise, the tariff costs, labor disruptions, and pricing and margin pressures across the builders.
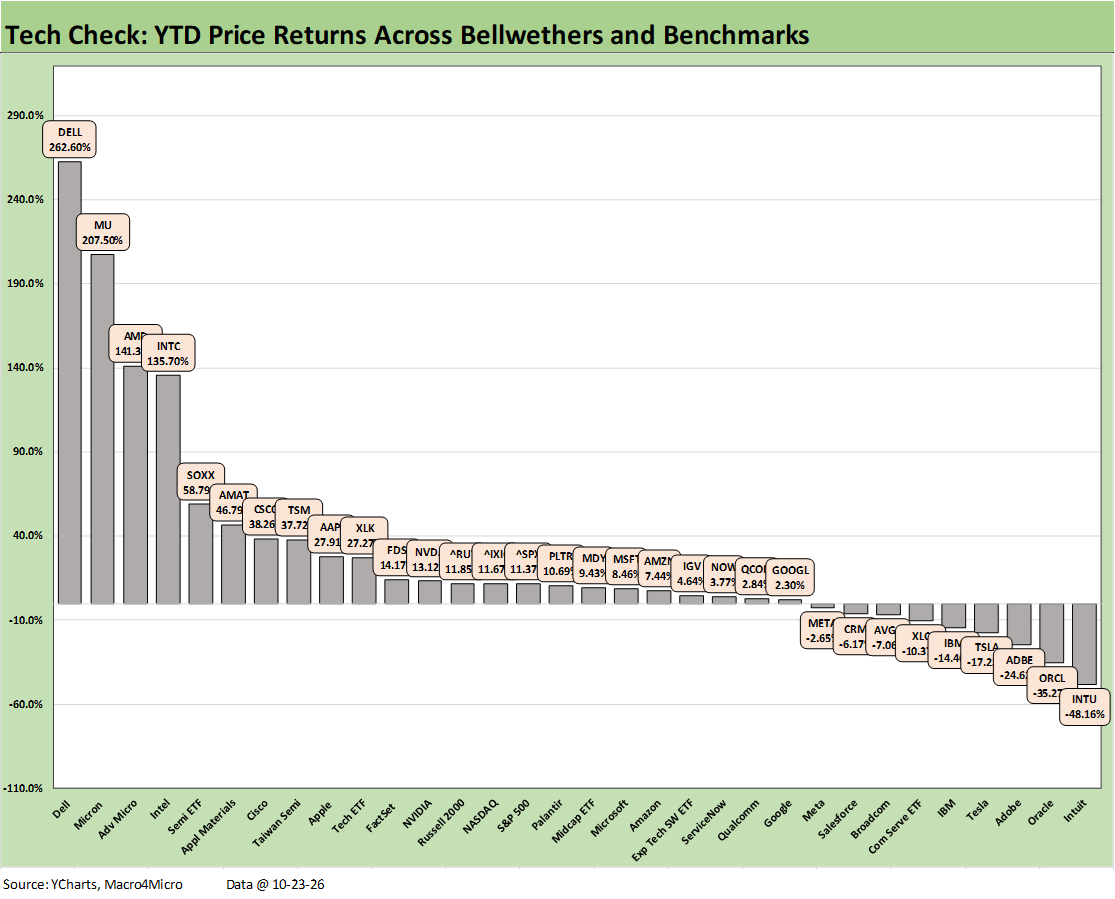
The YTD story line shows Hi-Lo performance gaps that will be a scoresheet for the ages on returns with a 23-9 for positive vs. negative. The Hi-Lo differential (Dell vs. Intuit) is 311 points. If we throw out the Hi-Lo returns and use the next two (Micron vs, Oracle), we are still at a stunning 243 points.
Semiconductors and the AI ecosystem were off the charts while software and SaaS services names were a victim of fears around business models that the market is still trying to sort out.
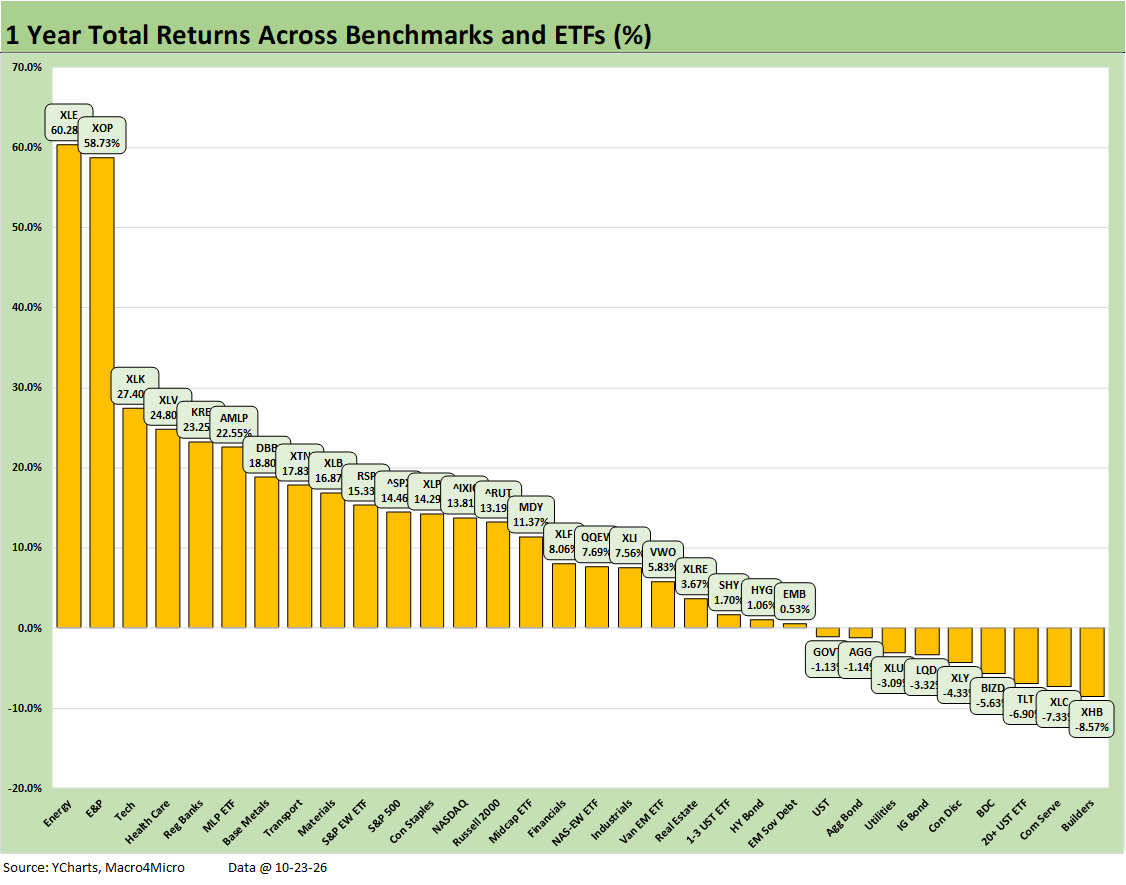
The LTM returns at 23-9 reflect an increase in the number of negative LTM returns from a low single-digit asset count in recent months. The list was 31-1 at the end of June with only the BDC ETF (BIZD) in the red at that point at -13.5%.
We see 4 of the 7 bond ETFs in the red for the LTM period. We see positive returns for the short duration 1-3Y UST ETF (SHY), HY (HYG), and the EM Sovereign Bond ETF (EMB). Homebuilders (XHB) sit in dead last while Communication Services (XLC) is again near the bottom.
Much of the tech pain has been mitigated by the early 2026 windfalls and energy boom with 3 energy names in the top quartile (XLE, XOP, AMLP) joined by the Tech ETF (XLK). Even Transports (XTN) made the top quartile as travelers could revel in the wealth effects and even more recently push past the fare spikes. Freight and logistics names have benefited from the investment boom for the LTM period even as some have sold off recently on cost pressures and diesel pain.
See also:
Yield Curve Migration: Wrong Kind of UST Rally10-25-26
Weekly UST Deltas: Flight Effects vs. Inflation 10-25-26
Weekly Asset Returns: Tech Check 10-25-26
Weekly Returns: Benchmarks and ETFs 10-25-26
Synchrony as Consumer Credit Proxy: Steady as She Goes 10-21-25